 Fourplex
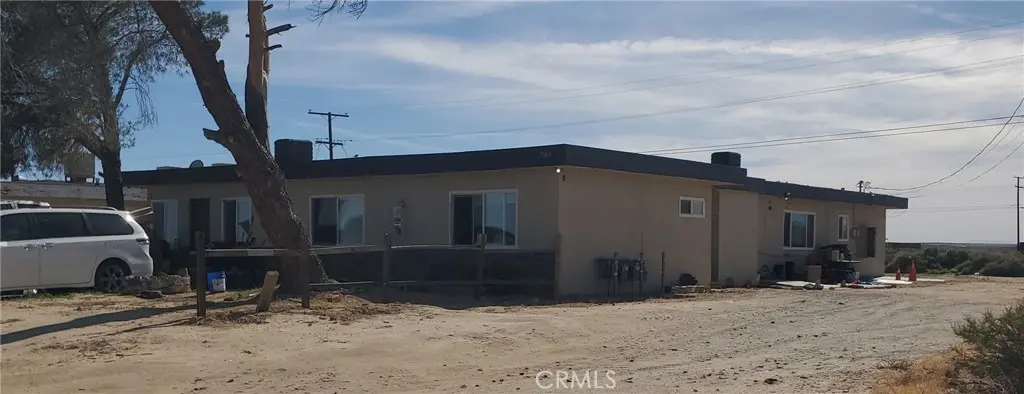
13401 Davenport · North Edwards, CA
Flood risk 1/10 · Minimal
- FEMA flood zone
- A
- Chance of flooding over 30 yrs
- 0.0%
- Est. flood insurance / yr
- $1,009 – $1,996
Fire risk 3/10 · Minor
- Est. fire insurance / yr
- $659 – $1,223
Heat risk 8/10 · Major
- Hot days now (above 101°F)
- 7 days/yr
- Hot days in 30 yrs
- 19 days/yr
Wind risk 1/10 · Minimal
- Chance of severe wind over 30 yrs
- —
Air-quality risk 6/10 · Moderate
- Unhealthy air days now
- 10 days/yr
- Unhealthy air days in 30 yrs
- 13 days/yr
Risk factors via First Street. Map © Google.
Why this score? — see what drove the B grade
The composite is a weighted blend of 9 inputs, each scored 0–100. Each bar is that input's sub-score; the figure is the points it added to the 100-point composite (weight × sub-score).
- Cash flow +30.0/30.0
- DSCR +10.0/10.0
- 1% rule +7.8/10.0
- ARV discount +7.5/15.0
- Appreciation +4.7/10.0
- Livability +2.7/5.0
- Schools +2.6/10.0
- Rent growth +2.5/5.0
- Condition / age +2.5/5.0
$375,000
🖨 Deal sheet 📄 Offer letter ✓ Due diligence
Multi-family units
County records classify this as Multi-Family (2-4 Unit). Listing-text estimate: 4 units. confirmed
Listing remarks MLS
Profitable multi units 2 apartments 2 beds 1 bath, 2 units 1 bed/1 bath, 4 in total. There are 2 units rented. Possible income over $4,000 monthly
Key facts
- 9,469 sq ft lot
- Built 1964
- Listed 44 days
Property features AI
Finance
- Other: Total of 4 dwelling units; Lot characterized as 0-1 unit per acre; Living area sourced from assessor
Exterior
- Utilities: Public/District water; Septic (type unknown)
- Home design: Quadruplex (attached property); Single-story (1 story); Entry level is the first floor
- Construction: Year built from assessor; 2+ common walls
- Exterior features: No pool; Rural community setting; Paved road access; Has a view
Interior
- Bedrooms: Six bedrooms on the main level
- Flooring: Concrete flooring
- Bathrooms: Four full bathrooms on the main level
- Heating & cooling: Evaporative cooling
- Interior features: One-level layout; Front and side entry locations; All bedrooms on the main level; Living room; Living room fireplace; Evaporative cooling
- Laundry & utility: No on-site laundry listed
Neighborhood map
What this means for you Summary
Snapshot
- This is a 2×1.5bd/1.0ba + 2×1.0bd/1.0ba units multifamily listed at $375k.
Deal economics
- At list price, monthly cash flow is $1k ($17k/yr) — positive. Per door: $347/mo.
- The deal already cash-flows at list — no discount required.
- Meets the 1% rule at list price ($5k rent vs $375k).
- Recommended offer: $364k (3.0% below list) — sets the bar for market timing.
Location & tenants
- Location reads 53/100 on livability (#930 in CA) — a working-class tenant base; expect higher turnover. Strengths: housing A+, cost of living A; Watch: employment D, schools F, crime F.
- Muroc Joint Unified (rural): math 22% / reading 39% proficiency, ranked #340 of 517 in CA (top 66%) — families likely to look elsewhere, expect single-tenant / working-renter base with shorter leases.
- Market conditions: 92 active listings in the ZIP; 3,244 units permitted in Kern County in 2024 (73 in 5+ unit buildings).
Forward outlook
- In year one you build about $41 of equity ($3k loan paydown + $-3k appreciation (-0.7% local appreciation)).
- Kern County population projected at +17% by 2050 — long-run rental-demand tailwind backs the buy-and-hold thesis.
- At projected returns (-0.7% appreciation + 3.0% rent growth), your $105k cash investment doubles in ~6 years — after that, you're playing with house money.
Negotiation context
- It's been on market 45 days — a 3% lower offer ($364k) is reasonable based on typical stale-listing flexibility.
- 8 sale attempts since 23y ago with the ask held roughly flat each time — persistent listings suggest the price (not the market) is what's stuck; bring a comps-based counter.
- Current owner paid $90k; list at $375k implies a 317% gain — meaningful room to come down on a strong offer.
Risks & watch-outs
- Watch-outs: flood insurance adds $125/mo.
- Climate carrying-cost: in FEMA flood zone A (mandatory federal flood insurance); extreme-heat days projected 7→19/yr by 2055 (HVAC capex compounding) — expect insurance premiums to compound above CPI over the hold.
Questions for the listing agent
- It's been on market 45 days. Have you received any prior offers? Is the seller open to a 3% concession, seller financing, or rate buy-down credit?
- Can we see the unit-by-unit rent roll, current vacancy, and any below-market leases? What's the average tenancy length?
- What capital expenditures (roof, boiler, parking lot, exteriors) have been made in the last 5 years, and what's planned in the next 2?
- Built in 1964 — when were the roof, HVAC, electrical panel, plumbing, and water heater last replaced?
- What's the actual annual flood-insurance premium (NFIP or private), and is the property in a SFHA with mandatory coverage?
- Is there a deadline driving the sale (1031 exchange, divorce, estate, relocation)? That informs how much negotiation room exists.
- Schools are F-rated, which usually means shorter tenancies and higher turnover. Who's the typical renter profile here, and what's been the actual vacancy rate?
- Crime grade is F in this area — have there been break-ins, vandalism, or insurance claims at this property in the last 3 years? What carrier currently insures it and at what premium?
- What's the average days-on-market for RENTAL listings here right now (not sales)? A rising rental-DOM trend means longer vacancies and softer asking-rent achievability than the comps imply.
- What's the recent tenant-quality profile in this submarket — average credit score on applications, eviction rate, late-payment / NSF rate, and stable-employment percentage? A property-management company in the area should have these aggregated.
- How much new apartment / multifamily construction is in the pipeline within 1–3 miles? Heavy new supply (>2% of stock underway) typically softens rents 12–24 months out; light construction supports rent growth.
Investment metrics
- 1% rule
- 1.28% ✓
- Cap rate
- 11.13%
- Cash-on-cash
- 17.29%
- DSCR
- 1.77
- GRM
- 6.5
CMA / ARV
No comps found within radius.
Projected returns pro-forma
-0.68% appreciation · 3.0% rent growth · sell at horizon
- IRR
- 13.5%
- Equity multiple
- 1.62×
- Total profit
- $65,546
- Equity at exit
- $96,303
- IRR
- 19.0%
- Equity multiple
- 2.97×
- Total profit
- $206,953
- Equity at exit
- $106,141
Cash invested: $105,000 (down + closing). Projections, not guarantees.
Landlord ↔ Tenant lean methodology
- Overall (STATE)
- 18 Strongly Tenant-Friendly
- State California
- 18 Strongly Tenant-Friendly · D+13
- County
- — inherits STATE
- City
- — inherits STATE
ZIP-level market 93523
- Home prices YoY
- -0.2%
- Active inventory
- 92
- Price-to-rent
- 26.0×
Monthly cashflow live
- Estimated rent
- $4,800 medium interval (Pro) →
- Mortgage (P&I)
- −$1,967
- Tax from tax record
- −$156 /mo · $1,875/yr
- Insurance
- −$156
- Flood insurance flood zone
- −$125 /mo · $1,502/yr
- HOA
- −$0
- Vacancy / Maint / Mgmt
- −$1,008
- Net cashflow
- $1,388
Break-even live
4-unit breakdown (identical units grouped — click to expand)
| Units | Beds | Baths | Est. rent |
|---|---|---|---|
| 2× units | 1.5 | 1 | $2,400 |
| #1 | 1.5 | 1 | $1,200 |
| #2 | 1.5 | 1 | $1,200 |
| 2× units | 1.0 | 1 | $2,400 |
| #3 | 1.0 | 1 | $1,200 |
| #4 | 1.0 | 1 | $1,200 |
| Total (4 units) | $4,800 | ||
UW: 25.0% down · 7.5% · 30yr · 1.5% tax · 5.0% vac · 8.0% maint · 8.0% mgmt
Financing live
Cash to close
- Down payment
- $93,750
- Closing costs
- $11,250
- Reserves months
- —
- Total cash needed
- —
Loan-product check · same deal, 3 products live
Conventional
25% down · 7.5% · 30yr
- Down + closing
- —
- Monthly P&I
- —
- Monthly cashflow
- —
- DSCR
- —
- Eligible?
- —
Personal DTI + credit; lowest rate.
DSCR
20% down · 8.5% · 30yr
- Down + closing
- —
- Monthly P&I
- —
- Monthly cashflow
- —
- DSCR
- —
- Eligible?
- —
No personal income docs; deal must DSCR.
Hard money
10% down · 12.0% · 12mo
- Down + closing
- —
- Monthly P&I
- —
- Monthly cashflow
- —
- DSCR
- —
- Eligible?
- —
Short-term bridge; refi at stabilization.
Listing history 33 events
-
2026-06-18days on market $375,000 Active 45 DOM
-
2026-06-17days on market $375,000 Active 44 DOM
-
2026-06-16days on market $375,000 Active 43 DOM
-
2026-06-15days on market $375,000 Active 42 DOM
-
2026-06-13days on market $375,000 Active 40 DOM
-
2026-06-13days on market $375,000 Active 39 DOM
-
2026-06-09days on market $375,000 Active 36 DOM
-
2026-06-08days on market $375,000 Active 35 DOM
-
2026-06-07days on market $375,000 Active 34 DOM
-
2026-06-04days on market $375,000 Active 31 DOM
-
2026-06-03days on market $375,000 Active 30 DOM
-
2026-06-02days on market $375,000 Active 29 DOM
-
2026-06-01days on market $375,000 Active 28 DOM
-
2026-05-31days on market $375,000 Active 27 DOM
-
2026-05-04$375,000 Active 96-char remark
-
2026-04-30$375,000 Active 146-char remark
Show marketing remark (146 chars)
Profitable multi units 2 apartments 2 beds 1 bath, 2 units 1 bed/1 bath, 4 in total. There are 2 units rented. Possible income over $4,000 monthly
-
2024-10-30historical
-
2024-09-16status Active
-
2024-09-04status Pending Sale
-
2024-05-03$355,000 Active
-
2024-02-29historical
-
2023-09-27price $355,000
-
2023-09-27price $355,000
-
2023-09-19$360,000 Active
-
2023-07-24Active
-
2020-09-01soldstatus $90,000
-
2019-09-01historical
-
2019-02-24$169,000 Active
-
2015-03-19historical
-
2003-12-02soldstatus $87,500
-
2003-10-16$87,500
-
1992-03-11soldstatus $100,000
-
1988-10-10soldstatus $81,000
ⓘ Source: listings_history table (triggers on properties + properties_extension) + one-shot
backfill from property_details.listing_events for pre-trigger history.
Tax reassessment forecast CA · Resets to sale price
- Current annual tax
- $1,875 · $156/mo
- Projected year-2 tax
- $2,850 · $238/mo
- Expected delta
- +$975/yr (+$81/mo · 52.0%)
ⓘ Screening estimate from a state-policy table — verify with the county assessor before closing.
Climate risk First Street
- Flood 1/10 Low FEMA zone A · 0% chance over 30 yrs
- Wildfire 3/10 Moderate
- Heat 8/10 Severe 7 d/yr ≥101°F today · 19 d/yr by 30 yrs out
- Wind 1/10 Low
- Air quality 6/10 Major 10 unhealthy d/yr today · 13 by 30 yrs out
Nearby sold comps map
Loading sold comps map…
Walkable amenities ~0.75 mi
Loading nearby amenities…
Taxation est. · year 1
- Rental income
- $57,600
- − Mortgage interest
- −$21,006
- − Property taxes
- −$1,875
- − Insurance
- −$3,378
- − Repairs & maintenance
- −$4,608
- − Management
- −$4,608
- − Depreciation
- −$10,909
- Taxable income
- $11,217
- Est. tax owed @ 24.0%
- −$2,692
- After-tax cash flow
- $13,961/yr
For passive investors: Depreciation is non-cash, so a rental often shows a tax loss while cash-flowing — sheltering income. Rental losses are passive: they offset passive income freely, and up to $25,000/yr can offset ordinary (W-2) income if you actively participate and your MAGI is under $100k (phasing out to $0 by $150k); unused losses carry forward. On sale, claimed depreciation is recaptured at up to 25%, and gains may owe capital-gains tax (a 1031 exchange can defer both). Figures are a year-1 estimate at your 24.0% rate — not tax advice; consult a CPA.
Schools (NCES district)
- District
- Muroc Joint Unified
- NCES district ID
- 0626490
- Math proficiency
- 22% ▼ -13.00%
- Reading proficiency
- 39% ▼ -9.00%
- Median HH income
- $47,457
- Composite
- 26.31/100
- National rank
- #7241
- State rank
- #340 of 517 in CA
Livability — North Edwards
- Score
- 53/100
- State rank
- #930
- US rank
- #24267
Category grades
Schools grade is shown separately in the Schools card above.
Census & demographics
- Census place
- North Edwards, CA
- Population (ZIP)
- 3,681
Population outlook (Kern County) Hauer SSP2
- Today (2025)
- 947,286 people
- By 2030
- 978,984 · +3.3%
- By 2040
- 1,045,018 · +10.3%
- By 2050
- 1,105,232 · +16.7%
- By 2075
- 1,229,538 · +29.8%
- By 2100
- 1,238,059 · +30.7%
Race, ethnicity, and origin ACS 2023
- Neighborhood character
- Diverse neighborhood (Simpson 0.67)
- Race & ethnicity
- White 54% Two or more races 22% Hispanic / Latino 13% Black 12% Asian 3% Native American 1%
- Hispanic origin (detail)
- Mexican 4% Puerto Rican 2%
- Common ancestry
- Italian 6% Lithuanian 3% Iranian 2%
- Foreign-born
- 5% · Canada
- Languages at home
- 92% English-only · Spanish 4% Other Asian/Pacific 1% Tagalog/Filipino 1%
Political lean MEDSL · Kern
- 2024 margin
- Strong R (+21.1) · D 38.2% · R 59.3% · Other 2.5%
- 2008→2024 swing
- -3.3pp toward R · 2008: -17.8pp · 2024: -21.1pp
- All cycles
- 2024: R+21.1 2020: R+10.2 2016: R+15.0 2012: R+20.9 2008: R+17.8
Not yet ingested
- Civics
- —
Market trends
- HPI YoY
- ▼ -0.68%
- Current HPI
- 354.8553
- Rent YoY
- —
- Metro
- —
- State GDP YoY
- ▲ 3.21%
- F500 in state
- 116
Industry mix (Fortune 500 HQ in CA)
| Industry | F500 HQs | Revenue |
|---|---|---|
| Technology | 27 | $1,492B |
|
||
| Financial Services | 3 | $174B |
|
||
| Retail | 3 | $44B |
|
||
| Insurance | 3 | $26B |
|
||
| Media / Entertainment | 2 | $115B |
|
||
| Pharmaceuticals / Biotech | 2 | $62B |
|
||
Price history
+363.0% since first listed19 events — show timeline
- 2026-05-04 Listed $375,000 CRMLS
- 2026-04-30 Listed $375,000 AVMLS
- 2024-10-30 Listing Removed — CRMLS
- 2024-09-16 Relisted — CRMLS
- 2024-09-04 Pending — CRMLS
- 2024-05-03 Listed $355,000 CRMLS
- 2024-02-29 Listing Removed — CRMLS
- 2023-09-27 Price Changed $355,000 AVMLS
- 2023-09-27 Price Changed $355,000 CRMLS
- 2023-09-19 Listed $360,000 CRMLS
- 2023-07-24 Listed — TheMLS
- 2020-09-01 Sold (Public Records) $90,000 Public Records
- 2019-09-01 Listing Removed — AVMLS
- 2019-02-24 Listed $169,000 AVMLS
- 2015-03-19 Listing Removed — AVMLS
- 2003-12-02 Sold (Public Records) $87,500 Public Records
- 2003-10-16 Listed $87,500 AVMLS
- 1992-03-11 Sold (Public Records) $100,000 Public Records
- 1988-10-10 Sold (Public Records) $81,000 Public Records
Property tax history
+5.6%/yrLatest (2025): $1,875 · +0.2% YoY. Source: county tax records.
Cash-flow waterfall
monthlySold comps — $/sqft
last 12 mo · ≤1 miLoading sold comps…