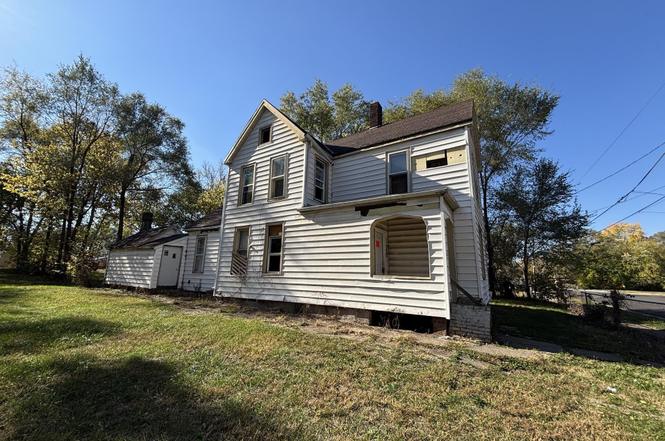
1014 W Hurlburt St · Peoria, IL
Flood risk 1/10 · Minimal
- FEMA flood zone
- X
- Chance of flooding over 30 yrs
- 0.0%
- Est. flood insurance / yr
- $473 – $860
Fire risk 1/10 · Minimal
- Est. fire insurance / yr
- $804 – $1,492
Heat risk 3/10 · Minor
- Hot days now (above 105°F)
- 7 days/yr
- Hot days in 30 yrs
- 18 days/yr
Wind risk 2/10 · Minimal
- Chance of severe wind over 30 yrs
- 1.0%
Air-quality risk 3/10 · Minor
- Unhealthy air days now
- 1 days/yr
- Unhealthy air days in 30 yrs
- 3 days/yr
Risk factors via First Street. Map © Google.
Why this score? — see what drove the D+ grade
The composite is a weighted blend of 9 inputs, each scored 0–100. Each bar is that input's sub-score; the figure is the points it added to the 100-point composite (weight × sub-score).
- Cash flow +15.0/30.0
- ARV discount +7.5/15.0
- Appreciation +5.3/10.0
- 1% rule +5.0/10.0
- DSCR +5.0/10.0
- Livability +3.7/5.0
- Rent growth +2.5/5.0
- Condition / age +2.5/5.0
- Schools +1.1/10.0
$20,000
🖨 Deal sheet 📄 Offer letter ✓ Due diligence
Listing remarks
1014 W Hurlburt St, Peoria, IL 61605 Spacious 4-bedroom, 2-bath property offering strong potential for both homeowners and investors. 1552 square feet + basement + . 17 acres! The home features a generous living space and is in need of some TLC, making it an excellent value-add opportunity. Situated on a lot with a deep backyard and an additional side lot, the property also includes alley access with a driveway for convenient off-street parking. The basement is large and well-suited for additional storage. Electricity is currently on and functioning. With new construction and redevelopment taking place in the surrounding area, this property presents a great opportunity to purchase at a ve
Key facts
- Additional side lot
- Alley access
- Strong potential
Tags
Neighborhood map
What this means for you Summary
Snapshot
- This is a 3-bed/1.5-bath single-family listed at $20k.
Deal economics
- At list price, monthly cash flow is $901 ($11k/yr) — positive.
- The deal already cash-flows at list — no discount required.
- Meets the 1% rule at list price ($1k rent vs $20k).
- Recommended offer: $19k (6.0% below list) — sets the bar for market timing.
- Cap rate 60.3% vs local median 5.6% in Peoria — top-decile yield for the area; either an underpriced asset or a hidden risk that comps aren't pricing in. Stress-test before assuming the spread holds.
Location & tenants
- Location reads 73/100 on livability (#270 in IL) — a middle-class / working-renter tenant base. Strengths: commute A+, cost of living A+, housing A+; Watch: employment D+, crime F.
- Peoria SD 150 (urban): math 11% / reading 14% proficiency, ranked #554 of 620 in IL (top 89%) — low school quality limits family demand, transient renter base, plan for 1-2y turnover; 70% free/reduced lunch — lower-income household profile, screen leases tightly.
- Zoned schools: Manual High School (math 2% / reading 2%, grade F, #659 of 693 statewide, top 100%, 656 students, 0% FRL) — zoned schools average 0% FRL vs 70% district-wide (70 pts lower); this property's tenant base skews higher-income than the district average.
- Market conditions: 42 active listings in the ZIP; 20 comparable units currently listed for rent nearby; rentals lingering (median 44d on market — plan ~5-8 weeks vacancy on turnover, expect pricing pressure); 50% of comp listings sitting > 30 days — soft ceiling on asking rent; lower-income renter base — watch delinquency; 73 units permitted in Peoria County in 2024 (0 in 5+ unit buildings).
- At $1,356/mo this rent would consume 62% of the median local household income ($26k/yr) (locally 1385% of renters already pay >50% of income on rent) — very limited rent-growth headroom before tenants either downsize or default.
Forward outlook
- In year one you build about $265 of equity ($138 loan paydown + $127 appreciation (0.6% local appreciation)).
- Peoria County population projected at -11% by 2050 — secular population decline; favor cash flow + early exit over multi-decade hold.
- At projected returns (0.6% appreciation + 3.0% rent growth), your $6k cash investment doubles in ~1 year — after that, you're playing with house money.
Negotiation context
- It's been on market 73 days — a 6% lower offer ($19k) is reasonable based on typical stale-listing flexibility.
- Current owner paid $16k; 25% above their basis — modest negotiation headroom, anchor on the comps not their cost.
Risks & watch-outs
- Watch-outs: property tax is 3.5% of price; built in 1900 — expect roof / HVAC / electrical / plumbing capex.
Questions for the listing agent
- It's been on market 73 days. Have you received any prior offers? Is the seller open to a 6% concession, seller financing, or rate buy-down credit?
- Built in 1900 — when were the roof, HVAC, electrical panel, plumbing, and water heater last replaced?
- Property tax is high relative to price — has the assessment been appealed recently, and will the sale trigger a re-assessment?
- Why hasn't it sold? Are there any deal-killer items the seller is aware of (foundation, flood, title, zoning, code violations)?
- Is there a deadline driving the sale (1031 exchange, divorce, estate, relocation)? That informs how much negotiation room exists.
- Schools are F-rated, which usually means shorter tenancies and higher turnover. Who's the typical renter profile here, and what's been the actual vacancy rate?
- Crime grade is F in this area — have there been break-ins, vandalism, or insurance claims at this property in the last 3 years? What carrier currently insures it and at what premium?
- The area grade is low — what's the realistic commute time and amenity access for the typical tenant pool here? Any planned neighborhood developments (good or bad) we should know about?
- What's the average days-on-market for RENTAL listings here right now (not sales)? A rising rental-DOM trend means longer vacancies and softer asking-rent achievability than the comps imply.
- What's the recent tenant-quality profile in this submarket — average credit score on applications, eviction rate, late-payment / NSF rate, and stable-employment percentage? A property-management company in the area should have these aggregated.
- How much new for-sale + rental construction is in the pipeline within 1–3 miles? Heavy new supply typically softens prices + rents 12–24 months out; constrained supply supports both.
Investment metrics
- 1% rule
- 6.78% ✓
- Cap rate
- 60.33%
- Cash-on-cash
- 192.99%
- DSCR
- 9.59
- GRM
- 1.2
CMA / ARV
- ARV (on-the-fly)
- $80,704
- Comps found
- 12
Show comp detail 12 sales within ~0.75 mi
| Address | Dist | Beds/Ba | Sqft | Sold | Price | $/sf | Match |
|---|---|---|---|---|---|---|---|
| 1302 W Butler St | 0.33mi | 3/1.5 | 1,596 (+3%) | 8mo | $27,000 | $17 | 73 |
| 1009 W Smith St | 0.05mi | 2/1.0 (-1) | 1,408 (-9%) | 12mo | $48,500 | $34 | 65 |
| 1214 W Butler St | 0.32mi | 3/1.0 | 1,440 (-7%) | 7mo | $22,500 | $16 | 65 |
| 201 N Charlton St | 0.18mi | 3/1.5 | 1,706 (+10%) | 18mo | $90,000 | $53 | 60 |
| 1802 Butler St | 0.62mi | 3/1.0 | 1,611 (+4%) | 6mo | $17,000 | $11 | 57 |
| 1812 W Sherman Ave | 0.67mi | 3/2.0 | 1,584 (+2%) | 10mo | $110,500 | $70 | 55 |
| 900 S Warren St | 0.73mi | 2/2.0 (-1) | 1,552 (0%) | 6mo | $53,000 | $34 | 54 |
| 1713 W Barker Ave | 0.73mi | 3/2.0 | 1,452 (-6%) | 1mo | $75,000 | $52 | 53 |
| 725 W Spring Hollow Ln | 0.54mi | 3/2.0 | 1,714 (+10%) | 4mo | $169,500 | $99 | 52 |
| 1705 W Sherman Ave | 0.60mi | 3/2.0 | 1,520 (-2%) | 22mo | $162,000 | $107 | 48 |
| 1816 W Callender Ave | 0.73mi | 3/2.0 | 1,628 (+5%) | 11mo | $80,000 | $49 | 47 |
| 404 N Glenwood Ave | 0.53mi | 3/1.0 | 1,448 (-7%) | 24mo | $113,000 | $78 | 42 |
Match score weights: distance 35% · size 25% · config 20% · recency 20%. Top-matched comps best support the ARV.
Projected returns pro-forma
0.63% appreciation · 3.0% rent growth · sell at horizon
- IRR
- —
- Equity multiple
- 11.25×
- Total profit
- $57,420
- Equity at exit
- $6,448
- IRR
- —
- Equity multiple
- 23.74×
- Total profit
- $127,352
- Equity at exit
- $8,283
Cash invested: $5,600 (down + closing). Projections, not guarantees.
Landlord ↔ Tenant lean methodology
- Overall (STATE)
- 43 Moderately Tenant-Leaning
- State Illinois
- 43 Moderately Tenant-Leaning · D+7
- County
- — inherits STATE
- City
- — inherits STATE
ZIP-level market 61605
- Home prices YoY
- 0.4%
- Active inventory
- 42
- Price-to-rent
- 1.2×
Monthly cashflow live
- Estimated rent
- $1,356 high interval (Pro) →
- Mortgage (P&I)
- −$105
- Tax from tax record
- −$58 /mo · $693/yr
- Insurance
- −$8
- HOA
- −$0
- Vacancy / Maint / Mgmt
- −$285
- Net cashflow
- $901
Break-even live
UW: 25.0% down · 7.5% · 30yr · 1.5% tax · 5.0% vac · 8.0% maint · 8.0% mgmt
Financing live
Cash to close
- Down payment
- $5,000
- Closing costs
- $600
- Reserves months
- —
- Total cash needed
- —
Loan-product check · same deal, 3 products live
Conventional
25% down · 7.5% · 30yr
- Down + closing
- —
- Monthly P&I
- —
- Monthly cashflow
- —
- DSCR
- —
- Eligible?
- —
Personal DTI + credit; lowest rate.
DSCR
20% down · 8.5% · 30yr
- Down + closing
- —
- Monthly P&I
- —
- Monthly cashflow
- —
- DSCR
- —
- Eligible?
- —
No personal income docs; deal must DSCR.
Hard money
10% down · 12.0% · 12mo
- Down + closing
- —
- Monthly P&I
- —
- Monthly cashflow
- —
- DSCR
- —
- Eligible?
- —
Short-term bridge; refi at stabilization.
Rent comps 20 comps
| Address | Beds | Baths | Sqft | Rent | $/sqft | DOM | Units | Dist |
|---|---|---|---|---|---|---|---|---|
| 1401 W Adrian G Hinton Ave Peoria, IL | 2.0 | 1.0 | 1100 | $775 | $0.70 | 43d | 1 | 0.27mi |
| 1214 W Butler St Peoria, IL | 4.0 | 1.0 | 1440 | $795 | $0.55 | 43d | 1 | 0.33mi |
| 214 Pecan St Peoria, IL | 2.0 | 1.0 | 1050 | $1,595 | $1.52 | 13d | 1 | 0.52mi |
| 818 W Moss Ave Peoria, IL | 2.0 | 2.0 | 1580 | $1,800 | $1.14 | 13d | 1 | 0.61mi |
| 1816 W Callender Ave Peoria, IL | 3.0 | 2.0 | 1628 | $1,650 | $1.01 | 43d | 1 | 0.74mi |
| 945 S Shelley St Peoria, IL | 1.0–3.0 | 1.0–2.0 | 929 | $1,025 | $1.10 | 13d | 1 | 0.77mi |
| 1723 W Fredonia Ave Peoria, IL | 4.0 | 2.5 | 1219 | $2,100 | $1.72 | 13d | 1 | 0.79mi |
| 102 N Cedar Ave West Peoria, IL | 4.0 | 1.0 | 1272 | $995 | $0.78 | 43d | 1 | 0.80mi |
| 928 S Matthew St Peoria, IL | 2.0 | 1.0 | 1080 | $748 | $0.69 | 13d | 1 | 0.84mi |
| 100 Walnut St Unit 402 Peoria, IL | 3.0 | 2.0 | 1464 | $2,400 | $1.64 | 21d | 1 | 0.86mi |
| 100 Walnut St Peoria, IL | 2.0 | 2.0 | 1102 | $2,000 | $1.81 | 13d | 1 | 0.86mi |
| 416 W Main St Unit A Peoria, IL | 2.0 | 1.0 | 1050 | $950 | $0.90 | 43d | 1 | 0.95mi |
| 123 SW Jefferson Ave Unit E16 NE Peoria, IL | 2.0 | 2.0 | 1199 | $2,250 | $1.88 | 21d | 1 | 1.00mi |
| 123 SW Jefferson Ave Unit E15SW Peoria, IL | 2.0 | 2.0 | 1100 | $1,750 | $1.59 | 13d | 1 | 1.00mi |
| 1019 N Farmington Rd Unit 1017 Peoria, IL | 3.0 | 1.0 | 1304 | $1,600 | $1.23 | 43d | 1 | 1.05mi |
| 501 W Columbia Ter Unit 3 Peoria, IL | 3.0 | 1.0 | 1500 | $1,400 | $0.93 | 43d | 1 | 1.17mi |
| 2320 W Garden St Peoria, IL | 2.0 | 1.0 | 1096 | $1,000 | $0.91 | 43d | 1 | 1.35mi |
| 2807 W Howett St Peoria, IL | 3.0 | 2.0 | 1388 | $1,550 | $1.12 | 43d | 1 | 1.36mi |
| 2847 W Howett St Peoria, IL | 3.0 | 2.0 | 2000 | $1,150 | $0.57 | 43d | 1 | 1.36mi |
| 2601 W Kenwood Ave West Peoria, IL | 3.0 | 1.5 | 1405 | $1,500 | $1.07 | 13d | 1 | 1.42mi |
Listing history 17 events
-
2026-06-19days on market $20,000 Active 73 DOM
-
2026-06-18days on market $20,000 Active 72 DOM
-
2026-06-17days on market $20,000 Active 71 DOM
-
2026-06-16days on market $20,000 Active 70 DOM
-
2026-06-15days on market $20,000 Active 69 DOM
-
2026-06-14days on market $20,000 Active 67 DOM
-
2026-06-13days on market $20,000 Active 66 DOM
-
2026-06-10days on market $20,000 Active 64 DOM
-
2026-06-09days on market $20,000 Active 63 DOM
-
2026-06-08days on market $20,000 Active 62 DOM
-
2026-06-07statusdays on market $20,000 Active 61 DOM
-
2026-03-28status Pending
-
2026-01-30$20,000 Active
-
2022-03-31historical
-
2021-08-06historical
-
2021-08-06historical
-
2018-10-05soldstatus $16,000
ⓘ Source: listings_history table (triggers on properties + properties_extension) + one-shot
backfill from property_details.listing_events for pre-trigger history.
Tax reassessment forecast IL · Partial reset (capped growth)
- Current annual tax
- $693 · $58/mo
- Projected year-2 tax
- $693 · $58/mo
- Expected delta
- $0/yr ($0/mo · 0.0%)
ⓘ Screening estimate from a state-policy table — verify with the county assessor before closing.
Climate risk First Street
- Flood 1/10 Low FEMA zone X · 0% chance over 30 yrs
- Wildfire 1/10 Low
- Heat 3/10 Moderate 7 d/yr ≥105°F today · 18 d/yr by 30 yrs out
- Wind 2/10 Low 100% chance of damaging wind over 30 yrs
- Air quality 3/10 Moderate 1 unhealthy d/yr today · 3 by 30 yrs out
Nearby sold comps map
Loading sold comps map…
Walkable amenities ~0.75 mi
Loading nearby amenities…
Taxation est. · year 1
- Rental income
- $16,277
- − Mortgage interest
- −$1,120
- − Property taxes
- −$693
- − Insurance
- −$100
- − Repairs & maintenance
- −$1,302
- − Management
- −$1,302
- − Depreciation
- −$582
- Taxable income
- $11,178
- Est. tax owed @ 24.0%
- −$2,683
- After-tax cash flow
- $8,125/yr
For passive investors: Depreciation is non-cash, so a rental often shows a tax loss while cash-flowing — sheltering income. Rental losses are passive: they offset passive income freely, and up to $25,000/yr can offset ordinary (W-2) income if you actively participate and your MAGI is under $100k (phasing out to $0 by $150k); unused losses carry forward. On sale, claimed depreciation is recaptured at up to 25%, and gains may owe capital-gains tax (a 1031 exchange can defer both). Figures are a year-1 estimate at your 24.0% rate — not tax advice; consult a CPA.
Schools (NCES district)
- District
- Peoria SD 150
- NCES district ID
- 1731230
- Math proficiency
- 11% ▼ -5.00%
- Reading proficiency
- 14% ▼ -4.00%
- Median HH income
- $41,951
- Composite
- 10.92/100
- National rank
- #9751
- State rank
- #554 of 620 in IL
Livability — Peoria
- Score
- 73/100
- State rank
- #270
- US rank
- #5096
Category grades
Schools grade is shown separately in the Schools card above.
Census & demographics
- Census place
- Peoria, IL
- County
- Peoria County · 120,495 people
- City population
- 114,670
- Metro
- Peoria, IL
- Population (ZIP)
- 13,424
- Household income
- $26,392
- Rent vs Own
- Severe rent burden
- 1385.0
Population outlook (Peoria County) Hauer SSP2
- Today (2025)
- 183,007 people
- By 2030
- 179,643 · -1.8%
- By 2040
- 171,782 · -6.1%
- By 2050
- 163,508 · -10.7%
- By 2075
- 140,178 · -23.4%
- By 2100
- 114,493 · -37.4%
Race, ethnicity, and origin ACS 2023
- Neighborhood character
- Diverse neighborhood (Simpson 0.61)
- Race & ethnicity
- Black 56% White 27% Hispanic / Latino 12% Two or more races 7% Native American 1%
- Hispanic origin (detail)
- Mexican 8%
- Common ancestry
- Lithuanian 1% Iranian 1% Portuguese 1%
- Foreign-born
- 4% · Canada, Vietnam
- Languages at home
- 92% English-only · Spanish 7%
Political lean MEDSL · Peoria
- 2024 margin
- Toss-up / Even · D 51.5% · R 46.9% · Other 1.6%
- 2008→2024 swing
- -9.2pp toward R · 2008: 13.9pp · 2024: 4.7pp
- All cycles
- 2024: D+4.7 2020: D+6.3 2016: D+2.8 2012: D+4.4 2008: D+13.9
Not yet ingested
- Civics
- —
Market trends
- HPI YoY
- ▲ 0.63%
- Current HPI
- 170.5814
- Rent YoY
- —
- Metro
- Peoria, IL
- State GDP YoY
- ▲ 1.59%
- F500 in state
- 60
Industry mix (Fortune 500 HQ in IL)
| Industry | F500 HQs | Revenue |
|---|---|---|
| Insurance | 4 | $201B |
|
||
| Consumer Goods | 4 | $87B |
|
||
| Industrial Machinery | 3 | $64B |
|
||
| Healthcare | 2 | $55B |
|
||
| Retail / Pharmacy | 1 | $148B |
|
||
| Agriculture / Food | 1 | $86B |
|
||
Price history
+25.0% since first listed6 events — show timeline
- 2026-03-28 Pending — RMLSA as Distributed by MLS Grid
- 2026-01-30 Listed $20,000 RMLSA as Distributed by MLS Grid
- 2022-03-31 Listing Removed — RMLSA as Distributed by MLS Grid
- 2021-08-06 Listing Removed — RMLSA as Distributed by MLS Grid
- 2021-08-06 Listing Removed — RMLSA as Distributed by MLS Grid
- 2018-10-05 Sold (Public Records) $16,000 Public Records
Property tax history
+1.4%/yrLatest (2024): $693 · +4.8% YoY. Source: county tax records.
Cash-flow waterfall
monthlySold comps — $/sqft
last 12 mo · ≤1 miLoading sold comps…