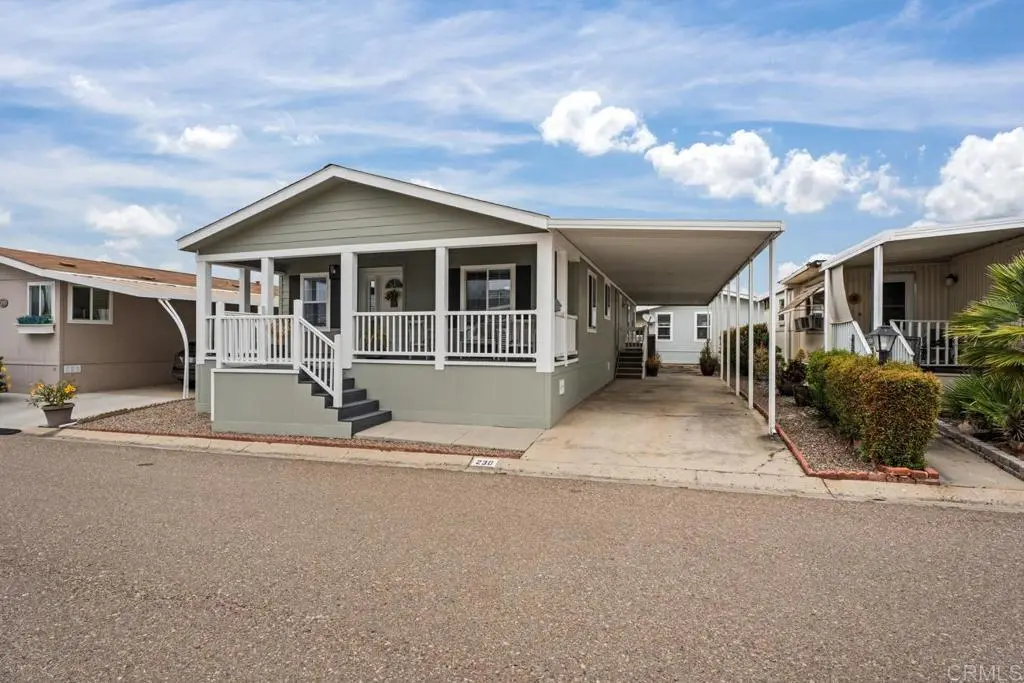
10770 Black Mountain Rd #230 · San Diego, CA
Flood risk 1/10 · Minimal
- FEMA flood zone
- X (unshaded)
- Chance of flooding over 30 yrs
- 0.0%
- Est. flood insurance / yr
- $507 – $1,088
Fire risk 1/10 · Minimal
- Est. fire insurance / yr
- $659 – $1,223
Heat risk 4/10 · Minor
- Hot days now (above 93°F)
- 7 days/yr
- Hot days in 30 yrs
- 20 days/yr
Wind risk 1/10 · Minimal
- Chance of severe wind over 30 yrs
- —
Air-quality risk 3/10 · Minor
- Unhealthy air days now
- 3 days/yr
- Unhealthy air days in 30 yrs
- 4 days/yr
Risk factors via First Street. Map © Google.
Why this score? — see what drove the D+ grade
The composite is a weighted blend of 9 inputs, each scored 0–100. Each bar is that input's sub-score; the figure is the points it added to the 100-point composite (weight × sub-score).
- Cash flow +20.3/30.0
- ARV discount +6.9/15.0
- DSCR +6.5/10.0
- 1% rule +4.4/10.0
- Livability +3.8/5.0
- Rent growth +2.8/5.0
- Condition / age +2.5/5.0
- Schools +2.2/10.0
- Appreciation +0.0/10.0
$375,000
🖨 Deal sheet 📄 Offer letter ✓ Due diligence
Listing remarks
Beautifully maintained and move-in ready manufactured home in a quiet, well-maintained 55+ community. This home offers 2 bedrooms, 2 full baths, and an optional 3rd bedroom or office. High ceilings, an open-concept layout, and abundant natural light create a bright and inviting living space. The spacious primary bathroom features dual vanities and a jacuzzi tub. Lightly used over the past 20 years, this well-preserved home reflects true pride of ownership. Community amenities include a pool, billiard room, clubhouse for gatherings and parties, classes, and more. Rent in includes water, sewer, and trash.
Key facts
- Dual vanities
- Community amenities
- Pool
Tags
Property features AI
Finance
- Other: Assessments: Buyer to verify
- Financial info: Land lease: $1,252 (land lease applies)
- HOA & community: Senior community; Community features include golf course, hiking, mountainous/foothills terrain, riding/stables, valley, and park access; Suburban neighborhood
Exterior
- Parking: 2 total parking spaces; 2 carport spaces
- Utilities: Public sewer; Trash included (rent); Water included (rent); Sewer included (rent)
- Home design: Single-story property; Mobile home remains on site; Located in The Woods park; Park-facing/suburban setting; Directions: From 15 freeway exit Mira Mesa Blvd west, left on Black Mountain Rd
- Construction: 1 shed on property
- Exterior features: Community pool; Landscaped grounds; Pasture area nearby; Park nearby; Garden; Front yard; Lawn; Street lighting; Sidewalks; Storm drains; Curbs
Interior
- Bathrooms: 2 full bathrooms
- Heating & cooling: Has cooling (details in remarks)
- Interior features: Single-level home; Front and side entry; Family room
- Laundry & utility: Washer hookup; Gas dryer hookup; Has laundry
Neighborhood map
What this means for you Summary
Snapshot
- This is a 2-bed/2.0-bath manufactured listed at $375k.
Deal economics
- At list price, monthly cash flow is $484 ($6k/yr) — positive.
- The deal already cash-flows at list — no discount required.
- To meet the 1% rule (rent ≥ 1% of price), the offer needs to be $351k (6.5% below list).
- Recommended offer: $351k (6.5% below list) — sets the bar for 1% rule.
- Cap rate 7.8% vs local median 2.0% in San Diego — top-decile yield for the area; either an underpriced asset or a hidden risk that comps aren't pricing in. Stress-test before assuming the spread holds.
Location & tenants
- Location reads 75/100 on livability (#123 in CA, #4,206 nationally) — a middle-class / working-renter tenant base. Strengths: amenities A+, commute A+, employment A+; Watch: health & safety C-, crime D+, cost of living F.
- San Diego Unified (urban): math 19% / reading 29% proficiency, ranked #393 of 517 in CA (top 76%) — low school quality limits family demand, transient renter base, plan for 1-2y turnover.
- Market conditions: Rents rising (+1.0%/yr); 156 active listings in the ZIP; 17 comparable units currently listed for rent nearby; rentals at typical pace (median 20d on market — plan ~3-4 weeks tenant-placement turnaround); high-income renter base; 11,759 units permitted in San Diego County in 2024 (7,244 in 5+ unit buildings).
- This rent runs 33% of the median local income ($127k/yr) — at the standard rent-burdened threshold; future hikes will face affordability resistance.
Forward outlook
- Local home prices are declining (-3.0%/yr); year-one equity from $3k of loan paydown is wiped out by about $11k of value loss. Plan a longer hold.
- San Diego County population projected at +20% by 2050 — long-run rental-demand tailwind backs the buy-and-hold thesis.
Negotiation context
- It's been on market 77 days — a 6% lower offer ($352k) is reasonable based on typical stale-listing flexibility.
Questions for the listing agent
- It's been on market 77 days. Have you received any prior offers? Is the seller open to a 6% concession, seller financing, or rate buy-down credit?
- Why hasn't it sold? Are there any deal-killer items the seller is aware of (foundation, flood, title, zoning, code violations)?
- Is there a deadline driving the sale (1031 exchange, divorce, estate, relocation)? That informs how much negotiation room exists.
- Schools are B-rated — typically a magnet for longer-tenancy family renters. What's the average tenant stay here, and is there a school-zone premium baked into asking?
- Crime grade is D in this area — have there been break-ins, vandalism, or insurance claims at this property in the last 3 years? What carrier currently insures it and at what premium?
- The area grade is low — what's the realistic commute time and amenity access for the typical tenant pool here? Any planned neighborhood developments (good or bad) we should know about?
- What's the average days-on-market for RENTAL listings here right now (not sales)? A rising rental-DOM trend means longer vacancies and softer asking-rent achievability than the comps imply.
- What's the recent tenant-quality profile in this submarket — average credit score on applications, eviction rate, late-payment / NSF rate, and stable-employment percentage? A property-management company in the area should have these aggregated.
- How much new for-sale + rental construction is in the pipeline within 1–3 miles? Heavy new supply typically softens prices + rents 12–24 months out; constrained supply supports both.
Investment metrics
- 1% rule
- 0.94% ✗
- Cap rate
- 7.84%
- Cash-on-cash
- 5.53%
- DSCR
- 1.25
- GRM
- 8.9
CMA / ARV
- ARV (on-the-fly)
- $369,720
- Comps found
- 7
Show comp detail 7 sales within ~0.75 mi
| Address | Dist | Beds/Ba | Sqft | Sold | Price | $/sf | Match |
|---|---|---|---|---|---|---|---|
| 10771 Black Mountain Dr #58 | 0.06mi | 2/2.0 | 1,440 (-9%) | 6mo | $390,000 | $271 | 77 |
| 10770 Black Mountain Rd Spc 179 | 0.06mi | 3/2.0 (+1) | 1,535 (-3%) | 14mo | $408,000 | $266 | 76 |
| 10771 Black Mountain Rd #43 | 0.06mi | 2/2.0 | 1,368 (-13%) | 13mo | $320,000 | $234 | 64 |
| 10771 Black Mountain Rd #122 | 0.06mi | 2/2.0 | 1,392 (-12%) | 16mo | $256,000 | $184 | 64 |
| 10770 Black Mountain Rd #141 | 0.06mi | 2/2.0 | 1,368 (-13%) | 15mo | $165,000 | $121 | 63 |
| 10771 Black Mountain Rd #15 | 0.06mi | 2/1.5 | 1,392 (-12%) | 19mo | $150,000 | $108 | 59 |
| 10770 Black Mountain Rd #200 | 0.08mi | 3/2.0 (+1) | 1,344 (-15%) | 23mo | $365,000 | $272 | 47 |
Match score weights: distance 35% · size 25% · config 20% · recency 20%. Top-matched comps best support the ARV.
Projected returns pro-forma
-3.0% appreciation · 1.03% rent growth · sell at horizon
- IRR
- -9.8%
- Equity multiple
- 0.65×
- Total profit
- $-36,908
- Equity at exit
- $55,914
- IRR
- -3.1%
- Equity multiple
- 0.81×
- Total profit
- $-19,901
- Equity at exit
- $32,423
Cash invested: $105,000 (down + closing). Projections, not guarantees.
Landlord ↔ Tenant lean methodology
- Overall (STATE)
- 18 Strongly Tenant-Friendly
- State California
- 18 Strongly Tenant-Friendly · D+13
- County
- — inherits STATE
- City
- — inherits STATE
ZIP-level market 92126
- Rents YoY
- 1.0%
- Active inventory
- 156
- Price-to-rent
- 8.9×
Monthly cashflow live
- Estimated rent
- $3,506 high interval (Pro) →
- Mortgage (P&I)
- −$1,967
- Tax from tax record
- −$164 /mo · $1,963/yr
- Insurance
- −$156
- HOA
- −$0
- Vacancy / Maint / Mgmt
- −$736
- Net cashflow
- $484
Break-even live
UW: 25.0% down · 7.5% · 30yr · 1.5% tax · 5.0% vac · 8.0% maint · 8.0% mgmt
Financing live
Cash to close
- Down payment
- $93,750
- Closing costs
- $11,250
- Reserves months
- —
- Total cash needed
- —
Loan-product check · same deal, 3 products live
Conventional
25% down · 7.5% · 30yr
- Down + closing
- —
- Monthly P&I
- —
- Monthly cashflow
- —
- DSCR
- —
- Eligible?
- —
Personal DTI + credit; lowest rate.
DSCR
20% down · 8.5% · 30yr
- Down + closing
- —
- Monthly P&I
- —
- Monthly cashflow
- —
- DSCR
- —
- Eligible?
- —
No personal income docs; deal must DSCR.
Hard money
10% down · 12.0% · 12mo
- Down + closing
- —
- Monthly P&I
- —
- Monthly cashflow
- —
- DSCR
- —
- Eligible?
- —
Short-term bridge; refi at stabilization.
Rent comps 17 comps
| Address | Beds | Baths | Sqft | Rent | $/sqft | DOM | Units | Dist |
|---|---|---|---|---|---|---|---|---|
| 9469 Karma Dr San Diego, CA | 2.0–3.0 | 1.0–2.0 | 1164 | $3,579 | $3.07 | 24d | 1 | 0.37mi |
| 9020 Penticton Way San Diego, CA | 3.0 | 2.0 | 1179 | $3,900 | $3.31 | 24d | 1 | 0.61mi |
| 9800 Mira Lee Way San Diego, CA | 1.0–3.0 | 1.0–2.0 | 1358 | $3,800 | $2.80 | 1d | 54 | 0.64mi |
| 9447 Gold Coast Dr Unit G5 San Diego, CA | 2.0 | 1.5 | 1104 | $2,695 | $2.44 | 14d | 1 | 0.69mi |
| 9405 Gold Coast Dr Unit A8 San Diego, CA | 2.0 | 1.5 | 1104 | $3,000 | $2.72 | 24d | 1 | 0.70mi |
| 10776 Scripps Ranch Blvd San Diego, CA | 1.0–2.0 | 1.0–2.0 | 1002 | $3,787 | $3.78 | 1d | 11 | 0.77mi |
| 9459 Compass Point Dr S San Diego, CA | 3.0 | 2.5 | 1594 | $4,150 | $2.60 | 14d | 1 | 0.79mi |
| 9955 Scripps Westview Way #11 San Diego, CA | 2.0 | 2.0 | 1086 | $3,600 | $3.31 | 24d | 1 | 0.82mi |
| 9975 Scripps Westview Way #27 San Diego, CA | 2.0 | 2.0 | 1195 | $3,395 | $2.84 | 5d | 1 | 0.82mi |
| 10885 Scripps Ranch Blvd San Diego, CA | 2.0 | 2.0 | 1093 | $3,350 | $3.06 | 20d | 1 | 0.96mi |
| 9929 Maya Linda Rd #7 San Diego, CA | 2.0 | 3.0 | 1335 | $4,200 | $3.15 | 24d | 1 | 0.99mi |
| 8369 Summerdale Rd Unit A San Diego, CA | 2.0 | 2.5 | 1146 | $3,245 | $2.83 | 10d | 1 | 1.02mi |
| 14158 Angelite Way San Diego, CA | 2.0 | 2.0 | 1600 | $4,500 | $2.81 | 24d | 1 | 1.07mi |
| 11760 Westview Pkwy San Diego, CA | 2.0–3.0 | 2.0 | 1120 | $3,197 | $2.85 | 2d | 9 | 1.16mi |
| 11295 Acrux Dr San Diego, CA | 3.0 | 2.0 | 1160 | $3,750 | $3.23 | 24d | 1 | 1.37mi |
| 8180 Lapiz Dr San Diego, CA | 3.0 | 2.0 | 1350 | $4,300 | $3.19 | 24d | 1 | 1.37mi |
| 9332 Babauta Rd #89 San Diego, CA | 3.0 | 2.5 | 1679 | $3,895 | $2.32 | 16d | 1 | 1.48mi |
Listing history 14 events
-
2026-06-18days on market $375,000 Active 77 DOM
-
2026-06-17days on market $375,000 Active 76 DOM
-
2026-06-16days on market $375,000 Active 75 DOM
-
2026-06-15days on market $375,000 Active 74 DOM
-
2026-06-13days on market $375,000 Active 72 DOM
-
2026-06-09days on market $375,000 Active 68 DOM
-
2026-06-08days on market $375,000 Active 67 DOM
-
2026-06-07days on market $375,000 Active 66 DOM
-
2026-06-04days on market $375,000 Active 63 DOM
-
2026-06-03days on market $375,000 Active 62 DOM
-
2026-06-02days on market $375,000 Active 61 DOM
-
2026-06-01days on market $375,000 Active 60 DOM
-
2026-05-31days on market $375,000 Active 59 DOM
-
2026-03-30$375,000 Active
ⓘ Source: listings_history table (triggers on properties + properties_extension) + one-shot
backfill from property_details.listing_events for pre-trigger history.
Tax reassessment forecast CA · Resets to sale price
- Current annual tax
- $1,963 · $164/mo
- Projected year-2 tax
- $2,850 · $238/mo
- Expected delta
- +$887/yr (+$74/mo · 45.2%)
ⓘ Screening estimate from a state-policy table — verify with the county assessor before closing.
Climate risk First Street
- Flood 1/10 Low FEMA zone X (unshaded) · 0% chance over 30 yrs
- Wildfire 1/10 Low
- Heat 4/10 Moderate 7 d/yr ≥93°F today · 20 d/yr by 30 yrs out
- Wind 1/10 Low
- Air quality 3/10 Moderate 3 unhealthy d/yr today · 4 by 30 yrs out
Nearby sold comps map
Loading sold comps map…
Walkable amenities ~0.75 mi
Loading nearby amenities…
Taxation est. · year 1
- Rental income
- $42,078
- − Mortgage interest
- −$21,006
- − Property taxes
- −$1,963
- − Insurance
- −$1,875
- − Repairs & maintenance
- −$3,366
- − Management
- −$3,366
- − Depreciation
- −$10,909
- Taxable loss
- −$408
- Est. tax savings @ 24.0%
- +$98
- After-tax cash flow
- $5,903/yr
For passive investors: Depreciation is non-cash, so a rental often shows a tax loss while cash-flowing — sheltering income. Rental losses are passive: they offset passive income freely, and up to $25,000/yr can offset ordinary (W-2) income if you actively participate and your MAGI is under $100k (phasing out to $0 by $150k); unused losses carry forward. On sale, claimed depreciation is recaptured at up to 25%, and gains may owe capital-gains tax (a 1031 exchange can defer both). Figures are a year-1 estimate at your 24.0% rate — not tax advice; consult a CPA.
Schools (NCES district)
- District
- San Diego Unified
- NCES district ID
- 0634320
- Math proficiency
- 19% ▼ -29.00%
- Reading proficiency
- 29% ▼ -28.00%
- Median HH income
- $61,673
- Composite
- 22.31/100
- National rank
- #8135
- State rank
- #393 of 517 in CA
Livability — San Diego
- Score
- 75/100
- State rank
- #123
- US rank
- #4206
Category grades
Schools grade is shown separately in the Schools card above.
Census & demographics
- Census place
- San Diego, CA
- County
- San Diego County · 3,178,799 people
- City population
- 1,397,612
- Metro
- San Diego-Chula Vista-Carlsbad, CA
- Population (ZIP)
- 76,059
- Household income
- $126,913
- Rent vs Own
- Severe rent burden
- 2688.0
Population outlook (San Diego County) Hauer SSP2
- Today (2025)
- 3,678,185 people
- By 2030
- 3,856,546 · +4.8%
- By 2040
- 4,171,407 · +13.4%
- By 2050
- 4,421,607 · +20.2%
- By 2075
- 4,831,599 · +31.4%
- By 2100
- 4,832,502 · +31.4%
Race, ethnicity, and origin ACS 2023
- Neighborhood character
- Diverse neighborhood (Simpson 0.67)
- Race & ethnicity
- Asian 49% White 24% Hispanic / Latino 16% Two or more races 11% Black 3%
- Hispanic origin (detail)
- Mexican 12%
- Common ancestry
- Italian 2% Lithuanian 1% Romanian 1%
- Foreign-born
- 41% · Vietnam, Canada, China
- Languages at home
- 49% English-only · Tagalog/Filipino 14% Spanish 9% Vietnamese 8%
Political lean MEDSL · San Diego
- 2024 margin
- D (+16.8) · D 56.9% · R 40.1% · Other 2.9%
- 2008→2024 swing
- +6.6pp toward D · 2008: 10.2pp · 2024: 16.8pp
- All cycles
- 2024: D+16.8 2020: D+22.8 2016: D+17.8 2012: D+5.1 2008: D+10.2
Not yet ingested
- Civics
- —
Market trends
- HPI YoY
- ▼ -790.06%
- Current HPI
- 452.3165
- Rent YoY
- ▲ 1.03%
- Metro
- San Diego-Chula Vista-Carlsbad, CA
- State GDP YoY
- ▲ 3.21%
- F500 in state
- 116
Industry mix (Fortune 500 HQ in CA)
| Industry | F500 HQs | Revenue |
|---|---|---|
| Technology | 27 | $1,492B |
|
||
| Financial Services | 3 | $174B |
|
||
| Retail | 3 | $44B |
|
||
| Insurance | 3 | $26B |
|
||
| Media / Entertainment | 2 | $115B |
|
||
| Pharmaceuticals / Biotech | 2 | $62B |
|
||
Price history
1 event — show timeline
- 2026-03-30 Listed $375,000 CRMLS
Property tax history
+3.1%/yrLatest (2013): $1,963 · +8.6% YoY. Source: county tax records.
Cash-flow waterfall
monthlySold comps — $/sqft
last 12 mo · ≤1 miLoading sold comps…