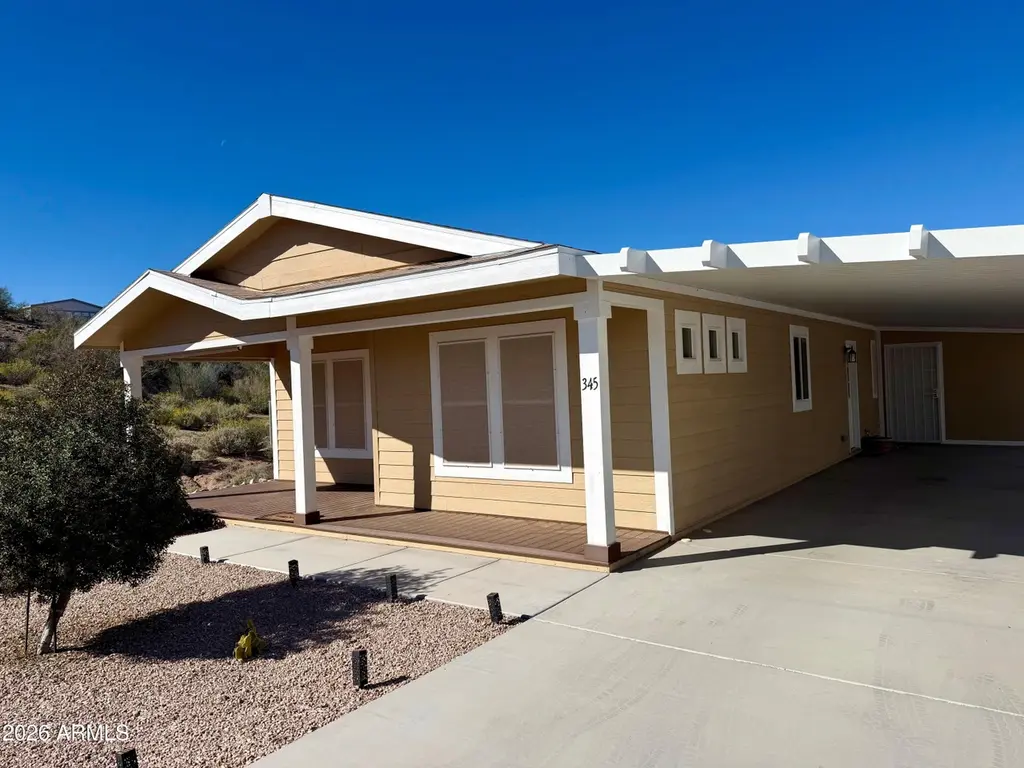
2501 W Wickenburg Way #345 · Wickenburg, AZ
Flood risk 8/10 · Major
- FEMA flood zone
- AE
- Chance of flooding over 30 yrs
- 0.99%
- Est. flood insurance / yr
- $1,737 – $8,500
Fire risk 5/10 · Moderate
- Est. fire insurance / yr
- $610 – $1,132
Heat risk 8/10 · Major
- Hot days now (above 109°F)
- 5 days/yr
- Hot days in 30 yrs
- 13 days/yr
Wind risk 1/10 · Minimal
- Chance of severe wind over 30 yrs
- —
Air-quality risk 1/10 · Minimal
- Unhealthy air days now
- 0 days/yr
- Unhealthy air days in 30 yrs
- 0 days/yr
Risk factors via First Street. Map © Google.
Why this score? — see what drove the B grade
The composite is a weighted blend of 9 inputs, each scored 0–100. Each bar is that input's sub-score; the figure is the points it added to the 100-point composite (weight × sub-score).
- Cash flow +30.0/30.0
- 1% rule +10.0/10.0
- DSCR +10.0/10.0
- ARV discount +7.5/15.0
- Condition / age +4.0/5.0
- Livability +3.5/5.0
- Schools +2.9/10.0
- Rent growth +2.5/5.0
- Appreciation +0.0/10.0
$119,000
🖨 Deal sheet 📄 Offer letter ✓ Due diligence
Listing remarks MLS
Beautiful 2020 CAVCO home in Westpark is located in a desirable cul-de-sac up against a hill with one neighbor to the north for added privacy and minimal traffic. The home features an east/west exposure, helping to keep the interior comfortable while allowing for great natural light throughout the day. The modern layout has an open kitchen and dining area, comfortable living room, laundry room, two bedrooms, and two full bathrooms for convenience and privacy. The newer 2020 construction means updated finishes and efficient systems. Enjoy sitting on the front or back porch perfect for enjoying the scenery, great weather, and entertaining. The property includes a storage shed with A/C. The cover patio has plenty of space for two vehicles.
Key facts
- Storage shed
- Covered patio
- East west exposure
Tags
Neighborhood map
What this means for you Summary
Snapshot
- This is a 2-bed/2.0-bath manufactured listed at $119k. Condition is rated good.
Deal economics
- At list price, monthly cash flow is $238 ($3k/yr) — positive.
- The deal already cash-flows at list — no discount required.
- Meets the 1% rule at list price ($2k rent vs $119k).
- Recommended offer: $108k (9.0% below list) — sets the bar for market timing.
- Cap rate 13.0% vs local median 3.0% in Wickenburg — top-decile yield for the area; either an underpriced asset or a hidden risk that comps aren't pricing in. Stress-test before assuming the spread holds.
Location & tenants
- Location reads 70/100 on livability (#41 in AZ) — a middle-class / working-renter tenant base. Strengths: crime A+, housing A+, cost of living A-; Watch: schools D+, amenities F, commute F.
- Wickenburg Unified District (4236) (rural): math 33% / reading 35% proficiency, ranked #92 of 249 in AZ (top 37%) — families likely to look elsewhere, expect single-tenant / working-renter base with shorter leases.
- Market conditions: 378 active listings in the ZIP; 3 comparable units currently listed for rent nearby; rentals at typical pace (median 24d on market — plan ~3-4 weeks tenant-placement turnaround); 36,011 units permitted in Maricopa County in 2024 (12,801 in 5+ unit buildings).
- This rent runs 33% of the median local income ($69k/yr) — at the standard rent-burdened threshold; future hikes will face affordability resistance.
Forward outlook
- Local home prices are declining (-3.0%/yr); year-one equity from $823 of loan paydown is wiped out by about $4k of value loss. Plan a longer hold.
- Maricopa County population projected at +38% by 2050 — long-run rental-demand tailwind backs the buy-and-hold thesis.
Negotiation context
- It's been on market 93 days — a 9% lower offer ($108k) is reasonable based on typical stale-listing flexibility.
Risks & watch-outs
- Watch-outs: flood insurance adds $427/mo.
- Climate carrying-cost: in FEMA flood zone AE (mandatory federal flood insurance); moderate wildfire risk; extreme-heat days projected 5→13/yr by 2055 (HVAC capex compounding) — expect insurance premiums to compound above CPI over the hold.
Questions for the listing agent
- It's been on market 93 days. Have you received any prior offers? Is the seller open to a 9% concession, seller financing, or rate buy-down credit?
- What's the actual annual flood-insurance premium (NFIP or private), and is the property in a SFHA with mandatory coverage?
- Why hasn't it sold? Are there any deal-killer items the seller is aware of (foundation, flood, title, zoning, code violations)?
- Is there a deadline driving the sale (1031 exchange, divorce, estate, relocation)? That informs how much negotiation room exists.
- Schools are D-rated, which usually means shorter tenancies and higher turnover. Who's the typical renter profile here, and what's been the actual vacancy rate?
- What's the average days-on-market for RENTAL listings here right now (not sales)? A rising rental-DOM trend means longer vacancies and softer asking-rent achievability than the comps imply.
- What's the recent tenant-quality profile in this submarket — average credit score on applications, eviction rate, late-payment / NSF rate, and stable-employment percentage? A property-management company in the area should have these aggregated.
- How much new for-sale + rental construction is in the pipeline within 1–3 miles? Heavy new supply typically softens prices + rents 12–24 months out; constrained supply supports both.
Investment metrics
- 1% rule
- 1.58% ✓
- Cap rate
- 13.00%
- Cash-on-cash
- 23.94%
- DSCR
- 2.07
- GRM
- 5.3
CMA / ARV
- ARV (median comp)
- $39,445
- List price
- $119,000
- Delta
- 201.68%
- Verdict
- OVERPRICED
- Comps
- 16 within 1.0 mi
Show comp detail 12 sales within ~0.75 mi
| Address | Dist | Beds/Ba | Sqft | Sold | Price | $/sf | Match |
|---|---|---|---|---|---|---|---|
| 2501 W Wickenburg Way #37 | 0.11mi | 2/2.0 | 1,440 (-1%) | 1mo | $15,000 | $10 | 92 |
| 2501 W Wickenburg Way #353 | 0.11mi | 2/2.0 | 1,500 (+3%) | 1mo | $100,000 | $67 | 89 |
| 2501 W Wickenburg Way #362 | 0.11mi | 2/2.0 | 1,361 (-6%) | 2mo | $99,900 | $73 | 82 |
| 2501 W Wickenburg Way #102 | 0.11mi | 2/3.0 | 1,560 (+7%) | 1mo | $15,000 | $10 | 78 |
| 2501 W Wickenburg Way #137 | 0.11mi | 2/2.0 | 1,344 (-8%) | 9mo | $27,000 | $20 | 74 |
| 2501 W Wickenburg Way #171 | 0.11mi | 2/2.0 | 1,344 (-8%) | 9mo | $70,000 | $52 | 74 |
| 2501 W Wickenburg Way #68 | 0.11mi | 3/2.0 (+1) | 1,536 (+6%) | 13mo | $55,000 | $36 | 70 |
| 2501 W Wickenburg Way #35 | 0.11mi | 2/2.0 | 1,248 (-14%) | 2mo | $14,500 | $12 | 69 |
| 2501 W Wickenburg Way #175 | 0.11mi | 3/2.0 (+1) | 1,560 (+7%) | 12mo | $79,500 | $51 | 68 |
| 2501 W Wickenburg Way #154 | 0.11mi | 2/2.0 | 1,248 (-14%) | 14mo | $14,000 | $11 | 59 |
| 725 W Smoketree Rd | 0.73mi | 2/2.0 | 1,568 (+8%) | 4mo | $210,000 | $134 | 50 |
| 685 Smoketree St | 0.72mi | 2/2.0 | 1,260 (-14%) | 13mo | $230,000 | $183 | 33 |
Match score weights: distance 35% · size 25% · config 20% · recency 20%. Top-matched comps best support the ARV.
Projected returns pro-forma
-3.0% appreciation · 3.0% rent growth · sell at horizon
- IRR
- -3.0%
- Equity multiple
- 0.89×
- Total profit
- $-3,824
- Equity at exit
- $17,743
- IRR
- 6.9%
- Equity multiple
- 1.52×
- Total profit
- $17,383
- Equity at exit
- $10,289
Cash invested: $33,320 (down + closing). Projections, not guarantees.
Landlord ↔ Tenant lean methodology
- Overall (STATE)
- 87 Strongly Landlord-Friendly
- State Arizona
- 87 Strongly Landlord-Friendly · R+3
- County
- — inherits STATE
- City
- — inherits STATE
ZIP-level market 85390
- Home prices YoY
- -17.4%
- Active inventory
- 378
- Price-to-rent
- 5.3×
Monthly cashflow live
- Estimated rent
- $1,882 medium interval (Pro) →
- Mortgage (P&I)
- −$624
- Tax est. 1.5%
- −$149 /mo · $1,785/yr
- Insurance
- −$50
- Flood insurance flood zone
- −$427 /mo · $5,118/yr
- HOA
- −$0
- Vacancy / Maint / Mgmt
- −$395
- Net cashflow
- $238
Break-even live
UW: 25.0% down · 7.5% · 30yr · 1.5% tax · 5.0% vac · 8.0% maint · 8.0% mgmt
Financing live
Cash to close
- Down payment
- $29,750
- Closing costs
- $3,570
- Reserves months
- —
- Total cash needed
- —
Loan-product check · same deal, 3 products live
Conventional
25% down · 7.5% · 30yr
- Down + closing
- —
- Monthly P&I
- —
- Monthly cashflow
- —
- DSCR
- —
- Eligible?
- —
Personal DTI + credit; lowest rate.
DSCR
20% down · 8.5% · 30yr
- Down + closing
- —
- Monthly P&I
- —
- Monthly cashflow
- —
- DSCR
- —
- Eligible?
- —
No personal income docs; deal must DSCR.
Hard money
10% down · 12.0% · 12mo
- Down + closing
- —
- Monthly P&I
- —
- Monthly cashflow
- —
- DSCR
- —
- Eligible?
- —
Short-term bridge; refi at stabilization.
Rent comps 3 comps
| Address | Beds | Baths | Sqft | Rent | $/sqft | DOM | Units | Dist |
|---|---|---|---|---|---|---|---|---|
| 2159 W Terrace Dr Wickenburg, AZ | 3.0 | 2.0 | 1304 | $2,100 | $1.61 | 43d | 1 | 0.61mi |
| 2110 W Terrace Dr Wickenburg, AZ | 3.0 | 2.0 | 1358 | $1,600 | $1.18 | 24d | 1 | 0.70mi |
| 540 S West Rd #24 Wickenburg, AZ | 3.0 | 1.0 | 894 | $2,200 | $2.46 | 24d | 1 | 0.85mi |
Listing history 15 events
-
2026-06-18days on market $119,000 Active 93 DOM
-
2026-06-17days on market $119,000 Active 92 DOM
-
2026-06-16days on market $119,000 Active 91 DOM
-
2026-06-15days on market $119,000 Active 90 DOM
-
2026-06-13days on market $119,000 Active 88 DOM
-
2026-06-13days on market $119,000 Active 87 DOM
-
2026-06-09days on market $119,000 Active 84 DOM
-
2026-06-08days on market $119,000 Active 83 DOM
-
2026-06-07days on market $119,000 Active 82 DOM
-
2026-06-04days on market $119,000 Active 79 DOM
-
2026-06-03days on market $119,000 Active 78 DOM
-
2026-06-02days on market $119,000 Active 77 DOM
-
2026-06-01days on market $119,000 Active 76 DOM
-
2026-05-31days on market $119,000 Active 75 DOM
-
2026-03-16$119,000 Active 747-char remark
Show marketing remark (747 chars)
Beautiful 2020 CAVCO home in Westpark is located in a desirable cul-de-sac up against a hill with one neighbor to the north for added privacy and minimal traffic. The home features an east/west exposure, helping to keep the interior comfortable while allowing for great natural light throughout the day. The modern layout has an open kitchen and dining area, comfortable living room, laundry room, two bedrooms, and two full bathrooms for convenience and privacy. The newer 2020 construction means updated finishes and efficient systems. Enjoy sitting on the front or back porch perfect for enjoying the scenery, great weather, and entertaining. The property includes a storage shed with A/C. The cover patio has plenty of space for two vehicles.
ⓘ Source: listings_history table (triggers on properties + properties_extension) + one-shot
backfill from property_details.listing_events for pre-trigger history.
Climate risk First Street
- Flood 8/10 Severe FEMA zone AE · 99% chance over 30 yrs
- Wildfire 5/10 Major
- Heat 8/10 Severe 5 d/yr ≥109°F today · 13 d/yr by 30 yrs out
- Wind 1/10 Low
- Air quality 1/10 Low 0 unhealthy d/yr today · 0 by 30 yrs out
Nearby sold comps map
Loading sold comps map…
Walkable amenities ~0.75 mi
Loading nearby amenities…
Taxation est. · year 1
- Rental income
- $22,589
- − Mortgage interest
- −$6,666
- − Property taxes
- −$1,785
- − Insurance
- −$5,714
- − Repairs & maintenance
- −$1,807
- − Management
- −$1,807
- − Depreciation
- −$3,462
- Taxable income
- $1,348
- Est. tax owed @ 24.0%
- −$324
- After-tax cash flow
- $2,534/yr
For passive investors: Depreciation is non-cash, so a rental often shows a tax loss while cash-flowing — sheltering income. Rental losses are passive: they offset passive income freely, and up to $25,000/yr can offset ordinary (W-2) income if you actively participate and your MAGI is under $100k (phasing out to $0 by $150k); unused losses carry forward. On sale, claimed depreciation is recaptured at up to 25%, and gains may owe capital-gains tax (a 1031 exchange can defer both). Figures are a year-1 estimate at your 24.0% rate — not tax advice; consult a CPA.
Condition & rehab AI · 12 photos
This 2020 CAVCO home in Westpark is in excellent condition with modern finishes and efficient systems. It offers a great location and potential for value-adding improvements.
Value-add opportunities
- Both Paint exterior trim and siding — Enhances curb appeal and value
- Resale Replace countertops with quartz or granite — Improves kitchen aesthetics and value
- Both Install smart home automation — Enhances convenience and marketability
Renovation cost estimate screening
Value-add ROI direction
- Both Paint exterior trim and siding — Enhances curb appeal and value ↑
- Resale Replace countertops with quartz or granite — Improves kitchen aesthetics and value ↑
- Both Install smart home automation — Enhances convenience and marketability ↑
ⓘ Cost ranges are severity-bucket heuristics (US national rule-of-thumb). Get contractor quotes + a written scope before underwriting a rehab budget.
Schools (NCES district)
- District
- Wickenburg Unified District (4236)
- NCES district ID
- 0409190
- Math proficiency
- 33% ▼ -10.00%
- Reading proficiency
- 35% ▼ -7.00%
- Median HH income
- $47,369
- Composite
- 29.27/100
- National rank
- #6560
- State rank
- #92 of 249 in AZ
Livability — Wickenburg
- Score
- 70/100
- State rank
- #41
- US rank
- #7975
Category grades
Schools grade is shown separately in the Schools card above.
Census & demographics
- Census place
- Wickenburg, AZ
- County
- Maricopa County · 4,537,380 people
- City population
- 10,298
- Metro
- Phoenix-Mesa-Chandler, AZ
- Population (ZIP)
- 10,298
- Household income
- $68,591
- Rent vs Own
- Severe rent burden
- 251.0
Population outlook (Maricopa County) Hauer SSP2
- Today (2025)
- 4,979,203 people
- By 2030
- 5,378,229 · +8.0%
- By 2040
- 6,156,598 · +23.6%
- By 2050
- 6,872,376 · +38.0%
- By 2075
- 8,401,270 · +68.7%
- By 2100
- 9,247,439 · +85.7%
Race, ethnicity, and origin ACS 2023
- Neighborhood character
- Predominantly White (88%)
- Race & ethnicity
- White 88% Hispanic / Latino 7% Two or more races 4% Native American 1%
- Hispanic origin (detail)
- Mexican 5%
- Common ancestry
- Portuguese 3% Lithuanian 3% Slovak 2%
- Foreign-born
- 3% · Canada
- Languages at home
- 93% English-only · Spanish 5%
Political lean MEDSL · Maricopa
- 2024 margin
- Toss-up / Even · D 47.7% · R 51.2% · Other 1.1%
- 2008→2024 swing
- +7.1pp toward D · 2008: -10.6pp · 2024: -3.5pp
- All cycles
- 2024: R+3.5 2020: D+2.2 2016: R+3.5 2012: R+12.0 2008: R+10.6
Not yet ingested
- Civics
- —
Market trends
- HPI YoY
- ▼ -66.26%
- Current HPI
- 314.3169
- Rent YoY
- —
- Metro
- Phoenix-Mesa-Chandler, AZ
- State GDP YoY
- ▲ 4.54%
- F500 in state
- 20
Industry mix (Fortune 500 HQ in AZ)
| Industry | F500 HQs | Revenue |
|---|---|---|
| Technology | 2 | $13B |
|
||
| Mining / Metals | 1 | $23B |
|
||
| Environmental Services | 1 | $16B |
|
||
| Metals / Steel | 1 | $14B |
|
||
| Technology Distribution | 1 | $9B |
|
||
| Homebuilding | 1 | $8B |
|
||
Price history
1 event — show timeline
- 2026-03-16 Listed $119,000 ARMLS
Cash-flow waterfall
monthlySold comps — $/sqft
last 12 mo · ≤1 miLoading sold comps…