 🏗️ New Construction
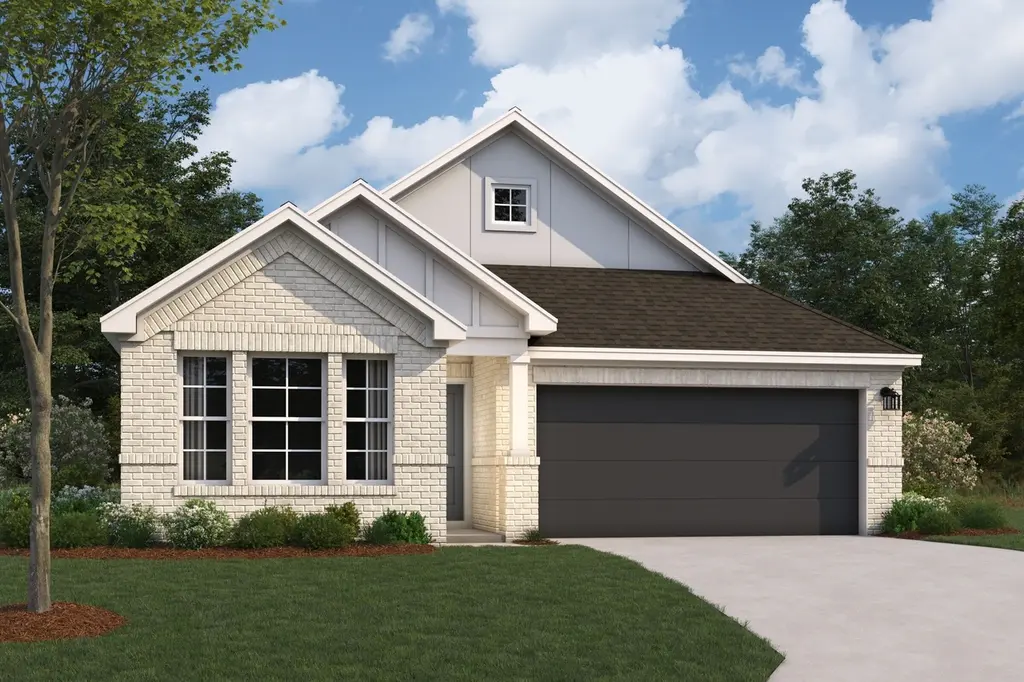
Eastland Plan · Magnolia, TX
Flood risk 1/10 · Minimal
- FEMA flood zone
- X (unshaded)
- Chance of flooding over 30 yrs
- 0.0%
- Est. flood insurance / yr
- $507 – $1,088
Fire risk 4/10 · Minor
- Est. fire insurance / yr
- $1,222 – $2,270
Heat risk 8/10 · Major
- Hot days now (above 111°F)
- 7 days/yr
- Hot days in 30 yrs
- 23 days/yr
Wind risk 8/10 · Major
- Chance of severe wind over 30 yrs
- 99.0%
Air-quality risk 2/10 · Minimal
- Unhealthy air days now
- 2 days/yr
- Unhealthy air days in 30 yrs
- 2 days/yr
Risk factors via First Street. Map © Google.
Why this score? — see what drove the D grade
The composite is a weighted blend of 9 inputs, each scored 0–100. Each bar is that input's sub-score; the figure is the points it added to the 100-point composite (weight × sub-score).
- Appreciation +10.0/10.0
- ARV discount +7.5/15.0
- Cash flow +7.2/30.0
- Schools +3.9/10.0
- Livability +3.7/5.0
- Rent growth +2.6/5.0
- Condition / age +2.5/5.0
- 1% rule +2.0/10.0
- DSCR +1.3/10.0
$264,490
🖨 Deal sheet (PDF) 📄 Offer letter ✓ Due diligence
Listing remarks MLS
The Eastland is a charming single-story home floorplan that boasts 1,602 square feet of functional living space and features 3-4 spacious bedrooms, 2 full bathrooms, and a front-loading 2-car garage.
Key facts
- 2 garage spots
- Listed 501 days
Neighborhood map
What this means for you Summary
Snapshot
- This is a 3-bed/2.0-bath single-family listed at $264k.
Deal economics
- At list price, monthly cash flow is $-382 ($-5k/yr) — negative.
- To cash-flow at today's rent, offer at most $219k (17.1% below list).
- To meet the 1% rule (rent ≥ 1% of price), the offer needs to be $192k (27.5% below list).
- Recommended offer: $192k (27.5% below list) — sets the bar for 1% rule.
- Cap rate 4.6% vs local median 3.4% in Magnolia — top-decile yield for the area; either an underpriced asset or a hidden risk that comps aren't pricing in. Stress-test before assuming the spread holds.
Location & tenants
- Location reads 73/100 on livability (#222 in TX) — a middle-class / working-renter tenant base. Strengths: crime A+, cost of living A+, housing A+; Watch: amenities F, commute F.
- Magnolia ISD (rural): math 42% / reading 45% proficiency, ranked #247 of 826 in TX (top 30%) — families likely to look elsewhere, expect single-tenant / working-renter base with shorter leases.
- Zoned schools: Willie E Williams El (math 46% / reading 41%, grade F, #1,269 of 4,322 statewide, top 30%, 869 students, 70% FRL); Magnolia J H (math 35% / reading 37%, grade F, #805 of 1,662 statewide, top 50%, 1,103 students, 57% FRL); Magnolia H S (math 47% / reading 62%, grade C-, #379 of 1,632 statewide, top 26%, 2,248 students, 31% FRL).
- Market conditions: Rents flat; 1622 active listings in the ZIP; 9 comparable units currently listed for rent nearby; rentals at typical pace (median 26d on market — plan ~3-4 weeks tenant-placement turnaround); high-income renter base; 13,259 units permitted in Montgomery County in 2024 (1,402 in 5+ unit buildings).
Forward outlook
- In year one you build about $29k of equity ($2k loan paydown + $27k appreciation (10.0% local appreciation)).
- Montgomery County population projected at +65% by 2050 — long-run rental-demand tailwind backs the buy-and-hold thesis.
- By year 2, paydown + projected appreciation supports a ~$47k cash-out refi (75% LTV) — recoverable capital for the next deal without selling this one.
Negotiation context
- It's been on market 501 days — a 12% lower offer ($233k) is reasonable based on typical stale-listing flexibility.
Risks & watch-outs
- Climate carrying-cost: severe wind risk, 99% chance of damaging wind over 30y; extreme-heat days projected 7→23/yr by 2055 (HVAC capex compounding) — expect insurance premiums to compound above CPI over the hold.
Questions for the listing agent
- What do current leases actually rent for vs. the listed asking? Can we see a recent rent roll and the last 12 months of T-12 income?
- It's been on market 501 days. Have you received any prior offers? Is the seller open to a 27% concession, seller financing, or rate buy-down credit?
- Why hasn't it sold? Are there any deal-killer items the seller is aware of (foundation, flood, title, zoning, code violations)?
- Is there a deadline driving the sale (1031 exchange, divorce, estate, relocation)? That informs how much negotiation room exists.
- Schools are D-rated, which usually means shorter tenancies and higher turnover. Who's the typical renter profile here, and what's been the actual vacancy rate?
- The area grade is low — what's the realistic commute time and amenity access for the typical tenant pool here? Any planned neighborhood developments (good or bad) we should know about?
- What's the average days-on-market for RENTAL listings here right now (not sales)? A rising rental-DOM trend means longer vacancies and softer asking-rent achievability than the comps imply.
- What's the recent tenant-quality profile in this submarket — average credit score on applications, eviction rate, late-payment / NSF rate, and stable-employment percentage? A property-management company in the area should have these aggregated.
- How much new for-sale + rental construction is in the pipeline within 1–3 miles? Heavy new supply typically softens prices + rents 12–24 months out; constrained supply supports both.
Investment metrics
- 1% rule
- 0.70% ✗
- Cap rate
- 4.62%
- Cash-on-cash
- -5.97%
- DSCR
- 0.73
- GRM
- 11.9
CMA / ARV
- ARV (median comp)
- $274,668
- List price
- $264,490
- Delta
- -3.71%
- Verdict
- FAIR
- Comps
- 20 within 1.0 mi
Show comp detail 12 sales within ~0.75 mi
| Address | Dist | Beds/Ba | Sqft | Sold | Price | $/sf | Match |
|---|---|---|---|---|---|---|---|
| 574 Bluebell Maiden Ct | 0.67mi | 3/2.0 | 1,619 (-2%) | 1mo | $269,990 | $167 | 65 |
| 236 Country Crossing Cir | 0.26mi | 3/2.0 | 1,871 (+14%) | 1mo | $264,999 | $142 | 65 |
| 928 Gentle Moss Dr | 0.54mi | 3/2.0 | 1,548 (-6%) | 1mo | $239,000 | $154 | 64 |
| 706 Umbrella Tree Dr | 0.63mi | 4/2.0 (+1) | 1,607 (-2%) | 0mo | $258,990 | $161 | 61 |
| 716 Autumn Cherry Trl | 0.44mi | 3/2.0 | 1,470 (-11%) | 2mo | $255,000 | $173 | 60 |
| 309 Cumberland Forest Dr | 0.51mi | 4/2.0 (+1) | 1,788 (+8%) | 2mo | $265,000 | $148 | 56 |
| 1047 Brighton Orchards Ln | 0.45mi | 4/2.5 (+1) | 1,826 (+11%) | 2mo | $250,000 | $137 | 52 |
| 232 Ashley Branch St | 0.72mi | 3/2.0 | 1,780 (+8%) | 2mo | $291,990 | $164 | 52 |
| 707 Hackberry Branch Ct | 0.74mi | 4/2.0 (+1) | 1,732 (+5%) | 1mo | $274,990 | $159 | 51 |
| 715 Umbrella Tree Dr | 0.66mi | 3/2.0 | 1,418 (-14%) | 1mo | $240,990 | $170 | 45 |
| 719 Umbrella Tree Dr | 0.66mi | 3/2.0 | 1,409 (-15%) | 1mo | $245,990 | $175 | 44 |
| 486 Southern Magnolia Way | 0.69mi | 3/2.0 | 1,418 (-14%) | 3mo | $243,990 | $172 | 42 |
Match score weights: distance 35% · size 25% · config 20% · recency 20%. Top-matched comps best support the ARV.
Projected returns pro-forma
10.0% appreciation · 0.32% rent growth · sell at horizon
- IRR
- 19.3%
- Equity multiple
- 2.56×
- Total profit
- $120,225
- Equity at exit
- $247,442
- IRR
- 17.3%
- Equity multiple
- 5.73×
- Total profit
- $364,109
- Equity at exit
- $533,619
Cash invested: $76,907 (down + closing). Projections, not guarantees.
Landlord ↔ Tenant lean methodology
- Overall (STATE)
- 87 Strongly Landlord-Friendly
- State Texas
- 87 Strongly Landlord-Friendly · R+5
- County
- — inherits STATE
- City
- — inherits STATE
ZIP-level market 77354
- Home prices YoY
- 2.4%
- Rents YoY
- 0.3%
- Active inventory
- 1622
- Price-to-rent
- 11.5×
Monthly cashflow live
- Estimated rent
- $1,919 high interval (Pro) →
- Mortgage (P&I)
- −$1,440
- Tax est. 1.5%
- −$343 /mo · $4,120/yr
- Insurance
- −$114
- HOA
- −$0
- Vacancy / Maint / Mgmt
- −$403
- Net cashflow
- $-382
Break-even live
Sensitivity live
| Price | -10% $-193 | -5% $-288 | +0% $-382 | +5% $-477 | +10% $-572 |
|---|---|---|---|---|---|
| Rent | -10% $-534 | -5% $-458 | +0% $-382 | +5% $-307 | +10% $-231 |
| Rate | -1.0pp $-244 | -0.5pp $-313 | base $-382 | +0.5pp $-454 | +1.0pp $-526 |
UW: 25.0% down · 7.5% · 30yr · 1.5% tax · 5.0% vac · 8.0% maint · 8.0% mgmt
Financing live
Cash to close
- Down payment
- $68,667
- Closing costs
- $8,240
- Reserves months
- —
- Total cash needed
- —
Loan-product check · same deal, 3 products live
Conventional
25% down · 7.5% · 30yr
- Down + closing
- —
- Monthly P&I
- —
- Monthly cashflow
- —
- DSCR
- —
- Eligible?
- —
Personal DTI + credit; lowest rate.
DSCR
20% down · 8.5% · 30yr
- Down + closing
- —
- Monthly P&I
- —
- Monthly cashflow
- —
- DSCR
- —
- Eligible?
- —
No personal income docs; deal must DSCR.
Hard money
10% down · 12.0% · 12mo
- Down + closing
- —
- Monthly P&I
- —
- Monthly cashflow
- —
- DSCR
- —
- Eligible?
- —
Short-term bridge; refi at stabilization.
Rent comps 9 comps
| Address | Beds | Baths | Sqft | Rent | $/sqft | DOM | Units | Dist |
|---|---|---|---|---|---|---|---|---|
| 297 Country Crossing Cir Magnolia, TX | 3.0 | 2.0 | 1806 | $1,731 | $0.96 | 0d | 1 | 0.28mi |
| 202 Alder Laurels Cv Magnolia, TX | 4.0 | 2.5 | 2229 | $2,036 | $0.91 | 23d | 1 | 0.37mi |
| 423 Jewett Meadow Dr Magnolia, TX | 3.0 | 2.0 | 1311 | $1,781 | $1.36 | 23d | 1 | 0.40mi |
| 764 Autumn Cherry Trl Magnolia, TX | 4.0 | 3.0 | 2196 | $1,665 | $0.76 | 45d | 1 | 0.45mi |
| 273 Douglas Hills Dr Magnolia, TX | 4.0 | 3.0 | 1922 | $1,895 | $0.99 | 45d | 1 | 0.56mi |
| 937 Gentle Moss Dr Magnolia, TX | 3.0 | 2.0 | 1252 | $1,635 | $1.31 | 7d | 1 | 0.57mi |
| 359 Cumberland Forest Dr Magnolia, TX | 4.0 | 2.0 | 1459 | $1,725 | $1.18 | 26d | 1 | 0.58mi |
| 408 Cumberland Forest Dr Magnolia, TX | 3.0 | 2.0 | 1402 | $1,795 | $1.28 | 45d | 1 | 0.68mi |
| 948 Oak Mist Ln Magnolia, TX | 3.0 | 2.0 | 1470 | $2,000 | $1.36 | 26d | 1 | 0.77mi |
Listing history 15 events
-
2026-06-21days on market $264,490 Active 501 DOM
-
2026-06-18days on market $264,490 Active 498 DOM
-
2026-06-17days on market $264,490 Active 497 DOM
-
2026-06-16days on market $264,490 Active 496 DOM
-
2026-06-15days on market $264,490 Active 495 DOM
-
2026-06-13days on market $264,490 Active 493 DOM
-
2026-06-09days on market $264,490 Active 489 DOM
-
2026-06-08days on market $264,490 Active 488 DOM
-
2026-06-07days on market $264,490 Active 487 DOM
-
2026-06-04days on market $264,490 Active 484 DOM
-
2026-06-03days on market $264,490 Active 483 DOM
-
2026-06-02days on market $264,490 Active 482 DOM
-
2026-06-01days on market $264,490 Active 481 DOM
-
2026-05-31days on market $264,490 Active 480 DOM
-
2025-02-06$264,490 Active 199-char remark
Show marketing remark (199 chars)
The Eastland is a charming single-story home floorplan that boasts 1,602 square feet of functional living space and features 3-4 spacious bedrooms, 2 full bathrooms, and a front-loading 2-car garage.
ⓘ Source: listings_history table (triggers on properties + properties_extension) + one-shot
backfill from property_details.listing_events for pre-trigger history.
Climate risk First Street
- Flood 1/10 Low FEMA zone X (unshaded) · 0% chance over 30 yrs
- Wildfire 4/10 Moderate
- Heat 8/10 Severe 7 d/yr ≥111°F today · 23 d/yr by 30 yrs out
- Wind 8/10 Severe 99% chance of damaging wind over 30 yrs
- Air quality 2/10 Low 2 unhealthy d/yr today · 2 by 30 yrs out
Nearby sold comps map
Loading sold comps map…
Walkable amenities ~0.75 mi
Loading nearby amenities…
Taxation est. · year 1
- Rental income
- $23,024
- − Mortgage interest
- −$15,386
- − Property taxes
- −$4,120
- − Insurance
- −$1,373
- − Repairs & maintenance
- −$1,842
- − Management
- −$1,842
- − Depreciation
- −$7,990
- Taxable loss
- −$9,529
- Est. tax savings @ 24.0%
- +$2,287
- After-tax cash flow
- $-2,302/yr
For passive investors: Depreciation is non-cash, so a rental often shows a tax loss while cash-flowing — sheltering income. Rental losses are passive: they offset passive income freely, and up to $25,000/yr can offset ordinary (W-2) income if you actively participate and your MAGI is under $100k (phasing out to $0 by $150k); unused losses carry forward. On sale, claimed depreciation is recaptured at up to 25%, and gains may owe capital-gains tax (a 1031 exchange can defer both). Figures are a year-1 estimate at your 24.0% rate — not tax advice; consult a CPA.
Schools (NCES district)
- District
- Magnolia ISD
- NCES district ID
- 4828740
- Math proficiency
- 42% ▼ -7.00%
- Reading proficiency
- 45% ▼ -4.00%
- Median HH income
- $71,692
- Composite
- 39.46/100
- National rank
- #3958
- State rank
- #247 of 826 in TX
Livability — Magnolia
- Score
- 73/100
- State rank
- #222
- US rank
- #5442
Category grades
Schools grade is shown separately in the Schools card above.
Census & demographics
- Census place
- Magnolia, TX
- County
- Montgomery County · 663,713 people
- Metro
- Houston-The Woodlands-Sugar Land, TX
- Population (ZIP)
- 44,900
- Household income
- $112,504
- Rent vs Own
- Severe rent burden
- 586.0
Population outlook (Montgomery County) Hauer SSP2
- Today (2025)
- 713,896 people
- By 2030
- 805,263 · +12.8%
- By 2040
- 992,708 · +39.1%
- By 2050
- 1,179,590 · +65.2%
- By 2075
- 1,628,084 · +128.1%
- By 2100
- 1,937,880 · +171.5%
Race, ethnicity, and origin ACS 2023
- Neighborhood character
- Predominantly White (66%)
- Race & ethnicity
- White 66% Hispanic / Latino 25% Two or more races 18% Black 3% Asian 1%
- Hispanic origin (detail)
- Mexican 14% Puerto Rican 1%
- Common ancestry
- Lithuanian 4% Slovak 2% Italian 2%
- Foreign-born
- 11% · Canada, Vietnam
- Languages at home
- 83% English-only · Spanish 15% Other Indo-European 1% German/W. Germanic 1%
Political lean MEDSL · Montgomery
- 2024 margin
- Solid R (+45.5) · D 26.8% · R 72.3%
- 2008→2024 swing
- +7.2pp toward D · 2008: -52.7pp · 2024: -45.5pp
- All cycles
- 2024: R+45.5 2020: R+43.8 2016: R+51.4 2012: R+60.7 2008: R+52.7
Not yet ingested
- Civics
- —
Market trends
- HPI YoY
- ▲ 12.09%
- Current HPI
- 512.87
- Rent YoY
- ▲ 0.32%
- Metro
- Houston-The Woodlands-Sugar Land, TX
- State GDP YoY
- ▲ 3.95%
- F500 in state
- 110
Industry mix (Fortune 500 HQ in TX)
| Industry | F500 HQs | Revenue |
|---|---|---|
| Energy | 16 | $1,198B |
|
||
| Technology | 5 | $198B |
|
||
| Engineering / Construction | 4 | $72B |
|
||
| Energy Services | 3 | $60B |
|
||
| Utilities | 3 | $41B |
|
||
| Healthcare | 2 | $330B |
|
||
Price history
1 event — show timeline
- 2025-02-06 Listed $264,490 Zillow
Cash-flow waterfall
monthlySold comps — $/sqft
last 12 mo · ≤1 miLoading sold comps…