 Duplex
400 N Jefferson St · Kaufman, TX
Flood risk 1/10 · Minimal
- FEMA flood zone
- X (unshaded)
- Chance of flooding over 30 yrs
- 0.0%
- Est. flood insurance / yr
- $507 – $1,088
Fire risk 6/10 · Moderate
- Est. fire insurance / yr
- $1,222 – $2,270
Heat risk 7/10 · Major
- Hot days now (above 111°F)
- 7 days/yr
- Hot days in 30 yrs
- 24 days/yr
Wind risk 6/10 · Moderate
- Chance of severe wind over 30 yrs
- 27.0%
Air-quality risk 2/10 · Minimal
- Unhealthy air days now
- 1 days/yr
- Unhealthy air days in 30 yrs
- 1 days/yr
Risk factors via First Street. Map © Google.
Why this score? — see what drove the C- grade
The composite is a weighted blend of 9 inputs, each scored 0–100. Each bar is that input's sub-score; the figure is the points it added to the 100-point composite (weight × sub-score).
- Cash flow +20.1/30.0
- ARV discount +7.5/15.0
- DSCR +6.4/10.0
- 1% rule +5.6/10.0
- Livability +3.4/5.0
- Schools +3.3/10.0
- Rent growth +2.5/5.0
- Condition / age +2.5/5.0
- Appreciation +0.0/10.0
$249,000
🖨 Deal sheet 📄 Offer letter ✓ Due diligence
Multi-family units
County records classify this as Multi-Family (2-4 Unit). Listing-text estimate: 2 units. confirmed
Listing remarks
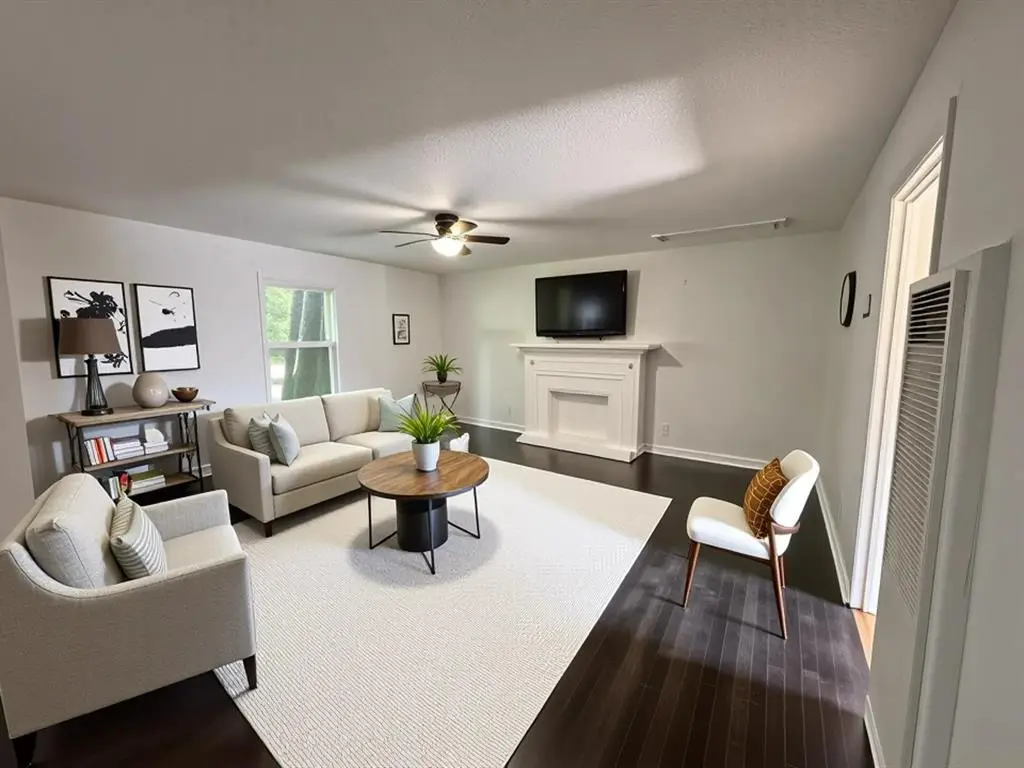
Investor-ready duplex in the heart of Kaufman. Side-by-side, all-attached two-building configuration offering two spacious 2BR 1BA units (approx. 988 SF each, about 1,975 SF total). Both units have received a basic interior refresh and are rent-ready, while the exterior offers a clear value-add opportunity for an investor willing to add cosmetic curb-appeal upgrades to drive rents higher. Strong rental demand in Kaufman, easy access to Hwy 175, walkable to downtown and local amenities. Perfect addition to a rental portfolio or a house-hack play, live in one side and rent the other. Legal: KAUFMAN ORIGINAL, BLOCK 3, LOT 5 and 6 PT and DUPLEX. Bring your vision and unlock the upside.
Key facts
- Strong rental demand
- Walkable to downtown
- Interior refresh
Tags
Property features AI
Finance
- Other: Property type: Residential income; Property subtype: Duplex; Number of buildings: 1; Total units: 2; Building area (public records): 1975; Municipal utility district: No; Horse permitted: No
- Financial info: Gross annual income: $31,176; Gross annual expenses: $10,900; Insurance expense: $1,500; Net operating income: $20,276; Capitalization rate: 8.11%; Listing terms: Cash
- HOA & community: No homeowners association
Exterior
- Parking: 4 parking spaces
- Utilities: City water; City sewer; Individual gas meter; Individual water meter
- Home design: Duplex (residential income); One story; Built in 1900; Known as '400 N Jefferson Duplex'; Entry faces east (property located on the east side of N Jefferson St.)
- Construction: Frame and siding construction; Composition roof; Pillar/post/pier foundation
- Exterior features: Driveway; Lot less than 0.5 acre (about 0.22 acres); Subdivision: Kaufman Original
Interior
- Kitchen: Dishwasher
- Bedrooms: 4 bedrooms
- Flooring: Vinyl flooring
- Bathrooms: 2 full bathrooms
- Heating & cooling: Central air conditioning; Electric heating
- Interior features: Decorative lighting; One-level layout
Neighborhood map
What this means for you Summary
Snapshot
- This is a 2 × 2.0-bed/1.0-bath units multifamily listed at $249k.
Deal economics
- At list price, monthly cash flow is $309 ($4k/yr) — positive. Per door: $155/mo.
- The deal already cash-flows at list — no discount required.
- Meets the 1% rule at list price ($3k rent vs $249k).
- Recommended offer: $245k (1.5% below list) — sets the bar for market timing.
- Cap rate 7.8% vs local median 4.1% in Kaufman — top-decile yield for the area; either an underpriced asset or a hidden risk that comps aren't pricing in. Stress-test before assuming the spread holds.
Location & tenants
- Location reads 68/100 on livability (#478 in TX) — a middle-class / working-renter tenant base. Strengths: cost of living A+, housing A+, crime A-; Watch: amenities F, commute F, employment D-.
- Kaufman ISD (town): math 38% / reading 39% proficiency, ranked #437 of 826 in TX (top 53%) — families likely to look elsewhere, expect single-tenant / working-renter base with shorter leases.
- Zoned schools: Lucille Nash El (math 44% / reading 48%, grade D-, #1,097 of 4,322 statewide, top 26%, 579 students, 68% FRL).
- Market conditions: 274 active listings in the ZIP; 3 comparable units currently listed for rent nearby; rentals at typical pace (median 18d on market — plan ~3-4 weeks tenant-placement turnaround); 1,747 units permitted in Kaufman County in 2024 (180 in 5+ unit buildings).
Forward outlook
- Local home prices are declining (-3.0%/yr); year-one equity from $2k of loan paydown is wiped out by about $7k of value loss. Plan a longer hold.
- Kaufman County population projected at +43% by 2050 — long-run rental-demand tailwind backs the buy-and-hold thesis.
Negotiation context
- It's been on market 17 days — a 2% lower offer ($245k) is reasonable based on typical stale-listing flexibility.
- 3 sale attempts since 4y ago with the ask held roughly flat each time — persistent listings suggest the price (not the market) is what's stuck; bring a comps-based counter.
Risks & watch-outs
- Watch-outs: built in 1900 — expect roof / HVAC / electrical / plumbing capex.
- Climate carrying-cost: major wind risk, 27% chance of damaging wind over 30y; major wildfire risk; extreme-heat days projected 7→24/yr by 2055 (HVAC capex compounding) — expect insurance premiums to compound above CPI over the hold.
Questions for the listing agent
- Can we see the unit-by-unit rent roll, current vacancy, and any below-market leases? What's the average tenancy length?
- What capital expenditures (roof, boiler, parking lot, exteriors) have been made in the last 5 years, and what's planned in the next 2?
- Built in 1900 — when were the roof, HVAC, electrical panel, plumbing, and water heater last replaced?
- Is there a deadline driving the sale (1031 exchange, divorce, estate, relocation)? That informs how much negotiation room exists.
- Schools are D-rated, which usually means shorter tenancies and higher turnover. Who's the typical renter profile here, and what's been the actual vacancy rate?
- What's the average days-on-market for RENTAL listings here right now (not sales)? A rising rental-DOM trend means longer vacancies and softer asking-rent achievability than the comps imply.
- What's the recent tenant-quality profile in this submarket — average credit score on applications, eviction rate, late-payment / NSF rate, and stable-employment percentage? A property-management company in the area should have these aggregated.
- How much new apartment / multifamily construction is in the pipeline within 1–3 miles? Heavy new supply (>2% of stock underway) typically softens rents 12–24 months out; light construction supports rent growth.
Investment metrics
- 1% rule
- 1.06% ✓
- Cap rate
- 7.78%
- Cash-on-cash
- 5.33%
- DSCR
- 1.24
- GRM
- 7.9
CMA / ARV
No comps found within radius.
Projected returns pro-forma
-3.0% appreciation · 3.0% rent growth · sell at horizon
- IRR
- -8.0%
- Equity multiple
- 0.71×
- Total profit
- $-20,565
- Equity at exit
- $37,127
- IRR
- 1.6%
- Equity multiple
- 1.11×
- Total profit
- $7,770
- Equity at exit
- $21,529
Cash invested: $69,720 (down + closing). Projections, not guarantees.
Landlord ↔ Tenant lean methodology
- Overall (STATE)
- 87 Strongly Landlord-Friendly
- State Texas
- 87 Strongly Landlord-Friendly · R+5
- County
- — inherits STATE
- City
- — inherits STATE
ZIP-level market 75142
- Home prices YoY
- -19.8%
- Active inventory
- 274
- Price-to-rent
- 15.7×
Monthly cashflow live
- Estimated rent
- $2,638 high interval (Pro) →
- Mortgage (P&I)
- −$1,306
- Tax from tax record
- −$365 /mo · $4,380/yr
- Insurance
- −$104
- HOA
- −$0
- Vacancy / Maint / Mgmt
- −$554
- Net cashflow
- $309
Break-even live
2-unit breakdown (identical units grouped — click to expand)
| Units | Beds | Baths | Est. rent |
|---|---|---|---|
| 2× units | 2.0 | 1 | $2,638 |
| #1 | 2.0 | 1 | $1,319 |
| #2 | 2.0 | 1 | $1,319 |
| Total (2 units) | $2,638 | ||
UW: 25.0% down · 7.5% · 30yr · 1.5% tax · 5.0% vac · 8.0% maint · 8.0% mgmt
Financing live
Cash to close
- Down payment
- $62,250
- Closing costs
- $7,470
- Reserves months
- —
- Total cash needed
- —
Loan-product check · same deal, 3 products live
Conventional
25% down · 7.5% · 30yr
- Down + closing
- —
- Monthly P&I
- —
- Monthly cashflow
- —
- DSCR
- —
- Eligible?
- —
Personal DTI + credit; lowest rate.
DSCR
20% down · 8.5% · 30yr
- Down + closing
- —
- Monthly P&I
- —
- Monthly cashflow
- —
- DSCR
- —
- Eligible?
- —
No personal income docs; deal must DSCR.
Hard money
10% down · 12.0% · 12mo
- Down + closing
- —
- Monthly P&I
- —
- Monthly cashflow
- —
- DSCR
- —
- Eligible?
- —
Short-term bridge; refi at stabilization.
Rent comps 3 comps
| Address | Beds | Baths | Sqft | Rent | $/sqft | DOM | Units | Dist |
|---|---|---|---|---|---|---|---|---|
| 1819 Pecan Valley Dr Kaufman, TX | 4.0 | 2.0 | 1890 | $2,650 | $1.40 | 17d | 1 | 1.33mi |
| 201 Melody Cir Kaufman, TX | 3.0 | 1.5 | 1288 | $1,700 | $1.32 | 44d | 1 | 1.43mi |
| 2600 Tabor Pkwy Kaufman, TX | 2.0–3.0 | 2.0 | 1178 | $1,480 | $1.26 | 1d | 9 | 1.47mi |
Listing history 13 events
-
2026-06-18days on market $249,000 Active 17 DOM
-
2026-06-17days on market $249,000 Active 16 DOM
-
2026-06-16days on market $249,000 Active 15 DOM
-
2026-06-15days on market $249,000 Active 14 DOM
-
2026-06-13days on market $249,000 Active 12 DOM
-
2026-06-13days on market $249,000 Active 11 DOM
-
2026-06-09days on market $249,000 Active 8 DOM
-
2026-06-08days on market $249,000 Active 7 DOM
-
2026-06-07days on market $249,000 Active 6 DOM
-
2026-06-04days on market $249,000 Active 3 DOM
-
2026-06-03days on market $249,000 Active 2 DOM
-
2026-06-02remarks 690-char remark
-
2026-06-02$249,000 Active 1 DOM
ⓘ Source: listings_history table (triggers on properties + properties_extension) + one-shot
backfill from property_details.listing_events for pre-trigger history.
Tax reassessment forecast TX · Resets to sale price
- Current annual tax
- $4,380 · $365/mo
- Projected year-2 tax
- $4,557 · $380/mo
- Expected delta
- +$177/yr (+$15/mo · 4.0%)
ⓘ Screening estimate from a state-policy table — verify with the county assessor before closing.
Climate risk First Street
- Flood 1/10 Low FEMA zone X (unshaded) · 0% chance over 30 yrs
- Wildfire 6/10 Major
- Heat 7/10 Severe 7 d/yr ≥111°F today · 24 d/yr by 30 yrs out
- Wind 6/10 Major 27% chance of damaging wind over 30 yrs
- Air quality 2/10 Low 1 unhealthy d/yr today · 1 by 30 yrs out
Nearby sold comps map
Loading sold comps map…
Walkable amenities ~0.75 mi
Loading nearby amenities…
Taxation est. · year 1
- Rental income
- $31,656
- − Mortgage interest
- −$13,948
- − Property taxes
- −$4,380
- − Insurance
- −$1,245
- − Repairs & maintenance
- −$2,532
- − Management
- −$2,532
- − Depreciation
- −$7,244
- Taxable loss
- −$225
- Est. tax savings @ 24.0%
- +$54
- After-tax cash flow
- $3,768/yr
For passive investors: Depreciation is non-cash, so a rental often shows a tax loss while cash-flowing — sheltering income. Rental losses are passive: they offset passive income freely, and up to $25,000/yr can offset ordinary (W-2) income if you actively participate and your MAGI is under $100k (phasing out to $0 by $150k); unused losses carry forward. On sale, claimed depreciation is recaptured at up to 25%, and gains may owe capital-gains tax (a 1031 exchange can defer both). Figures are a year-1 estimate at your 24.0% rate — not tax advice; consult a CPA.
Schools (NCES district)
- District
- Kaufman ISD
- NCES district ID
- 4825200
- Math proficiency
- 38% ▼ -11.00%
- Reading proficiency
- 39% ▬ 0.00%
- Median HH income
- $51,081
- Composite
- 33.36/100
- National rank
- #5485
- State rank
- #437 of 826 in TX
Livability — Kaufman
- Score
- 68/100
- State rank
- #478
- US rank
- #9602
Category grades
Schools grade is shown separately in the Schools card above.
Census & demographics
- Census place
- Kaufman, TX
- Population (ZIP)
- 23,301
Population outlook (Kaufman County) Hauer SSP2
- Today (2025)
- 138,716 people
- By 2030
- 150,815 · +8.7%
- By 2040
- 174,877 · +26.1%
- By 2050
- 198,020 · +42.8%
- By 2075
- 251,908 · +81.6%
- By 2100
- 285,325 · +105.7%
Race, ethnicity, and origin ACS 2023
- Neighborhood character
- Diverse neighborhood (Simpson 0.57)
- Race & ethnicity
- White 53% Hispanic / Latino 39% Two or more races 23% Black 4%
- Hispanic origin (detail)
- Mexican 36%
- Common ancestry
- Italian 1% Slovak 1% Serbian 1%
- Foreign-born
- 10% · Canada
- Languages at home
- 69% English-only · Spanish 30%
Political lean MEDSL · Kaufman
- 2024 margin
- Strong R (+27.9) · D 35.6% · R 63.5%
- 2008→2024 swing
- +7.9pp toward D · 2008: -35.8pp · 2024: -27.9pp
- All cycles
- 2024: R+27.9 2020: R+33.9 2016: R+47.0 2012: R+44.4 2008: R+35.8
Not yet ingested
- Civics
- —
Market trends
- HPI YoY
- ▼ -64.48%
- Current HPI
- 261.3091
- Rent YoY
- —
- Metro
- —
- State GDP YoY
- ▲ 3.95%
- F500 in state
- 110
Industry mix (Fortune 500 HQ in TX)
| Industry | F500 HQs | Revenue |
|---|---|---|
| Energy | 16 | $1,198B |
|
||
| Technology | 5 | $198B |
|
||
| Engineering / Construction | 4 | $72B |
|
||
| Energy Services | 3 | $60B |
|
||
| Utilities | 3 | $41B |
|
||
| Healthcare | 2 | $330B |
|
||
Price history
+25.1% since first listed7 events — show timeline
- 2026-06-02 Price Changed $249,000 NTREIS
- 2026-06-01 Listed $250,000 NTREIS
- 2025-05-17 Rental Removed $1,199 APPFOLIO
- 2025-05-13 Listed for Rent $1,199 APPFOLIO
- 2022-09-02 Listing Removed — NTREIS
- 2022-07-20 Listed $199,000 NTREIS
- 2022-02-07 Sold (Public Records) — Public Records
Property tax history
+7.4%/yrLatest (2025): $4,380 · -6.1% YoY. Source: county tax records.
Cash-flow waterfall
monthlySold comps — $/sqft
last 12 mo · ≤1 miLoading sold comps…