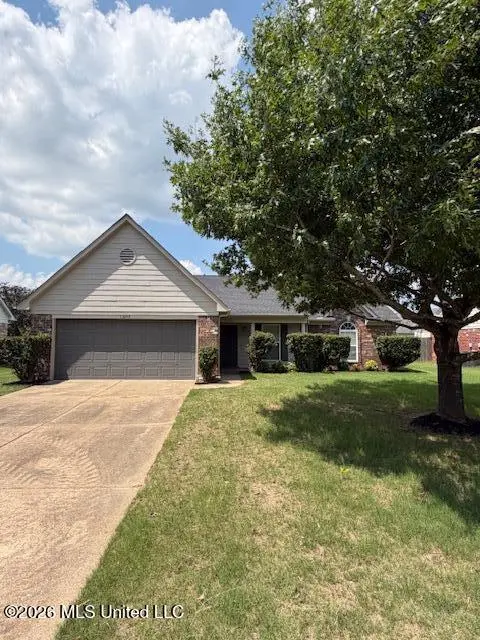
13240 White Hawk Cross · Olive Branch, MS
Flood risk 1/10 · Minimal
- FEMA flood zone
- X (unshaded)
- Chance of flooding over 30 yrs
- 0.0%
- Est. flood insurance / yr
- $507 – $1,088
Fire risk 4/10 · Minor
- Est. fire insurance / yr
- $1,241 – $2,305
Heat risk 7/10 · Major
- Hot days now (above 109°F)
- 7 days/yr
- Hot days in 30 yrs
- 22 days/yr
Wind risk 4/10 · Minor
- Chance of severe wind over 30 yrs
- 19.0%
Air-quality risk 2/10 · Minimal
- Unhealthy air days now
- 2 days/yr
- Unhealthy air days in 30 yrs
- 2 days/yr
Risk factors via First Street. Map © Google.
Why this score? — see what drove the D grade
The composite is a weighted blend of 9 inputs, each scored 0–100. Each bar is that input's sub-score; the figure is the points it added to the 100-point composite (weight × sub-score).
- Cash flow +13.4/30.0
- ARV discount +8.3/15.0
- DSCR +4.0/10.0
- Schools +4.0/10.0
- Livability +3.6/5.0
- 1% rule +2.5/10.0
- Condition / age +2.5/5.0
- Rent growth +2.4/5.0
- Appreciation +0.0/10.0
$285,000
🖨 Deal sheet 📄 Offer letter ✓ Due diligence
Listing remarks MLS
NEWLY CONSTRUCTED DESIGNER HOMES THAT INCLUDE FULLY SODDED YARD, GUTTERS, SECURITY SYSTEM, ORNAMENTAL MAIL BOX, HARDWOOD OR TILE ENTRY AND MANY OTHER STANDARD FEATURES. THIS IS THE BERKLEY PLAN.
Key facts
- Quartz countertops
- Brand-new roof
- Updated bathrooms
Tags
Property features AI
Finance
- HOA & community: Homeowners association with management services
Exterior
- Parking: 2-car garage
- Utilities: Public water; Public sewer; Electricity connected; Natural gas connected
- Home design: Single-family residence (house); One level
- Construction: Brick construction; Slab foundation
- Exterior features: Architectural shingle roof; Private yard
Interior
- Kitchen: Dishwasher; Free-standing electric range; Microwave
- Bathrooms: 2 full bathrooms
- Heating & cooling: Central heating; Central air conditioning
- Interior features: Fireplace in the living room; Private yard
Neighborhood map
What this means for you Summary
Snapshot
- This is a 3-bed/2.0-bath single-family listed at $285k.
Deal economics
- At list price, monthly cash flow is $5 ($54/yr) — positive.
- The deal already cash-flows at list — no discount required.
- To meet the 1% rule (rent ≥ 1% of price), the offer needs to be $213k (25.1% below list).
- Recommended offer: $213k (25.1% below list) — sets the bar for 1% rule.
- Cap rate 6.3% vs local median 4.3% in Olive Branch — top-decile yield for the area; either an underpriced asset or a hidden risk that comps aren't pricing in. Stress-test before assuming the spread holds.
Location & tenants
- Location reads 72/100 on livability (#29 in MS) — a middle-class / working-renter tenant base. Strengths: cost of living A+, housing A+, employment A; Watch: amenities F, commute F.
- Desoto County School District (suburban): math 48% / reading 42% proficiency, ranked #20 of 130 in MS (top 15%) — families likely to look elsewhere, expect single-tenant / working-renter base with shorter leases.
- Zoned schools: Center Hill Elementary School (math 64% / reading 55%, grade B-, #27 of 375 statewide, top 8%, 761 students, 100% FRL); Center Hill Middle (math 65% / reading 44%, grade B-, #17 of 179 statewide, top 9%, 775 students, 100% FRL); Center Hill High School (math 57% / reading 53%, grade C, #9 of 197 statewide, top 4%, 1,075 students, 100% FRL) — zoned schools average 100% FRL vs 43% district-wide (56 pts higher); higher-poverty schools than district average — tighter screening recommended.
- Market conditions: Rents soft (-0.3%/yr); 566 active listings in the ZIP; 12 comparable units currently listed for rent nearby; rentals at typical pace (median 20d on market — plan ~3-4 weeks tenant-placement turnaround); solid renter incomes; 1,155 units permitted in DeSoto County in 2024 (0 in 5+ unit buildings).
Forward outlook
- Local home prices are declining (-3.0%/yr); year-one equity from $2k of loan paydown is wiped out by about $9k of value loss. Plan a longer hold.
- DeSoto County population projected at +33% by 2050 — long-run rental-demand tailwind backs the buy-and-hold thesis.
Negotiation context
- Only 3 days on market — expect competitive offers; lowballing is unlikely to land.
- 2 sale attempts since 22y ago with the ask held roughly flat each time — persistent listings suggest the price (not the market) is what's stuck; bring a comps-based counter.
Risks & watch-outs
- Climate carrying-cost: extreme-heat days projected 7→22/yr by 2055 (HVAC capex compounding) — expect insurance premiums to compound above CPI over the hold.
Questions for the listing agent
- Is there a deadline driving the sale (1031 exchange, divorce, estate, relocation)? That informs how much negotiation room exists.
- Schools are B-rated — typically a magnet for longer-tenancy family renters. What's the average tenant stay here, and is there a school-zone premium baked into asking?
- The area grade is low — what's the realistic commute time and amenity access for the typical tenant pool here? Any planned neighborhood developments (good or bad) we should know about?
- What's the average days-on-market for RENTAL listings here right now (not sales)? A rising rental-DOM trend means longer vacancies and softer asking-rent achievability than the comps imply.
- What's the recent tenant-quality profile in this submarket — average credit score on applications, eviction rate, late-payment / NSF rate, and stable-employment percentage? A property-management company in the area should have these aggregated.
- How much new for-sale + rental construction is in the pipeline within 1–3 miles? Heavy new supply typically softens prices + rents 12–24 months out; constrained supply supports both.
Investment metrics
- 1% rule
- 0.75% ✗
- Cap rate
- 6.31%
- Cash-on-cash
- 0.07%
- DSCR
- 1.00
- GRM
- 11.1
CMA / ARV
- ARV (on-the-fly)
- $290,150
- Comps found
- 12
Show comp detail 12 sales within ~0.75 mi
| Address | Dist | Beds/Ba | Sqft | Sold | Price | $/sf | Match |
|---|---|---|---|---|---|---|---|
| 6442 Sandbourne East | 0.42mi | 3/2.0 | 1,711 (+3%) | 0mo | $287,000 | $168 | 75 |
| 12778 Fox Hunter's Dr | 0.65mi | 3/2.0 | 1,513 (-9%) | 1mo | $250,000 | $165 | 54 |
| 7331 Hunters Forest Dr | 0.64mi | 3/2.0 | 1,817 (+10%) | 2mo | $240,000 | $132 | 53 |
| 6491 Beckett Ln | 0.73mi | 3/2.0 | 1,808 (+9%) | 2mo | $316,900 | $175 | 49 |
| 13830 Wesley Banks Blvd | 0.63mi | 4/2.0 (+1) | 1,840 (+11%) | 1mo | $324,900 | $177 | 47 |
| 13829 Wesley Banks Blvd | 0.67mi | 4/2.0 (+1) | 1,808 (+9%) | 3mo | $316,900 | $175 | 46 |
| 13917 Wesley Banks Blvd | 0.70mi | 4/2.0 (+1) | 1,822 (+10%) | 3mo | $318,900 | $175 | 43 |
| 6541 Beckett Ln | 0.69mi | 4/2.0 (+1) | 1,839 (+11%) | 2mo | $322,900 | $176 | 43 |
| 13862 Molly Madeline Ln | 0.73mi | 4/2.0 (+1) | 1,840 (+11%) | 1mo | $324,900 | $177 | 42 |
| 13835 Jack Thomas Blvd | 0.74mi | 4/2.0 (+1) | 1,839 (+11%) | 3mo | $322,900 | $176 | 40 |
| 13939 Wesley Banks Blvd | 0.71mi | 4/2.0 (+1) | 1,871 (+13%) | 1mo | $327,900 | $175 | 40 |
| 13845 Wesley Banks Blvd | 0.68mi | 4/2.0 (+1) | 1,871 (+13%) | 3mo | $327,900 | $175 | 40 |
Match score weights: distance 35% · size 25% · config 20% · recency 20%. Top-matched comps best support the ARV.
Projected returns pro-forma
-3.0% appreciation · 0.0% rent growth · sell at horizon
- IRR
- -19.2%
- Equity multiple
- 0.34×
- Total profit
- $-52,295
- Equity at exit
- $42,494
- IRR
- -18.3%
- Equity multiple
- 0.12×
- Total profit
- $-69,928
- Equity at exit
- $24,642
Cash invested: $79,800 (down + closing). Projections, not guarantees.
Landlord ↔ Tenant lean methodology
- Overall (STATE)
- 90 Strongly Landlord-Friendly
- State Mississippi
- 90 Strongly Landlord-Friendly · R+11
- County
- — inherits STATE
- City
- — inherits STATE
ZIP-level market 38654
- Home prices YoY
- -26.1%
- Rents YoY
- -0.3%
- Active inventory
- 566
- Price-to-rent
- 11.1×
Monthly cashflow live
- Estimated rent
- $2,134 high interval (Pro) →
- Mortgage (P&I)
- −$1,495
- Tax from tax record
- −$68 /mo · $820/yr
- Insurance
- −$119
- HOA
- −$0
- Vacancy / Maint / Mgmt
- −$448
- Net cashflow
- $5
Break-even live
UW: 25.0% down · 7.5% · 30yr · 1.5% tax · 5.0% vac · 8.0% maint · 8.0% mgmt
Financing live
Cash to close
- Down payment
- $71,250
- Closing costs
- $8,550
- Reserves months
- —
- Total cash needed
- —
Loan-product check · same deal, 3 products live
Conventional
25% down · 7.5% · 30yr
- Down + closing
- —
- Monthly P&I
- —
- Monthly cashflow
- —
- DSCR
- —
- Eligible?
- —
Personal DTI + credit; lowest rate.
DSCR
20% down · 8.5% · 30yr
- Down + closing
- —
- Monthly P&I
- —
- Monthly cashflow
- —
- DSCR
- —
- Eligible?
- —
No personal income docs; deal must DSCR.
Hard money
10% down · 12.0% · 12mo
- Down + closing
- —
- Monthly P&I
- —
- Monthly cashflow
- —
- DSCR
- —
- Eligible?
- —
Short-term bridge; refi at stabilization.
Rent comps 12 comps
| Address | Beds | Baths | Sqft | Rent | $/sqft | DOM | Units | Dist |
|---|---|---|---|---|---|---|---|---|
| 6916 Greyhawk Cv N Olive Branch, MS | 4.0 | 2.0 | 1686 | $2,081 | $1.23 | 43d | 1 | 0.10mi |
| 6379 Sandbourne E Olive Branch, MS | 4.0 | 2.0 | 1880 | $2,035 | $1.08 | 3d | 1 | 0.47mi |
| 6391 Braybourne Main Olive Branch, MS | 3.0 | 2.0 | 1738 | $2,005 | $1.15 | 43d | 1 | 0.47mi |
| 7234 Fox Creek Dr Olive Branch, MS | 3.0 | 2.0 | 1550 | $1,800 | $1.16 | 21d | 1 | 0.49mi |
| 7228 Hunters Horn Dr Olive Branch, MS | 4.0 | 2.5 | 2249 | $2,155 | $0.96 | 4d | 1 | 0.52mi |
| 7298 Hunters Horn Dr Olive Branch, MS | 3.0 | 2.0 | 2000 | $1,826 | $0.91 | 11d | 1 | 0.58mi |
| 13073 Braybourne Pkwy Olive Branch, MS | 4.0 | 2.0 | 2100 | $2,190 | $1.04 | 23d | 1 | 0.65mi |
| 6241 Oxbourne Cv Olive Branch, MS | 4.0 | 2.0 | 1936 | $2,245 | $1.16 | 20d | 1 | 0.65mi |
| 6241 Oxbourne Cv Olive Branch, MS | 3.0 | 2.0 | 1936 | $2,195 | $1.13 | 2d | 1 | 0.65mi |
| 12778 Fox Hunter Dr Olive Branch, MS | 3.0 | 2.0 | 1513 | $1,845 | $1.22 | 21d | 1 | 0.68mi |
| 6198 Braybourne Main Olive Branch, MS | 3.0 | 2.0 | 1786 | $1,890 | $1.06 | 16d | 1 | 0.69mi |
| 13268 Sandbourne S Olive Branch, MS | 4.0 | 2.0 | 1845 | $1,985 | $1.08 | 2d | 1 | 0.75mi |
Listing history 3 events
-
2026-06-07statusdays on market $285,000 Pending 3 DOM
-
2026-06-03remarks 608-char remark
-
2026-06-03$285,000 Active 1 DOM
ⓘ Source: listings_history table (triggers on properties + properties_extension) + one-shot
backfill from property_details.listing_events for pre-trigger history.
Tax reassessment forecast MS · Resets to sale price
- Current annual tax
- $820 · $68/mo
- Projected year-2 tax
- $2,252 · $188/mo
- Expected delta
- +$1,432/yr (+$119/mo · 174.7%)
ⓘ Screening estimate from a state-policy table — verify with the county assessor before closing.
Climate risk First Street
- Flood 1/10 Low FEMA zone X (unshaded) · 0% chance over 30 yrs
- Wildfire 4/10 Moderate
- Heat 7/10 Severe 7 d/yr ≥109°F today · 22 d/yr by 30 yrs out
- Wind 4/10 Moderate 19% chance of damaging wind over 30 yrs
- Air quality 2/10 Low 2 unhealthy d/yr today · 2 by 30 yrs out
Nearby sold comps map
Loading sold comps map…
Walkable amenities ~0.75 mi
Loading nearby amenities…
Taxation est. · year 1
- Rental income
- $25,612
- − Mortgage interest
- −$15,964
- − Property taxes
- −$820
- − Insurance
- −$1,425
- − Repairs & maintenance
- −$2,049
- − Management
- −$2,049
- − Depreciation
- −$8,291
- Taxable loss
- −$4,986
- Est. tax savings @ 24.0%
- +$1,197
- After-tax cash flow
- $1,251/yr
For passive investors: Depreciation is non-cash, so a rental often shows a tax loss while cash-flowing — sheltering income. Rental losses are passive: they offset passive income freely, and up to $25,000/yr can offset ordinary (W-2) income if you actively participate and your MAGI is under $100k (phasing out to $0 by $150k); unused losses carry forward. On sale, claimed depreciation is recaptured at up to 25%, and gains may owe capital-gains tax (a 1031 exchange can defer both). Figures are a year-1 estimate at your 24.0% rate — not tax advice; consult a CPA.
Schools (NCES district)
- District
- Desoto County School District
- NCES district ID
- 2801320
- Math proficiency
- 48% ▼ -13.00%
- Reading proficiency
- 42% ▼ -6.00%
- Median HH income
- $59,272
- Composite
- 39.56/100
- National rank
- #3933
- State rank
- #20 of 130 in MS
Livability — Olive Branch
- Score
- 72/100
- State rank
- #29
- US rank
- #6509
Category grades
Schools grade is shown separately in the Schools card above.
Census & demographics
- Census place
- Olive Branch, MS
- County
- DeSoto County · 176,513 people
- City population
- 57,898
- Metro
- Memphis, TN-MS-AR
- Population (ZIP)
- 57,898
- Household income
- $103,092
- Rent vs Own
- Severe rent burden
- 801.0
Population outlook (DeSoto County) Hauer SSP2
- Today (2025)
- 203,338 people
- By 2030
- 217,692 · +7.1%
- By 2040
- 245,320 · +20.6%
- By 2050
- 270,133 · +32.8%
- By 2075
- 323,341 · +59.0%
- By 2100
- 348,742 · +71.5%
Race, ethnicity, and origin ACS 2023
- Neighborhood character
- Diverse neighborhood (Simpson 0.57)
- Race & ethnicity
- White 57% Black 32% Hispanic / Latino 5% Two or more races 5% Asian 2%
- Hispanic origin (detail)
- Mexican 4%
- Common ancestry
- Slovak 2% Lithuanian 1% Romanian 1%
- Foreign-born
- 4% · Canada, Vietnam, China
- Languages at home
- 93% English-only · Spanish 4% Vietnamese 1% Arabic 1%
Political lean MEDSL · DeSoto
- 2024 margin
- Strong R (+24.1) · D 36.7% · R 60.8% · Other 2.5%
- 2008→2024 swing
- +14.2pp toward D · 2008: -38.2pp · 2024: -24.1pp
- All cycles
- 2024: R+24.1 2020: R+23.9 2016: R+34.8 2012: R+33.5 2008: R+38.2
Not yet ingested
- Civics
- —
Market trends
- HPI YoY
- ▼ -66.27%
- Current HPI
- 187.2114
- Rent YoY
- ▼ -0.34%
- Metro
- Memphis, TN-MS-AR
- State GDP YoY
- —
- F500 in state
- 0
Price history
+94.7% since first listed4 events — show timeline
- 2026-06-02 Listed $285,000 MLSU
- 2026-03-12 Sold (Public Records) — Public Records
- 2005-05-31 Sold (MLS) — MLSU
- 2004-09-28 Listed $146,395 MLSU
Property tax history
+5.5%/yrLatest (2025): $820 · +48.1% YoY. Source: county tax records.
Cash-flow waterfall
monthlySold comps — $/sqft
last 12 mo · ≤1 miLoading sold comps…