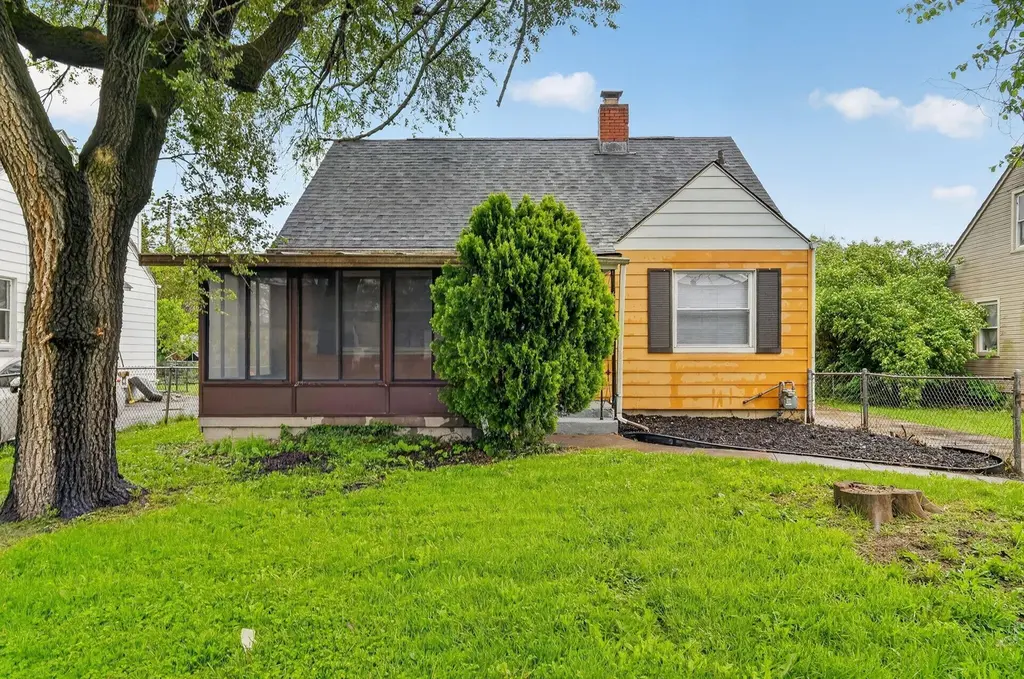
2458 Renwood Pl · Columbus, OH
Flood risk 1/10 · Minimal
- FEMA flood zone
- X (unshaded)
- Chance of flooding over 30 yrs
- 0.0%
- Est. flood insurance / yr
- $473 – $860
Fire risk 1/10 · Minimal
- Est. fire insurance / yr
- $713 – $1,323
Heat risk 3/10 · Minor
- Hot days now (above 100°F)
- 7 days/yr
- Hot days in 30 yrs
- 17 days/yr
Wind risk 2/10 · Minimal
- Chance of severe wind over 30 yrs
- 1.0%
Air-quality risk 3/10 · Minor
- Unhealthy air days now
- 2 days/yr
- Unhealthy air days in 30 yrs
- 4 days/yr
Risk factors via First Street. Map © Google.
Why this score? — see what drove the C- grade
The composite is a weighted blend of 9 inputs, each scored 0–100. Each bar is that input's sub-score; the figure is the points it added to the 100-point composite (weight × sub-score).
- Cash flow +17.6/30.0
- ARV discount +15.0/15.0
- DSCR +5.5/10.0
- 1% rule +4.6/10.0
- Livability +4.0/5.0
- Rent growth +3.4/5.0
- Condition / age +2.5/5.0
- Schools +1.7/10.0
- Appreciation +0.0/10.0
$144,900
🖨 Deal sheet 📄 Offer letter ✓ Due diligence
Listing remarks MLS
Selling as-is, no financing
Key facts
- 5,662 sq ft lot
- Garage
- Built 1942
Property features AI
Exterior
- Parking: Detached 1-car garage
- Utilities: Public water; Public sewer
- Home design: Single-family residence; One and one-half story; Built in 1942; No shared/common walls
- Construction: Block foundation
- Exterior features: Patio; Fenced yard; Outbuilding
Interior
- Bedrooms: 2 main-level bedrooms
- Flooring: Wood
- Bathrooms: 1 full bathroom
- Heating & cooling: Central air conditioning; Forced air heating
- Interior features: Full basement; Wood flooring
Neighborhood map
What this means for you Summary
Snapshot
- This is a 3-bed/1.0-bath single-family listed at $145k.
Deal economics
- At list price, monthly cash flow is $113 ($1k/yr) — positive.
- The deal already cash-flows at list — no discount required.
- To meet the 1% rule (rent ≥ 1% of price), the offer needs to be $139k (4.1% below list).
- Recommended offer: $139k (4.1% below list) — sets the bar for 1% rule.
- Cap rate 7.2% vs local median 3.8% in Columbus — top-decile yield for the area; either an underpriced asset or a hidden risk that comps aren't pricing in. Stress-test before assuming the spread holds.
Location & tenants
- Location reads 81/100 on livability (#97 in OH, #1,491 nationally) — a professional / high-income tenant draw. Strengths: commute A+, cost of living A+, housing A+; Watch: employment C-, crime F.
- Columbus City School District (urban): math 15% / reading 26% proficiency, ranked #626 of 656 in OH (top 95%) — low school quality limits family demand, transient renter base, plan for 1-2y turnover; 72% free/reduced lunch — lower-income household profile, screen leases tightly.
- Market conditions: Rents rising (+3.4%/yr); 166 active listings in the ZIP; 40 comparable units currently listed for rent nearby; rentals at typical pace (median 24d on market — plan ~3-4 weeks tenant-placement turnaround); lower-income renter base — watch delinquency; 8,139 units permitted in Franklin County in 2024 (5,940 in 5+ unit buildings).
- This rent runs 39% of the median local income ($43k/yr) — at the standard rent-burdened threshold; future hikes will face affordability resistance.
Forward outlook
- Local home prices are declining (-3.0%/yr); year-one equity from $1k of loan paydown is wiped out by about $4k of value loss. Plan a longer hold.
- Franklin County population projected at +34% by 2050 — long-run rental-demand tailwind backs the buy-and-hold thesis.
Negotiation context
- Only 11 days on market — expect competitive offers; lowballing is unlikely to land.
- 5 sale attempts since 27y ago with the ask held roughly flat each time — persistent listings suggest the price (not the market) is what's stuck; bring a comps-based counter.
- Current owner paid $1k; list at $145k implies a 11975% gain — meaningful room to come down on a strong offer.
Risks & watch-outs
- Watch-outs: built in 1942 — expect roof / HVAC / electrical / plumbing capex.
Questions for the listing agent
- Built in 1942 — when were the roof, HVAC, electrical panel, plumbing, and water heater last replaced?
- Is there a deadline driving the sale (1031 exchange, divorce, estate, relocation)? That informs how much negotiation room exists.
- Crime grade is F in this area — have there been break-ins, vandalism, or insurance claims at this property in the last 3 years? What carrier currently insures it and at what premium?
- What's the average days-on-market for RENTAL listings here right now (not sales)? A rising rental-DOM trend means longer vacancies and softer asking-rent achievability than the comps imply.
- What's the recent tenant-quality profile in this submarket — average credit score on applications, eviction rate, late-payment / NSF rate, and stable-employment percentage? A property-management company in the area should have these aggregated.
- How much new for-sale + rental construction is in the pipeline within 1–3 miles? Heavy new supply typically softens prices + rents 12–24 months out; constrained supply supports both.
Investment metrics
- 1% rule
- 0.96% ✗
- Cap rate
- 7.23%
- Cash-on-cash
- 3.35%
- DSCR
- 1.15
- GRM
- 8.7
CMA / ARV
- ARV (median comp)
- $188,975
- List price
- $144,900
- Delta
- -23.32%
- Verdict
- UNDERPRICED
- Comps
- 20 within 1.0 mi
Show comp detail 12 sales within ~0.75 mi
| Address | Dist | Beds/Ba | Sqft | Sold | Price | $/sf | Match |
|---|---|---|---|---|---|---|---|
| 2498 Renwood Pl | 0.06mi | 3/1.0 | 1,043 (-4%) | 1mo | $210,000 | $201 | 90 |
| 1257 Loretta Ave | 0.16mi | 3/1.0 | 1,119 (+3%) | 1mo | $210,000 | $188 | 87 |
| 1408 Briarwood Ave | 0.35mi | 3/1.0 | 1,144 (+5%) | 0mo | $137,500 | $120 | 76 |
| 2378 Velma Ave | 0.50mi | 2/1.0 (-1) | 1,100 (+1%) | 1mo | $165,000 | $150 | 70 |
| 2610 Atwood Ter | 0.35mi | 3/1.0 | 979 (-10%) | 1mo | $176,500 | $180 | 66 |
| 1448 Manchester Ave | 0.56mi | 3/1.0 | 1,014 (-7%) | 0mo | $180,000 | $178 | 62 |
| 2728 Atwood Ter | 0.46mi | 3/1.0 | 979 (-10%) | 1mo | $170,000 | $174 | 61 |
| 2205 Atwood Ter | 0.56mi | 3/1.0 | 979 (-10%) | 1mo | $189,900 | $194 | 56 |
| 2876 Medina Ave | 0.70mi | 3/1.0 | 1,020 (-6%) | 1mo | $218,000 | $214 | 56 |
| 2247 Atwood Ter | 0.51mi | 3/2.0 | 1,206 (+10%) | 0mo | $195,000 | $162 | 54 |
| 1175 E 23rd Ave | 0.73mi | 3/1.0 | 1,008 (-8%) | 1mo | $142,000 | $141 | 53 |
| 1562 Myrtle Ave | 0.57mi | 2/1.0 (-1) | 984 (-10%) | 0mo | $145,000 | $147 | 52 |
Match score weights: distance 35% · size 25% · config 20% · recency 20%. Top-matched comps best support the ARV.
Projected returns pro-forma
-3.0% appreciation · 3.41% rent growth · sell at horizon
- IRR
- -10.6%
- Equity multiple
- 0.61×
- Total profit
- $-15,671
- Equity at exit
- $21,605
- IRR
- -0.7%
- Equity multiple
- 0.95×
- Total profit
- $-1,922
- Equity at exit
- $12,528
Cash invested: $40,572 (down + closing). Projections, not guarantees.
Landlord ↔ Tenant lean methodology
- Overall (STATE)
- 73 Landlord-Friendly
- State Ohio
- 73 Landlord-Friendly · R+6
- County
- — inherits STATE
- City
- — inherits STATE
ZIP-level market 43211
- Home prices YoY
- -27.3%
- Rents YoY
- 3.4%
- Active inventory
- 166
- Price-to-rent
- 8.7×
Monthly cashflow live
- Estimated rent
- $1,389 high interval (Pro) →
- Mortgage (P&I)
- −$760
- Tax from tax record
- −$164 /mo · $1,964/yr
- Insurance
- −$60
- HOA
- −$0
- Vacancy / Maint / Mgmt
- −$292
- Net cashflow
- $113
Break-even live
UW: 25.0% down · 7.5% · 30yr · 1.5% tax · 5.0% vac · 8.0% maint · 8.0% mgmt
Financing live
Cash to close
- Down payment
- $36,225
- Closing costs
- $4,347
- Reserves months
- —
- Total cash needed
- —
Loan-product check · same deal, 3 products live
Conventional
25% down · 7.5% · 30yr
- Down + closing
- —
- Monthly P&I
- —
- Monthly cashflow
- —
- DSCR
- —
- Eligible?
- —
Personal DTI + credit; lowest rate.
DSCR
20% down · 8.5% · 30yr
- Down + closing
- —
- Monthly P&I
- —
- Monthly cashflow
- —
- DSCR
- —
- Eligible?
- —
No personal income docs; deal must DSCR.
Hard money
10% down · 12.0% · 12mo
- Down + closing
- —
- Monthly P&I
- —
- Monthly cashflow
- —
- DSCR
- —
- Eligible?
- —
Short-term bridge; refi at stabilization.
Rent comps 40 comps
| Address | Beds | Baths | Sqft | Rent | $/sqft | DOM | Units | Dist |
|---|---|---|---|---|---|---|---|---|
| 2299 Hamilton Ave Columbus, OH | 2.0 | 1.0 | 1000 | $1,200 | $1.20 | 43d | 1 | 0.22mi |
| 1269 Minnesota Ave Columbus, OH | 3.0 | 1.0 | 1075 | $1,550 | $1.44 | 7d | 1 | 0.29mi |
| 1352 E Hudson St Columbus, OH | 2.0 | 1.0 | 800 | $1,150 | $1.44 | 43d | 1 | 0.30mi |
| 2566 Atwood Ter Columbus, OH | 3.0 | 1.0 | 979 | $1,500 | $1.53 | 23d | 1 | 0.34mi |
| 2459 Atwood Ter Columbus, OH | 2.0 | 2.0 | 936 | $1,650 | $1.76 | 43d | 1 | 0.36mi |
| 1354 Minnesota Ave Columbus, OH | 3.0 | 2.0 | 1350 | $1,800 | $1.33 | 12d | 1 | 0.37mi |
| 1435 Republic Ave Columbus, OH | 3.0 | 1.0 | 908 | $1,395 | $1.54 | 7d | 1 | 0.37mi |
| 1435 Republic Ave Columbus, OH | 3.0 | 1.0 | 908 | $1,425 | $1.57 | 20d | 1 | 0.37mi |
| 2176 Ontario St Columbus, OH | 4.0 | 2.0 | 1066 | $1,650 | $1.55 | 23d | 1 | 0.41mi |
| 2203-2205 Mcguffey Rd Columbus, OH | 2.0 | 1.0 | 836 | $1,050 | $1.26 | 23d | 1 | 0.41mi |
| 2459 Hiawatha St Columbus, OH | 2.0 | 1.0 | 810 | $1,025 | $1.27 | 43d | 1 | 0.42mi |
| 2217 Grasmere Ave Columbus, OH | 2.0 | 1.5 | 720 | $1,650 | $2.29 | 14d | 1 | 0.47mi |
| 1514 Republic Ave Unit 1514 Columbus, OH | 3.0 | 1.5 | 1288 | $1,450 | $1.13 | 23d | 1 | 0.49mi |
| 2472 Pontiac St Columbus, OH | 2.0 | 1.0 | 754 | $995 | $1.32 | 14d | 1 | 0.51mi |
| 2472 Pontiac St Columbus, OH | 2.0 | 1.0 | 754 | $995 | $1.32 | 3d | 1 | 0.51mi |
| 1527 Republic Ave Columbus, OH | 3.0 | 1.0 | 1176 | $1,299 | $1.10 | 23d | 1 | 0.51mi |
| 1527 Republic Ave Columbus, OH | 3.0 | 1.0 | 1176 | $1,345 | $1.14 | 43d | 1 | 0.51mi |
| 2236 Atwood Ter Columbus, OH | 2.0 | 1.0 | 720 | $900 | $1.25 | 7d | 1 | 0.51mi |
| 1524 Genessee Ave Unit A Columbus, OH | 2.0 | 1.0 | 800 | $1,150 | $1.44 | 3d | 1 | 0.52mi |
| 967 Duxberry Ave Columbus, OH | 3.0 | 1.0 | 864 | $1,100 | $1.27 | 43d | 1 | 0.52mi |
| 1530 Genessee Ave Unit B Columbus, OH | 2.0 | 1.0 | 800 | $1,150 | $1.44 | 3d | 1 | 0.53mi |
| 1410 E Blake Ave Columbus, OH | 3.0 | 1.0 | 1300 | $1,700 | $1.31 | 23d | 1 | 0.53mi |
| 1555 Myrtle Ave Columbus, OH | 2.0 | 2.5 | 1200 | $1,500 | $1.25 | 43d | 1 | 0.54mi |
| 2767 Hiawatha St Columbus, OH | 3.0 | 1.0 | 896 | $1,475 | $1.65 | 7d | 1 | 0.56mi |
| 1576-1578 Arlington Ave Unit 1576 Columbus, OH | 2.0 | 1.0 | 902 | $1,000 | $1.11 | 43d | 1 | 0.58mi |
| 1536 E Weber Rd Columbus, OH | 3.0 | 2.0 | 1332 | $1,695 | $1.27 | 20d | 1 | 0.67mi |
| 1536 E Weber Rd Columbus, OH | 3.0 | 2.0 | 1332 | $1,695 | $1.27 | 23d | 1 | 0.67mi |
| 1624 Kohr Pl Columbus, OH | 3.0 | 1.0 | 1176 | $1,400 | $1.19 | 14d | 1 | 0.71mi |
| 1577 Cordell Ave Columbus, OH | 2.0 | 1.0 | 882 | $1,000 | $1.13 | 3d | 1 | 0.72mi |
| 2942 Atwood Ter Columbus, OH | 2.0 | 1.0 | 962 | $1,200 | $1.25 | 43d | 1 | 0.72mi |
| 2630 Homecroft Dr Columbus, OH | 2.0 | 1.0 | 1200 | $1,350 | $1.12 | 43d | 1 | 0.73mi |
| 1269 E 23rd Ave Columbus, OH | 3.0 | 1.0 | 1175 | $1,350 | $1.15 | 7d | 1 | 0.76mi |
| 1320 E 23rd Ave Unit 1320 Columbus, OH | 3.0 | 1.0 | 1134 | $1,050 | $0.93 | 43d | 1 | 0.77mi |
| 2530 Beulah Rd Columbus, OH | 2.0 | 1.0 | 720 | $1,345 | $1.87 | 14d | 1 | 0.78mi |
| 1185 E 22nd Ave Columbus, OH | 3.0 | 1.0 | 1304 | $1,400 | $1.07 | 43d | 1 | 0.79mi |
| 1171 E 22nd Ave Unit 1171 Columbus, OH | 2.0 | 1.0 | 750 | $1,100 | $1.47 | 17d | 1 | 0.79mi |
| 1500 E 25th Ave Columbus, OH | 2.0 | 1.0 | 720 | $850 | $1.18 | 43d | 1 | 0.82mi |
| 870 Melrose Ave Columbus, OH | 2.0 | 1.0 | 732 | $1,345 | $1.84 | 7d | 1 | 0.82mi |
| 1500 E 25th Ave Unit 2 Columbus, OH | 2.0 | 1.0 | 720 | $850 | $1.18 | 23d | 1 | 0.82mi |
| 1906-1908 Cleveland Ave Columbus, OH | 3.0 | 1.0 | 1384 | $1,295 | $0.94 | 43d | 1 | 0.83mi |
Listing history 13 events
-
2026-05-08$144,900 Active 588-char remark
-
2021-07-29soldstatus $1,200
-
2018-03-13soldstatus $29,900 Closed 27-char remark
Show marketing remark (27 chars)
Selling as-is, no financing
-
2018-03-07status Pending 27-char remark
Show marketing remark (27 chars)
Selling as-is, no financing
-
2018-03-06$29,900 Active 27-char remark
Show marketing remark (27 chars)
Selling as-is, no financing
-
2004-10-27historical
-
2004-07-16$78,900
-
2000-05-02soldstatus $66,900
-
2000-04-28soldstatus $66,900
-
2000-04-10historical
-
2000-02-25$64,900
-
2000-02-21historical
-
1999-07-23$64,900
ⓘ Source: listings_history table (triggers on properties + properties_extension) + one-shot
backfill from property_details.listing_events for pre-trigger history.
Tax reassessment forecast OH · Partial reset (capped growth)
- Current annual tax
- $1,964 · $164/mo
- Projected year-2 tax
- $2,112 · $176/mo
- Expected delta
- +$148/yr (+$12/mo · 7.6%)
ⓘ Screening estimate from a state-policy table — verify with the county assessor before closing.
Climate risk First Street
- Flood 1/10 Low FEMA zone X (unshaded) · 0% chance over 30 yrs
- Wildfire 1/10 Low
- Heat 3/10 Moderate 7 d/yr ≥100°F today · 17 d/yr by 30 yrs out
- Wind 2/10 Low 100% chance of damaging wind over 30 yrs
- Air quality 3/10 Moderate 2 unhealthy d/yr today · 4 by 30 yrs out
Nearby sold comps map
Loading sold comps map…
Walkable amenities ~0.75 mi
Loading nearby amenities…
Taxation est. · year 1
- Rental income
- $16,668
- − Mortgage interest
- −$8,117
- − Property taxes
- −$1,964
- − Insurance
- −$724
- − Repairs & maintenance
- −$1,333
- − Management
- −$1,333
- − Depreciation
- −$4,215
- Taxable loss
- −$1,019
- Est. tax savings @ 24.0%
- +$245
- After-tax cash flow
- $1,606/yr
For passive investors: Depreciation is non-cash, so a rental often shows a tax loss while cash-flowing — sheltering income. Rental losses are passive: they offset passive income freely, and up to $25,000/yr can offset ordinary (W-2) income if you actively participate and your MAGI is under $100k (phasing out to $0 by $150k); unused losses carry forward. On sale, claimed depreciation is recaptured at up to 25%, and gains may owe capital-gains tax (a 1031 exchange can defer both). Figures are a year-1 estimate at your 24.0% rate — not tax advice; consult a CPA.
Schools (NCES district)
- District
- Columbus City School District
- NCES district ID
- 3904380
- Math proficiency
- 15% ▼ -17.00%
- Reading proficiency
- 26% ▼ -12.00%
- Median HH income
- $38,483
- Composite
- 17.19/100
- National rank
- #9105
- State rank
- #626 of 656 in OH
Livability — Columbus
- Score
- 81/100
- State rank
- #97
- US rank
- #1491
Category grades
Schools grade is shown separately in the Schools card above.
Census & demographics
- Census place
- Columbus, OH
- County
- Franklin County · 1,351,780 people
- City population
- 612,189
- Metro
- Columbus, OH
- Population (ZIP)
- 22,313
- Household income
- $42,579
- Rent vs Own
- Severe rent burden
- 1282.0
Population outlook (Franklin County) Hauer SSP2
- Today (2025)
- 1,456,139 people
- By 2030
- 1,556,890 · +6.9%
- By 2040
- 1,757,349 · +20.7%
- By 2050
- 1,950,539 · +34.0%
- By 2075
- 2,376,171 · +63.2%
- By 2100
- 2,636,796 · +81.1%
Race, ethnicity, and origin ACS 2023
- Neighborhood character
- Diverse neighborhood (Simpson 0.60)
- Race & ethnicity
- Black 58% White 21% Hispanic / Latino 13% Two or more races 12% Asian 2%
- Hispanic origin (detail)
- Mexican 8% Dominican 1%
- Common ancestry
- Italian 1%
- Foreign-born
- 10% · Canada, India
- Languages at home
- 84% English-only · Spanish 11% Other Indo-European 2% Arabic 1%
Political lean MEDSL · Franklin
- 2024 margin
- Strong D (+28.4) · D 63.7% · R 35.3% · Other 1.0%
- 2008→2024 swing
- +7.7pp toward D · 2008: 20.7pp · 2024: 28.4pp
- All cycles
- 2024: D+28.4 2020: D+31.4 2016: D+25.9 2012: D+21.7 2008: D+20.7
Not yet ingested
- Civics
- —
Market trends
- HPI YoY
- ▼ -94.10%
- Current HPI
- 250.3885
- Rent YoY
- ▲ 3.41%
- Metro
- Columbus, OH
- State GDP YoY
- ▲ 1.98%
- F500 in state
- 48
Industry mix (Fortune 500 HQ in OH)
| Industry | F500 HQs | Revenue |
|---|---|---|
| Insurance | 3 | $145B |
|
||
| Industrial Machinery | 3 | $49B |
|
||
| Financial Services | 3 | $24B |
|
||
| Consumer Goods | 2 | $93B |
|
||
| Aerospace / Defense | 2 | $47B |
|
||
| Utilities | 2 | $33B |
|
||
Price history
+123.3% since first listed14 events — show timeline
- 2026-05-19 Pending — CBRMLS
- 2026-05-08 Listed $144,900 CBRMLS
- 2021-07-29 Sold (Public Records) $1,200 Public Records
- 2018-03-13 Sold (MLS) $29,900 CBRMLS
- 2018-03-07 Pending — CBRMLS
- 2018-03-06 Listed $29,900 CBRMLS
- 2004-10-27 Listing Removed — CBRMLS
- 2004-07-16 Listed $78,900 CBRMLS
- 2000-05-02 Sold (Public Records) $66,900 Public Records
- 2000-04-28 Sold (MLS) $66,900 CBRMLS
- 2000-04-10 Listing Removed — CBRMLS
- 2000-02-25 Listed $64,900 CBRMLS
- 2000-02-21 Listing Removed — CBRMLS
- 1999-07-23 Listed $64,900 CBRMLS
Property tax history
+7.4%/yrLatest (2024): $1,964 · +1.3% YoY. Source: county tax records.
Cash-flow waterfall
monthlySold comps — $/sqft
last 12 mo · ≤1 miLoading sold comps…