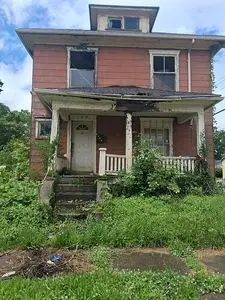
377 N Mathison St · Dayton, OH
Flood risk 1/10 · Minimal
- FEMA flood zone
- X (unshaded)
- Chance of flooding over 30 yrs
- 0.0%
- Est. flood insurance / yr
- $473 – $860
Fire risk 1/10 · Minimal
- Est. fire insurance / yr
- $713 – $1,323
Heat risk 4/10 · Minor
- Hot days now (above 104°F)
- 7 days/yr
- Hot days in 30 yrs
- 19 days/yr
Wind risk 2/10 · Minimal
- Chance of severe wind over 30 yrs
- 0.0%
Air-quality risk 3/10 · Minor
- Unhealthy air days now
- 2 days/yr
- Unhealthy air days in 30 yrs
- 4 days/yr
Risk factors via First Street. Map © Google.
Why this score? — see what drove the D grade
The composite is a weighted blend of 9 inputs, each scored 0–100. Each bar is that input's sub-score; the figure is the points it added to the 100-point composite (weight × sub-score).
- Cash flow +15.0/30.0
- ARV discount +7.5/15.0
- 1% rule +5.0/10.0
- DSCR +5.0/10.0
- Rent growth +3.5/5.0
- Livability +3.2/5.0
- Condition / age +2.5/5.0
- Schools +1.3/10.0
- Appreciation +0.0/10.0
$11,500
🖨 Deal sheet (PDF) 📄 Offer letter ✓ Due diligence
Listing remarks
Investor Special & acirc; & euro; & ldquo; Looking for investors comfortable with major rehabs/full-gut projects. Property is vacant and will require significant repairs and cleanout. Major rehab or teardown opportunity. Surrounding comparable homes have sold fully renovated in the $75,000 & acirc; & euro; & ldquo; $85,000 range. Perfect for experienced investors, developers, or buy and hold landlords looking to add to their portfolio at a deep discount.
Key facts
- Built 1914
- Listed 16 days
Property features AI
Exterior
- Home design: Built in 1914
- Construction: Living area approximately 1320
- Exterior features: Located in the Roosevelt subdivision
Neighborhood map
What this means for you Summary
Snapshot
- This is a 3-bed/1.0-bath single-family listed at $12k.
Deal economics
- At list price, monthly cash flow is $843 ($10k/yr) — positive.
- The deal already cash-flows at list — no discount required.
- Meets the 1% rule at list price ($1k rent vs $12k).
- Recommended offer: $11k (1.5% below list) — sets the bar for market timing.
- Cap rate 94.3% vs local median 7.3% in Dayton — top-decile yield for the area; either an underpriced asset or a hidden risk that comps aren't pricing in. Stress-test before assuming the spread holds.
Location & tenants
- Location reads 65/100 on livability (#716 in OH) — a middle-class / working-renter tenant base. Strengths: cost of living A+, housing A+, health & safety A; Watch: amenities C-, crime F, commute F.
- Dayton City (urban): math 12% / reading 21% proficiency, ranked #641 of 656 in OH (top 98%) — low school quality limits family demand, transient renter base, plan for 1-2y turnover; 74% free/reduced lunch — lower-income household profile, screen leases tightly.
- Zoned schools: River'S Edge Montessori Elementary School (math 22% / reading 32%, grade F, #1,193 of 1,584 statewide, top 76%, 494 students, 0% FRL); Wogaman Middle School (math 8% / reading 12%, grade F, #645 of 654 statewide, top 99%, 364 students, 0% FRL); Belmont High School (math 5% / reading 20%, grade F, #720 of 781 statewide, top 93%, 1,100 students, 0% FRL) — zoned schools average 0% FRL vs 74% district-wide (74 pts lower); this property's tenant base skews higher-income than the district average.
- Market conditions: Rents rising fast (+4.1%/yr); 140 active listings in the ZIP; 40 comparable units currently listed for rent nearby; rentals at typical pace (median 26d on market — plan ~3-4 weeks tenant-placement turnaround); 40% of comp listings sitting > 30 days — soft ceiling on asking rent; lower-income renter base — watch delinquency; 907 units permitted in Montgomery County in 2024 (416 in 5+ unit buildings).
- This rent runs 38% of the median local income ($37k/yr) — at the standard rent-burdened threshold; future hikes will face affordability resistance.
Forward outlook
- Local home prices are declining (-3.0%/yr); year-one equity from $80 of loan paydown is wiped out by about $345 of value loss. Plan a longer hold.
- Montgomery County population projected at -10% by 2050 — secular population decline; favor cash flow + early exit over multi-decade hold.
- At projected returns (-3.0% appreciation + 4.1% rent growth), your $3k cash investment doubles in ~1 year — after that, you're playing with house money.
Negotiation context
- It's been on market 16 days — a 2% lower offer ($11k) is reasonable based on typical stale-listing flexibility.
Risks & watch-outs
- Watch-outs: property tax is 2.8% of price; built in 1914 — expect roof / HVAC / electrical / plumbing capex.
Questions for the listing agent
- Built in 1914 — when were the roof, HVAC, electrical panel, plumbing, and water heater last replaced?
- Property tax is high relative to price — has the assessment been appealed recently, and will the sale trigger a re-assessment?
- Is there a deadline driving the sale (1031 exchange, divorce, estate, relocation)? That informs how much negotiation room exists.
- Crime grade is F in this area — have there been break-ins, vandalism, or insurance claims at this property in the last 3 years? What carrier currently insures it and at what premium?
- The area grade is low — what's the realistic commute time and amenity access for the typical tenant pool here? Any planned neighborhood developments (good or bad) we should know about?
- What's the average days-on-market for RENTAL listings here right now (not sales)? A rising rental-DOM trend means longer vacancies and softer asking-rent achievability than the comps imply.
- What's the recent tenant-quality profile in this submarket — average credit score on applications, eviction rate, late-payment / NSF rate, and stable-employment percentage? A property-management company in the area should have these aggregated.
- How much new for-sale + rental construction is in the pipeline within 1–3 miles? Heavy new supply typically softens prices + rents 12–24 months out; constrained supply supports both.
Investment metrics
- 1% rule
- 10.30% ✓
- Cap rate
- 94.29%
- Cash-on-cash
- 314.27%
- DSCR
- 14.98
- GRM
- 0.8
CMA / ARV
- ARV (on-the-fly)
- $55,440
- Comps found
- 12
Show comp detail 12 sales within ~0.75 mi
| Address | Dist | Beds/Ba | Sqft | Sold | Price | $/sf | Match |
|---|---|---|---|---|---|---|---|
| 200 N Orchard Ave | 0.12mi | 3/1.5 | 1,256 (-5%) | 4mo | $35,000 | $28 | 82 |
| 113 Anna St | 0.51mi | 3/1.0 | 1,344 (+2%) | 5mo | $88,000 | $65 | 69 |
| 621 Kammer Ave | 0.41mi | 3/1.0 | 1,207 (-9%) | 2mo | $55,000 | $46 | 65 |
| 233 Westwood Ave | 0.73mi | 3/1.0 | 1,236 (-6%) | 1mo | $45,000 | $36 | 54 |
| 127 N Ardmore Ave | 0.40mi | 3/1.5 | 1,512 (+14%) | 1mo | $29,700 | $20 | 54 |
| 1124 Seneca Dr | 0.74mi | 3/2.0 | 1,300 (-2%) | 6mo | $78,000 | $60 | 54 |
| 1119 Windsor Ave | 0.71mi | 3/1.0 | 1,380 (+4%) | 7mo | $58,000 | $42 | 54 |
| 552 Evergreen Ave | 0.50mi | 2/1.0 (-1) | 1,152 (-13%) | 2mo | $44,000 | $38 | 49 |
| 352 Huron Ave | 0.73mi | 2/1.0 (-1) | 1,240 (-6%) | 2mo | $40,000 | $32 | 49 |
| 216 Westwood Ave | 0.71mi | 3/2.0 | 1,436 (+9%) | 1mo | $157,000 | $109 | 47 |
| 140 S Kilmer St | 0.56mi | 4/2.0 (+1) | 1,452 (+10%) | 3mo | $137,500 | $95 | 46 |
| 1135 Windsor Ave | 0.74mi | 3/1.0 | 1,484 (+12%) | 4mo | $45,000 | $30 | 42 |
Match score weights: distance 35% · size 25% · config 20% · recency 20%. Top-matched comps best support the ARV.
Projected returns pro-forma
-3.0% appreciation · 4.06% rent growth · sell at horizon
- IRR
- —
- Equity multiple
- 17.51×
- Total profit
- $53,148
- Equity at exit
- $1,715
- IRR
- —
- Equity multiple
- 38.55×
- Total profit
- $120,896
- Equity at exit
- $994
Cash invested: $3,220 (down + closing). Projections, not guarantees.
Landlord ↔ Tenant lean methodology
- Overall (STATE)
- 73 Landlord-Friendly
- State Ohio
- 73 Landlord-Friendly · R+6
- County
- — inherits STATE
- City
- — inherits STATE
ZIP-level market 45417
- Home prices YoY
- -32.3%
- Rents YoY
- 4.1%
- Active inventory
- 140
- Price-to-rent
- 0.8×
Monthly cashflow live
- Estimated rent
- $1,184 high interval (Pro) →
- Mortgage (P&I)
- −$60
- Tax from tax record
- −$27 /mo · $327/yr
- Insurance
- −$5
- HOA
- −$0
- Vacancy / Maint / Mgmt
- −$249
- Net cashflow
- $843
Break-even live
Sensitivity live
| Price | -10% $850 | -5% $847 | +0% $843 | +5% $840 | +10% $837 |
|---|---|---|---|---|---|
| Rent | -10% $750 | -5% $797 | +0% $843 | +5% $890 | +10% $937 |
| Rate | -1.0pp $849 | -0.5pp $846 | base $843 | +0.5pp $840 | +1.0pp $837 |
UW: 25.0% down · 7.5% · 30yr · 1.5% tax · 5.0% vac · 8.0% maint · 8.0% mgmt
Financing live
Cash to close
- Down payment
- $2,875
- Closing costs
- $345
- Reserves months
- —
- Total cash needed
- —
Loan-product check · same deal, 3 products live
Conventional
25% down · 7.5% · 30yr
- Down + closing
- —
- Monthly P&I
- —
- Monthly cashflow
- —
- DSCR
- —
- Eligible?
- —
Personal DTI + credit; lowest rate.
DSCR
20% down · 8.5% · 30yr
- Down + closing
- —
- Monthly P&I
- —
- Monthly cashflow
- —
- DSCR
- —
- Eligible?
- —
No personal income docs; deal must DSCR.
Hard money
10% down · 12.0% · 12mo
- Down + closing
- —
- Monthly P&I
- —
- Monthly cashflow
- —
- DSCR
- —
- Eligible?
- —
Short-term bridge; refi at stabilization.
Rent comps 40 comps
| Address | Beds | Baths | Sqft | Rent | $/sqft | DOM | Units | Dist |
|---|---|---|---|---|---|---|---|---|
| 216 N Ardmore Ave Dayton, OH | 3.0 | 1.0 | 1500 | $1,100 | $0.73 | 5d | 1 | 0.33mi |
| 40 S Mathison St Dayton, OH | 3.0 | 1.0 | 1300 | $1,200 | $0.92 | 16d | 1 | 0.38mi |
| 42 S Mathison St Dayton, OH | 3.0 | 1.0 | 1300 | $1,220 | $0.94 | 5d | 1 | 0.38mi |
| 725 Maplehurst Ave Dayton, OH | 2.0 | 1.0 | 1104 | $895 | $0.81 | 45d | 1 | 0.42mi |
| 437 Lorenz Ave Dayton, OH | 3.0 | 1.0 | 1322 | $1,200 | $0.91 | 25d | 1 | 0.43mi |
| 70 Gramont Ave Dayton, OH | 3.0 | 1.5 | 966 | $1,300 | $1.35 | 4d | 1 | 0.59mi |
| 1119 Superior Ave Unit 1119 Dayton, OH | 3.0 | 1.0 | 1435 | $1,350 | $0.94 | 5d | 1 | 0.65mi |
| 635 Anna St Dayton, OH | 3.0 | 1.0 | 960 | $1,300 | $1.35 | 16d | 1 | 0.67mi |
| 660 Gramont Ave Dayton, OH | 3.0 | 1.0 | 1142 | $1,050 | $0.92 | 5d | 1 | 0.72mi |
| 424 Lexington Ave Dayton, OH | 3.0 | 2.0 | 1536 | $1,025 | $0.67 | 45d | 1 | 0.78mi |
| 617 Westwood Ave Dayton, OH | 3.0 | 1.0 | 1304 | $1,050 | $0.81 | 45d | 1 | 0.78mi |
| 1045 Philadelphia Dr Dayton, OH | 2.0 | 1.0 | 1290 | $1,150 | $0.89 | 4d | 1 | 0.78mi |
| 47 Leroy St Dayton, OH | 3.0 | 1.0 | 1456 | $1,200 | $0.82 | 45d | 1 | 0.78mi |
| 1045 Shakespeare Ave Dayton, OH | 3.0 | 1.0 | 1435 | $1,275 | $0.89 | 45d | 1 | 0.82mi |
| 652 Dennison Ave Dayton, OH | 2.0 | 2.0 | 988 | $1,095 | $1.11 | 23d | 1 | 0.90mi |
| 1011 N Broadway St Dayton, OH | 3.0 | 1.5 | 1700 | $950 | $0.56 | 45d | 1 | 0.93mi |
| 920 Huron Ave Dayton, OH | 2.0 | 1.0 | 950 | $995 | $1.05 | 5d | 1 | 0.95mi |
| 127 Mound St Dayton, OH | 3.0 | 3.0 | 1726 | $1,600 | $0.93 | 16d | 1 | 1.04mi |
| 623 Clifton Dr Apt A Dayton, OH | 2.0 | 1.0 | 1200 | $1,200 | $1.00 | 4d | 1 | 1.06mi |
| 623 Clifton Dr Apt B Dayton, OH | 2.0 | 1.0 | 1200 | $1,174 | $0.98 | 5d | 1 | 1.06mi |
| 2240 Lakeview Ave Dayton, OH | 3.0 | 1.0 | 1056 | $1,025 | $0.97 | 45d | 1 | 1.07mi |
| 863 N Upland Ave Dayton, OH | 3.0 | 1.0 | 1042 | $1,200 | $1.15 | 45d | 1 | 1.09mi |
| 1378 Cory Dr Dayton, OH | 2.0 | 1.0 | 1300 | $975 | $0.75 | 45d | 1 | 1.09mi |
| 1816 N James H McGee Blvd Apt A Dayton, OH | 3.0 | 1.0 | 950 | $1,200 | $1.26 | 4d | 1 | 1.14mi |
| 1816 N James H McGee Blvd Unit C Dayton, OH | 3.0 | 1.0 | 950 | $1,150 | $1.21 | 4d | 1 | 1.14mi |
| 1816 N James H McGee Blvd Apt B Dayton, OH | 3.0 | 1.0 | 950 | $1,150 | $1.21 | 45d | 1 | 1.14mi |
| 119 Edgewood Ave Dayton, OH | 1.0–2.0 | 1.0 | 817 | $999 | $1.22 | 25d | 2 | 1.15mi |
| 848 Riverview Ter Apt 205 Dayton, OH | 2.0 | 1.0 | 1100 | $1,100 | $1.00 | 16d | 1 | 1.16mi |
| 848 Riverview Ter Apt 607 Dayton, OH | 2.0 | 1.0 | 1400 | $1,300 | $0.93 | 25d | 1 | 1.16mi |
| 1515 W Stewart St Dayton, OH | 2.0 | 1.0 | 925 | $1,000 | $1.08 | 45d | 1 | 1.18mi |
| 18 Holt St Unit 24 Dayton, OH | 3.0 | 2.5 | 1350 | $1,450 | $1.07 | 16d | 1 | 1.20mi |
| 3220 Princeton Dr Dayton, OH | 3.0 | 1.0 | 900 | $1,000 | $1.11 | 45d | 1 | 1.22mi |
| 905 Neal Ave Dayton, OH | 2.0 | 1.0 | 950 | $750 | $0.79 | 25d | 1 | 1.23mi |
| 905 Neal Ave Dayton, OH | 3.0 | 1.0 | 1100 | $850 | $0.77 | 45d | 1 | 1.23mi |
| 1225 Amherst Pl Dayton, OH | 3.0 | 1.0 | 1548 | $1,300 | $0.84 | 16d | 1 | 1.24mi |
| 3925 Hoover Ave Dayton, OH | 2.0 | 1.0 | 936 | $1,100 | $1.18 | 4d | 1 | 1.26mi |
| 942 Harvard Blvd Dayton, OH | 3.0 | 2.0 | 1596 | $1,200 | $0.75 | 5d | 1 | 1.27mi |
| See individual Unit addresses Dayton, OH | 1.0–2.0 | 1.0–2.0 | 928 | $2,297 | $2.48 | 45d | 10 | 1.30mi |
| 1067 Salem Ave Dayton, OH | 2.0 | 1.0 | 1100 | $900 | $0.82 | 45d | 1 | 1.31mi |
| 1067 Salem Ave Unit 3 Dayton, OH | 2.0 | 1.5 | 1100 | $900 | $0.82 | 45d | 1 | 1.31mi |
Listing history 13 events
-
2026-06-15days on market $11,500 Active 16 DOM
-
2026-06-14days on market $11,500 Active 14 DOM
-
2026-06-13days on market $11,500 Active 13 DOM
-
2026-06-10days on market $11,500 Active 11 DOM
-
2026-06-09days on market $11,500 Active 10 DOM
-
2026-06-08days on market $11,500 Active 9 DOM
-
2026-06-07days on market $11,500 Active 8 DOM
-
2026-06-05days on market $11,500 Active 5 DOM
-
2026-06-03days on market $11,500 Active 4 DOM
-
2026-06-02days on market $11,500 Active 3 DOM
-
2026-06-01days on market $11,500 Active 2 DOM
-
2026-05-31remarks 459-char remark
-
2026-05-31$11,500 Active 1 DOM
ⓘ Source: listings_history table (triggers on properties + properties_extension) + one-shot
backfill from property_details.listing_events for pre-trigger history.
Tax reassessment forecast OH · Partial reset (capped growth)
- Current annual tax
- $327 · $27/mo
- Projected year-2 tax
- $327 · $27/mo
- Expected delta
- $0/yr ($0/mo · 0.0%)
ⓘ Screening estimate from a state-policy table — verify with the county assessor before closing.
Climate risk First Street
- Flood 1/10 Low FEMA zone X (unshaded) · 0% chance over 30 yrs
- Wildfire 1/10 Low
- Heat 4/10 Moderate 7 d/yr ≥104°F today · 19 d/yr by 30 yrs out
- Wind 2/10 Low 0% chance of damaging wind over 30 yrs
- Air quality 3/10 Moderate 2 unhealthy d/yr today · 4 by 30 yrs out
Nearby sold comps map
Loading sold comps map…
Walkable amenities ~0.75 mi
Loading nearby amenities…
Taxation est. · year 1
- Rental income
- $14,212
- − Mortgage interest
- −$644
- − Property taxes
- −$327
- − Insurance
- −$58
- − Repairs & maintenance
- −$1,137
- − Management
- −$1,137
- − Depreciation
- −$335
- Taxable income
- $10,575
- Est. tax owed @ 24.0%
- −$2,538
- After-tax cash flow
- $7,581/yr
For passive investors: Depreciation is non-cash, so a rental often shows a tax loss while cash-flowing — sheltering income. Rental losses are passive: they offset passive income freely, and up to $25,000/yr can offset ordinary (W-2) income if you actively participate and your MAGI is under $100k (phasing out to $0 by $150k); unused losses carry forward. On sale, claimed depreciation is recaptured at up to 25%, and gains may owe capital-gains tax (a 1031 exchange can defer both). Figures are a year-1 estimate at your 24.0% rate — not tax advice; consult a CPA.
Schools (NCES district)
- District
- Dayton City
- NCES district ID
- 3904384
- Math proficiency
- 12% ▼ -12.00%
- Reading proficiency
- 21% ▼ -11.00%
- Median HH income
- $28,688
- Composite
- 12.94/100
- National rank
- #9579
- State rank
- #641 of 656 in OH
Livability — Dayton
- Score
- 65/100
- State rank
- #716
- US rank
- #12895
Category grades
Schools grade is shown separately in the Schools card above.
Census & demographics
- Census place
- Dayton, OH
- County
- Montgomery County · 459,541 people
- City population
- 164,387
- Metro
- Dayton-Kettering, OH
- Population (ZIP)
- 28,186
- Household income
- $36,945
- Rent vs Own
- Severe rent burden
- 1822.0
Population outlook (Montgomery County) Hauer SSP2
- Today (2025)
- 523,241 people
- By 2030
- 514,948 · -1.6%
- By 2040
- 493,378 · -5.7%
- By 2050
- 469,639 · -10.2%
- By 2075
- 418,360 · -20.0%
- By 2100
- 353,315 · -32.5%
Race, ethnicity, and origin ACS 2023
- Neighborhood character
- Predominantly Black (71%)
- Race & ethnicity
- Black 71% White 20% Two or more races 8% Hispanic / Latino 3%
- Common ancestry
- Romanian 0%
- Foreign-born
- 3% · Canada
- Languages at home
- 96% English-only · Spanish 2% French/Haitian/Cajun 1%
Political lean MEDSL · Montgomery
- 2024 margin
- Toss-up / Even · D 49.8% · R 49.3%
- 2008→2024 swing
- -5.8pp toward R · 2008: 6.2pp · 2024: 0.5pp
- All cycles
- 2024: D+0.5 2020: D+2.2 2016: R+1.2 2012: D+3.1 2008: D+6.2
Not yet ingested
- Civics
- —
Market trends
- HPI YoY
- ▼ -92.43%
- Current HPI
- 193.4175
- Rent YoY
- ▲ 4.06%
- Metro
- Dayton-Kettering, OH
- State GDP YoY
- ▲ 1.98%
- F500 in state
- 48
Industry mix (Fortune 500 HQ in OH)
| Industry | F500 HQs | Revenue |
|---|---|---|
| Insurance | 3 | $145B |
|
||
| Industrial Machinery | 3 | $49B |
|
||
| Financial Services | 3 | $24B |
|
||
| Consumer Goods | 2 | $93B |
|
||
| Aerospace / Defense | 2 | $47B |
|
||
| Utilities | 2 | $33B |
|
||
Price history
-74.7% since first listed2 events — show timeline
- 2026-05-31 Listed $11,500 FSBO.com
- 1992-01-31 Sold (Public Records) $45,500 Public Records
Property tax history
-2.3%/yrLatest (2025): $327 · +1.2% YoY. Source: county tax records.
Cash-flow waterfall
monthlySold comps — $/sqft
last 12 mo · ≤1 miLoading sold comps…