1206 S Main St · Benton, IL
Flood risk 1/10 · Minimal
- FEMA flood zone
- X (unshaded)
- Chance of flooding over 30 yrs
- 0.0%
- Est. flood insurance / yr
- $473 – $860
Fire risk 1/10 · Minimal
- Est. fire insurance / yr
- $804 – $1,492
Heat risk 4/10 · Minor
- Hot days now (above 107°F)
- 7 days/yr
- Hot days in 30 yrs
- 20 days/yr
Wind risk 2/10 · Minimal
- Chance of severe wind over 30 yrs
- 3.0%
Air-quality risk 2/10 · Minimal
- Unhealthy air days now
- 0 days/yr
- Unhealthy air days in 30 yrs
- 2 days/yr
Risk factors via First Street. Map © Google.
Why this score? — see what drove the C- grade
The composite is a weighted blend of 9 inputs, each scored 0–100. Each bar is that input's sub-score; the figure is the points it added to the 100-point composite (weight × sub-score).
- Cash flow +21.1/30.0
- ARV discount +7.5/15.0
- 1% rule +6.7/10.0
- DSCR +6.7/10.0
- Livability +3.2/5.0
- Rent growth +2.5/5.0
- Condition / age +2.5/5.0
- Schools +2.0/10.0
- Appreciation +0.0/10.0
$89,900
🖨 Deal sheet 📄 Offer letter ✓ Due diligence
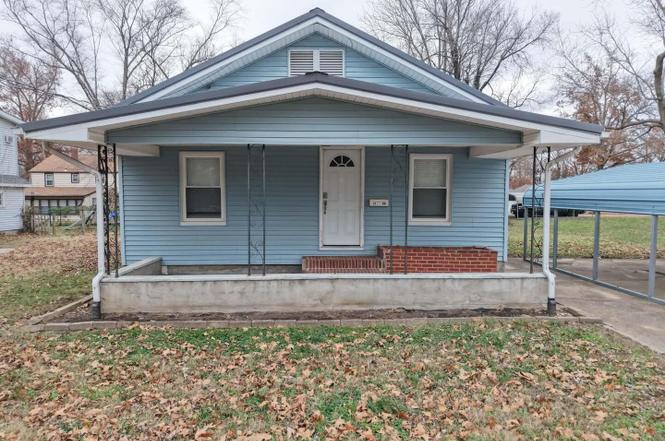
Listing remarks
Welcome to this well-kept 2 (could be 3) bedroom, 1.5 bath home featuring a 2-car carport and a fully fenced yard-perfect for kids, pets, or outdoor entertaining. Inside, you'll love the spacious layout, abundant closet space, and the overall nicely maintained condition of the home. Located just steps from Main Street in Benton, you'll enjoy convenience while still having your own comfortable space to call home. Whether you need an additional bedroom, office, or hobby room, this home offers the flexibility to fit your lifestyle.
Key facts
- 2 car carport
- Fully fenced yard
- Spacious layout
Tags
Property features AI
Exterior
- Parking: No garage; Carport
- Utilities: Public water; Public sewer
- Home design: Detached single-family home; Over 100 years old; Built before 1978
- Construction: Vinyl siding with frame construction
- Exterior features: Lot dimensions approximately 105 x 76; Lot described with 'Other' features
Interior
- Kitchen: Dishwasher; Range; Refrigerator
- Bedrooms: 2 bedrooms (both on the main level); Bedroom dimensions: 12 x 11; Primary bedroom dimensions: 11 x 10
- Flooring: Laminate flooring in kitchen and one bedroom; Carpet in primary bedroom
- Bathrooms: 1 full bathroom; 1 half bathroom
- Heating & cooling: Electric heating; Natural gas heating; Radiant heat
- Interior features: Separate dining room; Unfinished basement with egress window
Neighborhood map
What this means for you Summary
Snapshot
- This is a 2-bed/1.5-bath other listed at $90k.
Deal economics
- At list price, monthly cash flow is $129 ($2k/yr) — positive.
- The deal already cash-flows at list — no discount required.
- Meets the 1% rule at list price ($1k rent vs $90k).
- Recommended offer: $87k (3.0% below list) — sets the bar for market timing.
- Cap rate 8.0% vs local median 5.3% in Benton — top-decile yield for the area; either an underpriced asset or a hidden risk that comps aren't pricing in. Stress-test before assuming the spread holds.
Location & tenants
- Location reads 63/100 on livability (#785 in IL) — a middle-class / working-renter tenant base. Strengths: cost of living A+, housing A+, health & safety A+; Watch: amenities F, commute F, employment D-.
- BentonConsolidatedHsd 103 (town): math 20% / reading 20% proficiency, ranked #727 of 919 in IL (top 79%) — low school quality limits family demand, transient renter base, plan for 1-2y turnover.
- Zoned schools: Benton Cons High School (math 17% / reading 27%, grade F, #319 of 693 statewide, top 50%, 577 students, 0% FRL).
- Market conditions: 73 active listings in the ZIP; 17 units permitted in Franklin County in 2024 (0 in 5+ unit buildings).
Forward outlook
- Local home prices are declining (-3.0%/yr); year-one equity from $622 of loan paydown is wiped out by about $3k of value loss. Plan a longer hold.
- Franklin County population projected at -16% by 2050 — secular population decline; favor cash flow + early exit over multi-decade hold.
Negotiation context
- It's been on market 56 days — a 3% lower offer ($87k) is reasonable based on typical stale-listing flexibility.
- 7 sale attempts since 24y ago with the ask held roughly flat each time — persistent listings suggest the price (not the market) is what's stuck; bring a comps-based counter.
- Current owner paid $46k; list at $90k implies a 95% gain — meaningful room to come down on a strong offer.
Risks & watch-outs
- Watch-outs: property tax is 2.6% of price; built in 1910 — expect roof / HVAC / electrical / plumbing capex.
Questions for the listing agent
- It's been on market 56 days. Have you received any prior offers? Is the seller open to a 3% concession, seller financing, or rate buy-down credit?
- Built in 1910 — when were the roof, HVAC, electrical panel, plumbing, and water heater last replaced?
- Property tax is high relative to price — has the assessment been appealed recently, and will the sale trigger a re-assessment?
- Is there a deadline driving the sale (1031 exchange, divorce, estate, relocation)? That informs how much negotiation room exists.
- Schools are F-rated, which usually means shorter tenancies and higher turnover. Who's the typical renter profile here, and what's been the actual vacancy rate?
- What's the average days-on-market for RENTAL listings here right now (not sales)? A rising rental-DOM trend means longer vacancies and softer asking-rent achievability than the comps imply.
- What's the recent tenant-quality profile in this submarket — average credit score on applications, eviction rate, late-payment / NSF rate, and stable-employment percentage? A property-management company in the area should have these aggregated.
- How much new for-sale + rental construction is in the pipeline within 1–3 miles? Heavy new supply typically softens prices + rents 12–24 months out; constrained supply supports both.
Investment metrics
- 1% rule
- 1.17% ✓
- Cap rate
- 8.01%
- Cash-on-cash
- 6.14%
- DSCR
- 1.27
- GRM
- 7.1
CMA / ARV
No comps found within radius.
Projected returns pro-forma
-3.0% appreciation · 3.0% rent growth · sell at horizon
- IRR
- -6.8%
- Equity multiple
- 0.75×
- Total profit
- $-6,295
- Equity at exit
- $13,404
- IRR
- 2.9%
- Equity multiple
- 1.21×
- Total profit
- $5,353
- Equity at exit
- $7,773
Cash invested: $25,172 (down + closing). Projections, not guarantees.
Landlord ↔ Tenant lean methodology
- Overall (STATE)
- 43 Moderately Tenant-Leaning
- State Illinois
- 43 Moderately Tenant-Leaning · D+7
- County
- — inherits STATE
- City
- — inherits STATE
ZIP-level market 62812
- Active inventory
- 73
- Price-to-rent
- 7.1×
Monthly cashflow live
- Estimated rent
- $1,053 medium interval (Pro) →
- Mortgage (P&I)
- −$471
- Tax from tax record
- −$194 /mo · $2,327/yr
- Insurance
- −$37
- HOA
- −$0
- Vacancy / Maint / Mgmt
- −$221
- Net cashflow
- $129
Break-even live
UW: 25.0% down · 7.5% · 30yr · 1.5% tax · 5.0% vac · 8.0% maint · 8.0% mgmt
Financing live
Cash to close
- Down payment
- $22,475
- Closing costs
- $2,697
- Reserves months
- —
- Total cash needed
- —
Loan-product check · same deal, 3 products live
Conventional
25% down · 7.5% · 30yr
- Down + closing
- —
- Monthly P&I
- —
- Monthly cashflow
- —
- DSCR
- —
- Eligible?
- —
Personal DTI + credit; lowest rate.
DSCR
20% down · 8.5% · 30yr
- Down + closing
- —
- Monthly P&I
- —
- Monthly cashflow
- —
- DSCR
- —
- Eligible?
- —
No personal income docs; deal must DSCR.
Hard money
10% down · 12.0% · 12mo
- Down + closing
- —
- Monthly P&I
- —
- Monthly cashflow
- —
- DSCR
- —
- Eligible?
- —
Short-term bridge; refi at stabilization.
Listing history 19 events
-
2026-05-24$89,900 Active
-
2026-05-24$89,900 Active
-
2026-05-22$89,900 Active
-
2026-02-11soldstatus Closed
-
2026-02-11soldstatus Closed
-
2026-02-11soldstatus Closed
-
2026-01-18historical Contingent - Continue to Show
-
2026-01-06historical
-
2025-11-29Active
-
2021-08-06historical
-
2021-08-06historical
-
2012-05-15historical
-
2009-08-05soldstatus $46,000
-
2009-08-05soldstatus $46,000
-
2009-06-12$46,000
-
2009-06-12$46,000
-
2002-05-15historical
-
2002-04-15soldstatus $21,000
-
2002-02-14$25,000
ⓘ Source: listings_history table (triggers on properties + properties_extension) + one-shot
backfill from property_details.listing_events for pre-trigger history.
Tax reassessment forecast IL · Partial reset (capped growth)
- Current annual tax
- $2,327 · $194/mo
- Projected year-2 tax
- $2,327 · $194/mo
- Expected delta
- $0/yr ($0/mo · 0.0%)
ⓘ Screening estimate from a state-policy table — verify with the county assessor before closing.
Climate risk First Street
- Flood 1/10 Low FEMA zone X (unshaded) · 0% chance over 30 yrs
- Wildfire 1/10 Low
- Heat 4/10 Moderate 7 d/yr ≥107°F today · 20 d/yr by 30 yrs out
- Wind 2/10 Low 3% chance of damaging wind over 30 yrs
- Air quality 2/10 Low 0 unhealthy d/yr today · 2 by 30 yrs out
Nearby sold comps map
Loading sold comps map…
Walkable amenities ~0.75 mi
Loading nearby amenities…
Taxation est. · year 1
- Rental income
- $12,633
- − Mortgage interest
- −$5,036
- − Property taxes
- −$2,327
- − Insurance
- −$450
- − Repairs & maintenance
- −$1,011
- − Management
- −$1,011
- − Depreciation
- −$2,615
- Taxable income
- $184
- Est. tax owed @ 24.0%
- −$44
- After-tax cash flow
- $1,502/yr
For passive investors: Depreciation is non-cash, so a rental often shows a tax loss while cash-flowing — sheltering income. Rental losses are passive: they offset passive income freely, and up to $25,000/yr can offset ordinary (W-2) income if you actively participate and your MAGI is under $100k (phasing out to $0 by $150k); unused losses carry forward. On sale, claimed depreciation is recaptured at up to 25%, and gains may owe capital-gains tax (a 1031 exchange can defer both). Figures are a year-1 estimate at your 24.0% rate — not tax advice; consult a CPA.
Schools (NCES district)
- District
- BentonConsolidatedHsd 103
- NCES district ID
- 1705970
- Math proficiency
- 20% ▬ 0.00%
- Reading proficiency
- 20% ▬ 0.00%
- Median HH income
- $35,473
- Composite
- 19.77/100
- National rank
- #13902
- State rank
- #727 of 919 in IL
Livability — Benton
- Score
- 63/100
- State rank
- #785
- US rank
- #15667
Category grades
Schools grade is shown separately in the Schools card above.
Census & demographics
- Census place
- Benton, IL
- City population
- 11,441
- Population (ZIP)
- 11,441
Population outlook (Franklin County) Hauer SSP2
- Today (2025)
- 37,954 people
- By 2030
- 36,828 · -3.0%
- By 2040
- 34,452 · -9.2%
- By 2050
- 31,855 · -16.1%
- By 2075
- 25,171 · -33.7%
- By 2100
- 18,462 · -51.4%
Race, ethnicity, and origin ACS 2023
- Neighborhood character
- Predominantly White (92%)
- Race & ethnicity
- White 92% Two or more races 6% Hispanic / Latino 3%
- Common ancestry
- Slovak 2% Romanian 2% Lithuanian 1%
- Foreign-born
- 1% · Vietnam, Canada
- Languages at home
- 96% English-only · Spanish 2% Other Indo-European 1% Vietnamese 1%
Political lean MEDSL · Franklin
- 2024 margin
- Solid R (+50.6) · D 24.1% · R 74.6% · Other 1.3%
- 2008→2024 swing
- -47.8pp toward R · 2008: -2.8pp · 2024: -50.6pp
- All cycles
- 2024: R+50.6 2020: R+47.5 2016: R+45.3 2012: R+16.8 2008: R+2.8
Not yet ingested
- Civics
- —
Market trends
- HPI YoY
- ▼ -87.17%
- Current HPI
- 109.0501
- Rent YoY
- —
- Metro
- —
- State GDP YoY
- ▲ 1.59%
- F500 in state
- 60
Industry mix (Fortune 500 HQ in IL)
| Industry | F500 HQs | Revenue |
|---|---|---|
| Insurance | 4 | $201B |
|
||
| Consumer Goods | 4 | $87B |
|
||
| Industrial Machinery | 3 | $64B |
|
||
| Healthcare | 2 | $55B |
|
||
| Retail / Pharmacy | 1 | $148B |
|
||
| Agriculture / Food | 1 | $86B |
|
||
Price history
+259.6% since first listed19 events — show timeline
- 2026-05-24 Listed $89,900 MRED as Distributed by MLS Grid
- 2026-05-24 Listed $89,900 MRED as Distributed by MLS Grid
- 2026-05-22 Listed $89,900 MRED as Distributed by MLS Grid
- 2026-02-11 Sold (MLS) — MRED as Distributed by MLS Grid
- 2026-02-11 Sold (MLS) — MRED as Distributed by MLS Grid
- 2026-02-11 Sold (MLS) — MRED as Distributed by MLS Grid
- 2026-01-18 Contingent — MRED as Distributed by MLS Grid
- 2026-01-06 Listing Removed — RMLSA as Distributed by MLS Grid
- 2025-11-29 Listed — RMLSA as Distributed by MLS Grid
- 2021-08-06 Listing Removed — RMLSA as Distributed by MLS Grid
- 2021-08-06 Listing Removed — RMLSA as Distributed by MLS Grid
- 2012-05-15 Listing Removed — MRED as Distributed by MLS Grid
- 2009-08-05 Sold (MLS) $46,000 RMLSA as Distributed by MLS Grid
- 2009-08-05 Sold (MLS) $46,000 MRED as Distributed by MLS Grid
- 2009-06-12 Listed $46,000 RMLSA as Distributed by MLS Grid
- 2009-06-12 Listed $46,000 MRED as Distributed by MLS Grid
- 2002-05-15 Listing Removed — MRED as Distributed by MLS Grid
- 2002-04-15 Sold (MLS) $21,000 RMLSA as Distributed by MLS Grid
- 2002-02-14 Listed $25,000 RMLSA as Distributed by MLS Grid
Property tax history
+6.8%/yrLatest (2024): $2,327 · +5.6% YoY. Source: county tax records.
Cash-flow waterfall
monthlySold comps — $/sqft
last 12 mo · ≤1 miLoading sold comps…