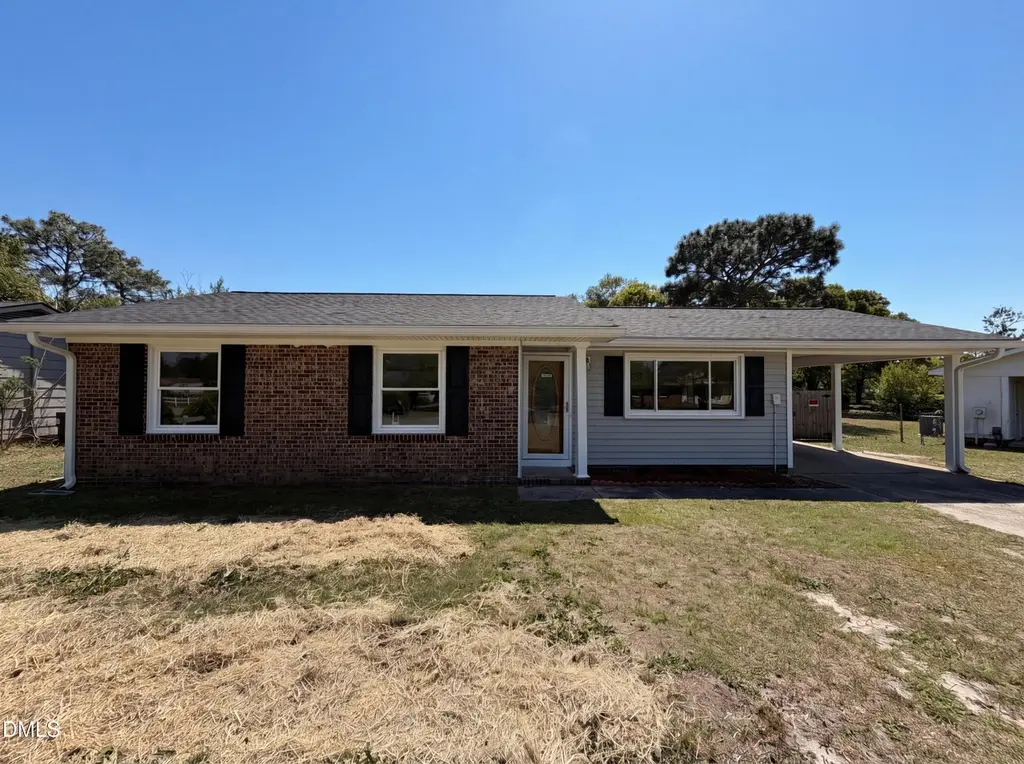
5921 Richfield Ave · Hope Mills, NC
Flood risk 1/10 · Minimal
- FEMA flood zone
- X (unshaded)
- Chance of flooding over 30 yrs
- 0.0%
- Est. flood insurance / yr
- $507 – $1,088
Fire risk 6/10 · Moderate
- Est. fire insurance / yr
- $906 – $1,684
Heat risk 7/10 · Major
- Hot days now (above 106°F)
- 7 days/yr
- Hot days in 30 yrs
- 16 days/yr
Wind risk 8/10 · Major
- Chance of severe wind over 30 yrs
- 80.0%
Air-quality risk 1/10 · Minimal
- Unhealthy air days now
- 0 days/yr
- Unhealthy air days in 30 yrs
- 0 days/yr
Risk factors via First Street. Map © Google.
Why this score? — see what drove the D grade
The composite is a weighted blend of 9 inputs, each scored 0–100. Each bar is that input's sub-score; the figure is the points it added to the 100-point composite (weight × sub-score).
- Cash flow +12.5/30.0
- ARV discount +10.8/15.0
- DSCR +3.7/10.0
- Rent growth +3.6/5.0
- 1% rule +3.4/10.0
- Livability +3.4/5.0
- Schools +3.1/10.0
- Condition / age +2.5/5.0
- Appreciation +0.0/10.0
$185,000
🖨 Deal sheet (PDF) 📄 Offer letter ✓ Due diligence
Listing remarks
Welcome to this well-maintained 3-bedroom, 1.5-bath ranch in the established Eaglewood Forest community. Situated on a level 0.24-acre lot, this charming home offers 1,119 square feet of comfortable living space with a low-maintenance brick and vinyl exterior. Inside, you'll find updated flooring and a functional layout designed for everyday living. The fenced backyard provides plenty of space for pets, play, gardening, or outdoor entertaining. Conveniently located in the Town of Hope Mills, you'll enjoy easy access to local schools, shopping, dining, and daily amenities. Served by Fayetteville PWC water and sewer and Duke Energy, this move-in-ready home is a great opportunity for first-tim
Key facts
- Level 0.24 acre lot
- 0.24 acre lot
- 3 parking spots
Tags
Property features AI
Finance
- Other: Zoning: Residential single family (10,000 sq ft lot minimum)
- HOA & community: No homeowners association
Exterior
- Parking: 1-car carport; 3 open parking spaces (4 total parking spaces)
- Utilities: Public water; Public sewer; Electric service (implied by heat pump)
- Home design: Single-family house; One story
- Construction: Brick veneer and vinyl siding exterior; Shingle roof; Slab foundation; Built as a house (living area approx. 1,066 above grade)
- Exterior features: Publicly maintained road access; 0.24-acre lot
Interior
- Bedrooms: 3 bedrooms, all on the main level
- Flooring: Combination flooring
- Bathrooms: 1 full bathroom; 1 half bathroom
- Heating & cooling: Heat pump for heating; Heat pump for cooling
- Interior features: Combination flooring
Neighborhood map
What this means for you Summary
Snapshot
- This is a 3-bed/2.0-bath single-family listed at $185k.
Deal economics
- At list price, monthly cash flow is $-26 ($-314/yr) — negative.
- To cash-flow at today's rent, offer at most $180k (2.5% below list).
- To meet the 1% rule (rent ≥ 1% of price), the offer needs to be $155k (16.4% below list).
- Recommended offer: $155k (16.4% below list) — sets the bar for 1% rule.
- Cap rate 6.1% vs local median 4.8% in Hope Mills — meaningfully above typical; check what's discounted (condition, days-on-market, listing class) to confirm the premium yield is real.
Location & tenants
- Location reads 67/100 on livability (#234 in NC) — a middle-class / working-renter tenant base. Strengths: cost of living A+, housing A+, health & safety B+; Watch: crime D-, amenities F, commute F.
- Cumberland County Schools (urban): math 32% / reading 41% proficiency, ranked #126 of 178 in NC (top 71%) — families likely to look elsewhere, expect single-tenant / working-renter base with shorter leases.
- Zoned schools: Hope Mills Middle (math 27% / reading 34%, grade F, #331 of 475 statewide, top 70%, 514 students, 99% FRL); South View High (math 60% / reading 43%, grade D+, #299 of 535 statewide, top 56%, 1,502 students, 66% FRL) — zoned schools average 83% FRL vs 55% district-wide (28 pts higher); higher-poverty schools than district average — tighter screening recommended.
- Market conditions: Rents rising fast (+4.3%/yr); 317 active listings in the ZIP; 11 comparable units currently listed for rent nearby; rentals at typical pace (median 15d on market — plan ~3-4 weeks tenant-placement turnaround); 1,125 units permitted in Cumberland County in 2024 (104 in 5+ unit buildings).
Forward outlook
- Local home prices are declining (-3.0%/yr); year-one equity from $1k of loan paydown is wiped out by about $6k of value loss. Plan a longer hold.
Negotiation context
- It's been on market 60 days — a 3% lower offer ($179k) is reasonable based on typical stale-listing flexibility.
Risks & watch-outs
- Climate carrying-cost: severe wind risk, 80% chance of damaging wind over 30y; major wildfire risk; extreme-heat days projected 7→16/yr by 2055 (HVAC capex compounding) — expect insurance premiums to compound above CPI over the hold.
Questions for the listing agent
- What do current leases actually rent for vs. the listed asking? Can we see a recent rent roll and the last 12 months of T-12 income?
- It's been on market 60 days. Have you received any prior offers? Is the seller open to a 16% concession, seller financing, or rate buy-down credit?
- Built in 1976 — when were the roof, HVAC, electrical panel, plumbing, and water heater last replaced?
- Is there a deadline driving the sale (1031 exchange, divorce, estate, relocation)? That informs how much negotiation room exists.
- Schools are D-rated, which usually means shorter tenancies and higher turnover. Who's the typical renter profile here, and what's been the actual vacancy rate?
- Crime grade is D in this area — have there been break-ins, vandalism, or insurance claims at this property in the last 3 years? What carrier currently insures it and at what premium?
- The area grade is low — what's the realistic commute time and amenity access for the typical tenant pool here? Any planned neighborhood developments (good or bad) we should know about?
- What's the average days-on-market for RENTAL listings here right now (not sales)? A rising rental-DOM trend means longer vacancies and softer asking-rent achievability than the comps imply.
- What's the recent tenant-quality profile in this submarket — average credit score on applications, eviction rate, late-payment / NSF rate, and stable-employment percentage? A property-management company in the area should have these aggregated.
- How much new for-sale + rental construction is in the pipeline within 1–3 miles? Heavy new supply typically softens prices + rents 12–24 months out; constrained supply supports both.
Investment metrics
- 1% rule
- 0.84% ✗
- Cap rate
- 6.12%
- Cash-on-cash
- -0.61%
- DSCR
- 0.97
- GRM
- 10.0
CMA / ARV
- ARV (on-the-fly)
- $199,824
- Comps found
- 12
Show comp detail 12 sales within ~0.75 mi
| Address | Dist | Beds/Ba | Sqft | Sold | Price | $/sf | Match |
|---|---|---|---|---|---|---|---|
| 5915 Spinner Rd | 0.12mi | 3/1.5 | 1,038 (-6%) | 3mo | $188,000 | $181 | 80 |
| 5983 Richfield Ave | 0.21mi | 3/1.5 | 1,056 (-4%) | 6mo | $173,000 | $164 | 76 |
| 3717 Colonial Cv | 0.20mi | 3/1.0 | 1,060 (-4%) | 6mo | $179,500 | $169 | 75 |
| 6086 Lexington Dr | 0.26mi | 3/1.5 | 1,051 (-5%) | 3mo | $160,000 | $152 | 75 |
| 3656 Metric Dr | 0.30mi | 3/1.5 | 1,056 (-4%) | 4mo | $195,000 | $185 | 74 |
| 3616 Metric Dr | 0.44mi | 3/1.5 | 1,101 (-0%) | 5mo | $182,000 | $165 | 73 |
| 5936 Fairway Dr | 0.18mi | 3/1.0 | 1,025 (-7%) | 5mo | $200,000 | $195 | 72 |
| 3660 Metric Dr | 0.29mi | 3/1.5 | 1,038 (-6%) | 8mo | $189,900 | $183 | 68 |
| 4441 Bishamon St | 0.69mi | 3/2.0 | 1,111 (+1%) | 0mo | $230,000 | $207 | 67 |
| 4322 Bridge St | 0.70mi | 3/2.0 | 1,108 (+0%) | 2mo | $205,000 | $185 | 65 |
| 3225 Glenmore St | 0.67mi | 3/1.0 | 1,099 (-0%) | 3mo | $145,000 | $132 | 62 |
| 6208 Birchbrook Dr | 0.63mi | 3/1.5 | 1,015 (-8%) | 4mo | $168,000 | $166 | 52 |
Match score weights: distance 35% · size 25% · config 20% · recency 20%. Top-matched comps best support the ARV.
Projected returns pro-forma
-3.0% appreciation · 4.28% rent growth · sell at horizon
- IRR
- -15.9%
- Equity multiple
- 0.43×
- Total profit
- $-29,624
- Equity at exit
- $27,584
- IRR
- -5.5%
- Equity multiple
- 0.62×
- Total profit
- $-19,426
- Equity at exit
- $15,995
Cash invested: $51,800 (down + closing). Projections, not guarantees.
Landlord ↔ Tenant lean methodology
- Overall (STATE)
- 85 Strongly Landlord-Friendly
- State North Carolina
- 85 Strongly Landlord-Friendly · R+3
- County
- — inherits STATE
- City
- — inherits STATE
ZIP-level market 28348
- Home prices YoY
- -14.0%
- Rents YoY
- 4.3%
- Active inventory
- 317
- Price-to-rent
- 10.0×
Monthly cashflow live
- Estimated rent
- $1,547 high interval (Pro) →
- Mortgage (P&I)
- −$970
- Tax from tax record
- −$201 /mo · $2,413/yr
- Insurance
- −$77
- HOA
- −$0
- Vacancy / Maint / Mgmt
- −$325
- Net cashflow
- $-26
Break-even live
Sensitivity live
| Price | -10% $79 | -5% $26 | +0% $-26 | +5% $-79 | +10% $-131 |
|---|---|---|---|---|---|
| Rent | -10% $-148 | -5% $-87 | +0% $-26 | +5% $35 | +10% $96 |
| Rate | -1.0pp $67 | -0.5pp $21 | base $-26 | +0.5pp $-74 | +1.0pp $-123 |
UW: 25.0% down · 7.5% · 30yr · 1.5% tax · 5.0% vac · 8.0% maint · 8.0% mgmt
Financing live
Cash to close
- Down payment
- $46,250
- Closing costs
- $5,550
- Reserves months
- —
- Total cash needed
- —
Loan-product check · same deal, 3 products live
Conventional
25% down · 7.5% · 30yr
- Down + closing
- —
- Monthly P&I
- —
- Monthly cashflow
- —
- DSCR
- —
- Eligible?
- —
Personal DTI + credit; lowest rate.
DSCR
20% down · 8.5% · 30yr
- Down + closing
- —
- Monthly P&I
- —
- Monthly cashflow
- —
- DSCR
- —
- Eligible?
- —
No personal income docs; deal must DSCR.
Hard money
10% down · 12.0% · 12mo
- Down + closing
- —
- Monthly P&I
- —
- Monthly cashflow
- —
- DSCR
- —
- Eligible?
- —
Short-term bridge; refi at stabilization.
Rent comps 11 comps
| Address | Beds | Baths | Sqft | Rent | $/sqft | DOM | Units | Dist |
|---|---|---|---|---|---|---|---|---|
| 3766 Colonial Cv Hope Mills, NC | 3.0 | 1.5 | 1475 | $1,445 | $0.98 | 14d | 1 | 0.24mi |
| 3636 Metric Dr Hope Mills, NC | 3.0 | 1.5 | 1100 | $1,400 | $1.27 | 14d | 1 | 0.37mi |
| 3506 Shipstone Pl Hope Mills, NC | 2.0 | 2.0 | 1280 | $1,380 | $1.08 | 14d | 3 | 0.49mi |
| 3511 Birchfield Ct Fayetteville, NC | 2.0–3.0 | 2.0 | 1270 | $1,685 | $1.33 | 14d | 5 | 0.79mi |
| 3462 Marty Cir Hope Mills, NC | 3.0 | 2.0 | 1120 | $1,250 | $1.12 | 24d | 1 | 0.81mi |
| 4240 High Stakes Cir Parkton, NC | 1.0–3.0 | 1.0–2.0 | 1000 | $1,625 | $1.62 | 14d | 9 | 0.98mi |
| 1514 Aristo Pl Hope Mills, NC | 2.0 | 2.0 | 1000 | $1,050 | $1.05 | 14d | 1 | 1.01mi |
| 3332 Kenmont Ln Unit E Hope Mills, NC | 2.0 | 2.5 | 1100 | $1,150 | $1.05 | 24d | 1 | 1.14mi |
| 5693A Archer Rd Hope Mills, NC | 2.0 | 1.5 | 874 | $1,100 | $1.26 | 14d | 1 | 1.18mi |
| 5715 Walkabout Rd Hope Mills, NC | 3.0 | 2.0 | 1143 | $1,675 | $1.47 | 24d | 1 | 1.21mi |
| 3916 Middle St Hope Mills, NC | 2.0 | 1.0 | 905 | $1,115 | $1.23 | 14d | 1 | 1.38mi |
Listing history 21 events
-
2026-06-18days on market $185,000 Active 60 DOM
-
2026-06-17days on market $185,000 Active 59 DOM
-
2026-06-16days on market $185,000 Active 58 DOM
-
2026-06-15remarks 699-char remark
-
2026-06-15days on market $185,000 Active 57 DOM
-
2026-06-14days on market $185,000 Active 55 DOM
-
2026-06-13pricedays on market $185,000 Active 54 DOM
-
2026-06-10days on market $188,000 Active 52 DOM
-
2026-06-09days on market $188,000 Active 51 DOM
-
2026-06-08days on market $188,000 Active 50 DOM
-
2026-06-07days on market $188,000 Active 49 DOM
-
2026-06-03days on market $188,000 Active 45 DOM
-
2026-06-02days on market $188,000 Active 44 DOM
-
2026-06-01days on market $188,000 Active 43 DOM
-
2026-05-31days on market $188,000 Active 42 DOM
-
2026-05-30days on market $188,000 Active 41 DOM
-
2026-05-20price $188,000
-
2026-04-19$194,000 Active
-
2026-04-10soldstatus $170,000
-
2021-06-24soldstatus $130,000
-
1986-09-26soldstatus $38,700
ⓘ Source: listings_history table (triggers on properties + properties_extension) + one-shot
backfill from property_details.listing_events for pre-trigger history.
Tax reassessment forecast NC · Resets to sale price
- Current annual tax
- $2,413 · $201/mo
- Projected year-2 tax
- $2,413 · $201/mo
- Expected delta
- $0/yr ($0/mo · 0.0%)
ⓘ Screening estimate from a state-policy table — verify with the county assessor before closing.
Climate risk First Street
- Flood 1/10 Low FEMA zone X (unshaded) · 0% chance over 30 yrs
- Wildfire 6/10 Major
- Heat 7/10 Severe 7 d/yr ≥106°F today · 16 d/yr by 30 yrs out
- Wind 8/10 Severe 80% chance of damaging wind over 30 yrs
- Air quality 1/10 Low 0 unhealthy d/yr today · 0 by 30 yrs out
Nearby sold comps map
Loading sold comps map…
Walkable amenities ~0.75 mi
Loading nearby amenities…
Taxation est. · year 1
- Rental income
- $18,564
- − Mortgage interest
- −$10,363
- − Property taxes
- −$2,413
- − Insurance
- −$925
- − Repairs & maintenance
- −$1,485
- − Management
- −$1,485
- − Depreciation
- −$5,382
- Taxable loss
- −$3,489
- Est. tax savings @ 24.0%
- +$837
- After-tax cash flow
- $523/yr
For passive investors: Depreciation is non-cash, so a rental often shows a tax loss while cash-flowing — sheltering income. Rental losses are passive: they offset passive income freely, and up to $25,000/yr can offset ordinary (W-2) income if you actively participate and your MAGI is under $100k (phasing out to $0 by $150k); unused losses carry forward. On sale, claimed depreciation is recaptured at up to 25%, and gains may owe capital-gains tax (a 1031 exchange can defer both). Figures are a year-1 estimate at your 24.0% rate — not tax advice; consult a CPA.
Schools (NCES district)
- District
- Cumberland County Schools
- NCES district ID
- 3700011
- Math proficiency
- 32% ▼ -2.00%
- Reading proficiency
- 41% ▼ -1.00%
- Median HH income
- $44,168
- Composite
- 31.0/100
- National rank
- #6096
- State rank
- #126 of 178 in NC
Livability — Hope Mills
- Score
- 67/100
- State rank
- #234
- US rank
- #10761
Category grades
Schools grade is shown separately in the Schools card above.
Census & demographics
- Census place
- Hope Mills, NC
- County
- Cumberland County · 265,314 people
- City population
- 39,196
- Metro
- Fayetteville, NC
- Population (ZIP)
- 39,196
- Household income
- $66,129
- Rent vs Own
- Severe rent burden
- 746.0
Population outlook (Cumberland County) Hauer SSP2
- Today (2025)
- 330,855 people
- By 2030
- 333,523 · +0.8%
- By 2040
- 335,583 · +1.4%
- By 2050
- 335,325 · +1.4%
- By 2075
- 342,853 · +3.6%
- By 2100
- 340,698 · +3.0%
Race, ethnicity, and origin ACS 2023
- Neighborhood character
- Diverse neighborhood (Simpson 0.67)
- Race & ethnicity
- White 49% Black 27% Hispanic / Latino 13% Two or more races 11% Asian 2% Native American 2%
- Hispanic origin (detail)
- Mexican 4% Puerto Rican 5%
- Common ancestry
- Romanian 2% Lithuanian 1% Serbian 1%
- Foreign-born
- 5% · Canada, South Korea, Vietnam
- Languages at home
- 90% English-only · Spanish 8% Other Indo-European 1%
Political lean MEDSL · Cumberland
- 2024 margin
- D (+13.4) · D 56.1% · R 42.7% · Other 1.2%
- 2008→2024 swing
- -4.3pp toward R · 2008: 17.7pp · 2024: 13.4pp
- All cycles
- 2024: D+13.4 2020: D+16.6 2016: D+16.0 2012: D+19.7 2008: D+17.7
Not yet ingested
- Civics
- —
Market trends
- HPI YoY
- ▼ -37.14%
- Current HPI
- 228.3122
- Rent YoY
- ▲ 4.28%
- Metro
- Fayetteville, NC
- State GDP YoY
- ▲ 3.28%
- F500 in state
- 26
Industry mix (Fortune 500 HQ in NC)
| Industry | F500 HQs | Revenue |
|---|---|---|
| Financial Services | 2 | $213B |
|
||
| Retail | 2 | $95B |
|
||
| Industrial Conglomerate | 1 | $38B |
|
||
| Metals / Steel | 1 | $35B |
|
||
| Utilities | 1 | $30B |
|
||
| Industrial Machinery | 1 | $19B |
|
||
Price history
+385.8% since first listed5 events — show timeline
- 2026-05-20 Price Changed $188,000 TMLS
- 2026-04-19 Listed $194,000 TMLS
- 2026-04-10 Sold (Public Records) $170,000 Public Records
- 2021-06-24 Sold (Public Records) $130,000 Public Records
- 1986-09-26 Sold (Public Records) $38,700 Public Records
Property tax history
+6.0%/yrLatest (2025): $2,413 · +55.6% YoY. Source: county tax records.
Cash-flow waterfall
monthlySold comps — $/sqft
last 12 mo · ≤1 miLoading sold comps…