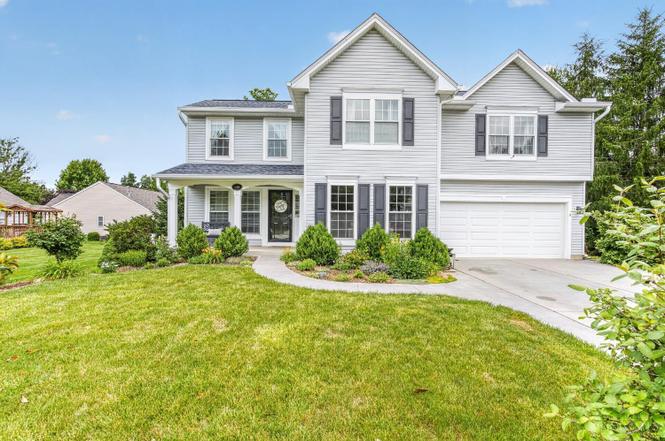
1148 Bear Grass · Maineville, OH
Flood risk 1/10 · Minimal
- FEMA flood zone
- X (unshaded)
- Chance of flooding over 30 yrs
- 0.0%
- Est. flood insurance / yr
- $473 – $860
Fire risk 1/10 · Minimal
- Est. fire insurance / yr
- $713 – $1,323
Heat risk 4/10 · Minor
- Hot days now (above 101°F)
- 7 days/yr
- Hot days in 30 yrs
- 19 days/yr
Wind risk 2/10 · Minimal
- Chance of severe wind over 30 yrs
- 1.0%
Air-quality risk 4/10 · Minor
- Unhealthy air days now
- 4 days/yr
- Unhealthy air days in 30 yrs
- 6 days/yr
Risk factors via First Street. Map © Google.
Why this score? — see what drove the D- grade
The composite is a weighted blend of 9 inputs, each scored 0–100. Each bar is that input's sub-score; the figure is the points it added to the 100-point composite (weight × sub-score).
- Appreciation +10.0/10.0
- Cash flow +6.3/30.0
- Schools +6.1/10.0
- Rent growth +4.4/5.0
- ARV discount +4.1/15.0
- Livability +3.5/5.0
- Condition / age +2.5/5.0
- 1% rule +1.3/10.0
- DSCR +0.6/10.0
$449,900
🖨 Deal sheet (PDF) 📄 Offer letter ✓ Due diligence
Listing remarks MLS
Wonderful neighborhood, on cul-de-sac, professional landscaping, nice deck off breakfast room, vaulted ceilings & ceiling fans, new carpet & new paint, insulated garage door, gas fireplace. Move in ready!
Key facts
- Large center island
- Enclosed deck
- Spacious kitchen
Tags
Property features AI
Finance
- HOA & community: HOA present (Towne Prop); Annual association fee of $810; Association amenities include play area, pool, tennis courts, and walking trails
Exterior
- Parking: Front-entry 2-car garage
- Utilities: Public water; Public sewer; Natural gas available
- Home design: Traditional single-family home; Two levels; Poured foundation
- Construction: Vinyl siding; Shingle roof
- Exterior features: Covered deck/patio; Porch; Wood fencing; Shed on property; Less than 0.5 acre lot (approximately 0.323 acres)
Interior
- Kitchen: Butler's pantry; Quartz counters; Eat-in kitchen with island; Walkout to exterior; Wood flooring in kitchen
- Bedrooms: 4 bedrooms total; Primary bedroom (20 x 13) on level 2; Bedroom 2 (13 x 13) on level 2; Bedroom 3 (15 x 11) on level 2; Bedroom 4 (13 x 11) on level 2
- Flooring: Wood floors in kitchen, dining room, living room, and foyer; Concrete floor in study and part of basement
- Bathrooms: 2 full bathrooms; 2 half bathrooms; Primary bathroom with shower and tub; Partial bath on main level; Partial bath in basement
- Heating & cooling: Central air conditioning; Forced air heating (gas); Gas water heating
- Interior features: 9-foot (and higher) ceilings; Multi-panel doors; Vaulted ceiling; Open foyer with transom/sidelights; Fireplace (gas)
- Laundry & utility: Dishwasher; Microwave; Oven/Range; Refrigerator
Neighborhood map
What this means for you Summary
Snapshot
- This is a 4-bed/2.5-bath single-family listed at $450k.
Deal economics
- At list price, monthly cash flow is $-798 ($-10k/yr) — negative.
- To cash-flow at today's rent, offer at most $309k (31.3% below list).
- To meet the 1% rule (rent ≥ 1% of price), the offer needs to be $283k (37.2% below list).
- Recommended offer: $283k (37.2% below list) — sets the bar for 1% rule.
Location & tenants
- Location reads 69/100 on livability (#529 in OH) — a middle-class / working-renter tenant base. Strengths: crime A+, employment A+, cost of living A+; Watch: amenities F, commute F, health & safety F.
- Little Miami Local (rural): math 67% / reading 70% proficiency, ranked #140 of 656 in OH (top 21%) — acceptable for families but not a draw, mixed tenant base, ~2y average lease; only 17% free/reduced lunch — higher-income household profile.
- Zoned schools: Little Miami Primary School (math 76% / reading 65%, grade A-, #376 of 1,584 statewide, top 24%, 855 students, 18% FRL); Little Miami Middle School (math 67% / reading 72%, grade A, #143 of 654 statewide, top 23%, 1,279 students, 16% FRL); Little Miami High School (math 52% / reading 81%, grade B, #150 of 781 statewide, top 20%, 1,445 students, 14% FRL) — zoned schools at 16% FRL track the district average.
- Market conditions: Rents rising fast (+7.4%/yr); 130 active listings in the ZIP; 8 comparable units currently listed for rent nearby; rentals at typical pace (median 26d on market — plan ~3-4 weeks tenant-placement turnaround); solid renter incomes; 1,224 units permitted in Warren County in 2024 (474 in 5+ unit buildings).
- This rent runs 31% of the median local income ($109k/yr) — at the standard rent-burdened threshold; future hikes will face affordability resistance.
Forward outlook
- In year one you build about $48k of equity ($3k loan paydown + $45k appreciation (10.0% local appreciation)).
- Warren County population projected at +16% by 2050 — long-run rental-demand tailwind backs the buy-and-hold thesis.
- By year 2, paydown + projected appreciation supports a ~$77k cash-out refi (75% LTV) — recoverable capital for the next deal without selling this one.
Negotiation context
- Only 11 days on market — expect competitive offers; lowballing is unlikely to land.
- 3 sale attempts since 19y ago with the ask held roughly flat each time — persistent listings suggest the price (not the market) is what's stuck; bring a comps-based counter.
- Current owner paid $188k; list at $450k implies a 139% gain — meaningful room to come down on a strong offer.
Questions for the listing agent
- What do current leases actually rent for vs. the listed asking? Can we see a recent rent roll and the last 12 months of T-12 income?
- What does the HOA fee cover, when was the last increase, and are there any pending special assessments or reserve-fund shortfalls?
- Is there a deadline driving the sale (1031 exchange, divorce, estate, relocation)? That informs how much negotiation room exists.
- Schools are A-rated — typically a magnet for longer-tenancy family renters. What's the average tenant stay here, and is there a school-zone premium baked into asking?
- The area grade is low — what's the realistic commute time and amenity access for the typical tenant pool here? Any planned neighborhood developments (good or bad) we should know about?
- What's the average days-on-market for RENTAL listings here right now (not sales)? A rising rental-DOM trend means longer vacancies and softer asking-rent achievability than the comps imply.
- What's the recent tenant-quality profile in this submarket — average credit score on applications, eviction rate, late-payment / NSF rate, and stable-employment percentage? A property-management company in the area should have these aggregated.
- How much new for-sale + rental construction is in the pipeline within 1–3 miles? Heavy new supply typically softens prices + rents 12–24 months out; constrained supply supports both.
Investment metrics
- 1% rule
- 0.63% ✗
- Cap rate
- 4.17%
- Cash-on-cash
- -7.60%
- DSCR
- 0.66
- GRM
- 13.3
CMA / ARV
- ARV (on-the-fly)
- $417,908
- Comps found
- 12
Show comp detail 12 sales within ~0.75 mi
| Address | Dist | Beds/Ba | Sqft | Sold | Price | $/sf | Match |
|---|---|---|---|---|---|---|---|
| 7710 Crystal Cove Pointe | 0.31mi | 3/3.0 (-1) | 2,198 (+0%) | 7mo | $390,000 | $177 | 72 |
| 1200 Carrington Pl | 0.27mi | 4/2.5 | 2,480 (+13%) | 1mo | $378,000 | $152 | 64 |
| 1123 Carrington Pl | 0.23mi | 4/2.5 | 2,496 (+14%) | 2mo | $465,000 | $186 | 64 |
| 845 Village Green Pkwy | 0.41mi | 3/3.0 (-1) | 2,344 (+7%) | 4mo | $375,000 | $160 | 58 |
| 6595 Thistle Grv | 0.72mi | 4/3.0 | 2,232 (+2%) | 4mo | $412,000 | $185 | 58 |
| 1627 Down Ct | 0.66mi | 3/2.5 (-1) | 2,100 (-4%) | 1mo | $399,900 | $190 | 57 |
| 1440 Eagle Blvd | 0.55mi | 4/2.5 | 2,000 (-9%) | 4mo | $405,000 | $203 | 56 |
| 7143 Birkdale Dr | 0.45mi | 3/2.0 (-1) | 2,005 (-8%) | 5mo | $475,000 | $237 | 54 |
| 7845 Horizon Bnd | 0.73mi | 4/2.5 | 2,416 (+10%) | 1mo | $460,489 | $191 | 48 |
| 7783 Crystal Cove Pointe | 0.38mi | 3/3.0 (-1) | 1,917 (-12%) | 9mo | $455,000 | $237 | 47 |
| 8016 Acorn Trl | 0.74mi | 5/3.0 (+1) | 2,343 (+7%) | 5mo | $499,000 | $213 | 43 |
| 7736 Habbin Dr | 0.71mi | 3/3.5 (-1) | 1,902 (-13%) | 9mo | $400,000 | $210 | 28 |
Match score weights: distance 35% · size 25% · config 20% · recency 20%. Top-matched comps best support the ARV.
Projected returns pro-forma
10.0% appreciation · 7.42% rent growth · sell at horizon
- IRR
- 20.0%
- Equity multiple
- 2.65×
- Total profit
- $207,340
- Equity at exit
- $405,306
- IRR
- 19.2%
- Equity multiple
- 6.42×
- Total profit
- $682,317
- Equity at exit
- $874,057
Cash invested: $125,972 (down + closing). Projections, not guarantees.
Landlord ↔ Tenant lean methodology
- Overall (STATE)
- 73 Landlord-Friendly
- State Ohio
- 73 Landlord-Friendly · R+6
- County
- — inherits STATE
- City
- — inherits STATE
ZIP-level market 45039
- Home prices YoY
- 7.3%
- Rents YoY
- 7.4%
- Active inventory
- 130
- Price-to-rent
- 13.3×
Monthly cashflow live
- Estimated rent
- $2,826 high interval (Pro) →
- Mortgage (P&I)
- −$2,359
- Tax from tax record
- −$415 /mo · $4,983/yr
- Insurance
- −$187
- HOA
- −$68
- Vacancy / Maint / Mgmt
- −$593
- Net cashflow
- $-798
Break-even live
Sensitivity live
| Price | -10% $-543 | -5% $-670 | +0% $-798 | +5% $-925 | +10% $-1,052 |
|---|---|---|---|---|---|
| Rent | -10% $-1,021 | -5% $-909 | +0% $-798 | +5% $-686 | +10% $-574 |
| Rate | -1.0pp $-571 | -0.5pp $-683 | base $-798 | +0.5pp $-914 | +1.0pp $-1,033 |
UW: 25.0% down · 7.5% · 30yr · 1.5% tax · 5.0% vac · 8.0% maint · 8.0% mgmt
Financing live
Cash to close
- Down payment
- $112,475
- Closing costs
- $13,497
- Reserves months
- —
- Total cash needed
- —
Loan-product check · same deal, 3 products live
Conventional
25% down · 7.5% · 30yr
- Down + closing
- —
- Monthly P&I
- —
- Monthly cashflow
- —
- DSCR
- —
- Eligible?
- —
Personal DTI + credit; lowest rate.
DSCR
20% down · 8.5% · 30yr
- Down + closing
- —
- Monthly P&I
- —
- Monthly cashflow
- —
- DSCR
- —
- Eligible?
- —
No personal income docs; deal must DSCR.
Hard money
10% down · 12.0% · 12mo
- Down + closing
- —
- Monthly P&I
- —
- Monthly cashflow
- —
- DSCR
- —
- Eligible?
- —
Short-term bridge; refi at stabilization.
Rent comps 8 comps
| Address | Beds | Baths | Sqft | Rent | $/sqft | DOM | Units | Dist |
|---|---|---|---|---|---|---|---|---|
| 1256 Carrington Pl Maineville, OH | 4.0 | 2.5 | 3000 | $2,521 | $0.84 | 25d | 1 | 0.32mi |
| 7814 Wilderness Way Maineville, OH | 4.0 | 2.0 | 2140 | $2,671 | $1.25 | 45d | 1 | 0.47mi |
| 903 Pineneedle Pl Maineville, OH | 4.0 | 2.5 | 1848 | $2,231 | $1.21 | 45d | 1 | 0.51mi |
| 6976 Briarcliff Ct Maineville, OH | 4.0 | 3.0 | 2475 | $3,595 | $1.45 | 18d | 1 | 0.65mi |
| 1624 Rosemore Ln Morrow, OH | 3.0 | 2.5 | 1900 | $2,601 | $1.37 | 14d | 1 | 0.66mi |
| 7831 Healy Dr Maineville, OH | 3.0 | 2.5 | 2084 | $2,671 | $1.28 | 45d | 1 | 0.80mi |
| 330 Heftner Cir Maineville, OH | 3.0 | 2.5 | 1588 | $2,056 | $1.29 | 9d | 1 | 0.96mi |
| 311 Heftner Cir Maineville, OH | 3.0 | 2.5 | 1442 | $2,200 | $1.53 | 14d | 1 | 1.00mi |
HOA detail
- Monthly dues
- $68 · $816/yr
- Likely covers
- gaslandscaping
Listing history 7 events
-
2026-06-21days on market $449,900 Active 11 DOM
-
2026-06-18days on market $449,900 Active 8 DOM
-
2026-06-17days on market $449,900 Active 7 DOM
-
2026-06-16days on market $449,900 Active 6 DOM
-
2026-06-15days on market $449,900 Active 5 DOM
-
2026-06-13remarks 699-char remark
-
2026-06-13$449,900 Active 3 DOM
ⓘ Source: listings_history table (triggers on properties + properties_extension) + one-shot
backfill from property_details.listing_events for pre-trigger history.
Tax reassessment forecast OH · Partial reset (capped growth)
- Current annual tax
- $4,983 · $415/mo
- Projected year-2 tax
- $6,001 · $500/mo
- Expected delta
- +$1,018/yr (+$85/mo · 20.4%)
ⓘ Screening estimate from a state-policy table — verify with the county assessor before closing.
Climate risk First Street
- Flood 1/10 Low FEMA zone X (unshaded) · 0% chance over 30 yrs
- Wildfire 1/10 Low
- Heat 4/10 Moderate 7 d/yr ≥101°F today · 19 d/yr by 30 yrs out
- Wind 2/10 Low 100% chance of damaging wind over 30 yrs
- Air quality 4/10 Moderate 4 unhealthy d/yr today · 6 by 30 yrs out
Nearby sold comps map
Loading sold comps map…
Walkable amenities ~0.75 mi
Loading nearby amenities…
Taxation est. · year 1
- Rental income
- $33,909
- − Mortgage interest
- −$25,201
- − Property taxes
- −$4,983
- − Insurance
- −$2,250
- − Repairs & maintenance
- −$2,713
- − Management
- −$2,713
- − HOA
- −$816
- − Depreciation
- −$13,088
- Taxable loss
- −$17,855
- Est. tax savings @ 24.0%
- +$4,285
- After-tax cash flow
- $-5,287/yr
For passive investors: Depreciation is non-cash, so a rental often shows a tax loss while cash-flowing — sheltering income. Rental losses are passive: they offset passive income freely, and up to $25,000/yr can offset ordinary (W-2) income if you actively participate and your MAGI is under $100k (phasing out to $0 by $150k); unused losses carry forward. On sale, claimed depreciation is recaptured at up to 25%, and gains may owe capital-gains tax (a 1031 exchange can defer both). Figures are a year-1 estimate at your 24.0% rate — not tax advice; consult a CPA.
Schools (NCES district)
- District
- Little Miami Local
- NCES district ID
- 3905044
- Math proficiency
- 67% ▼ -11.00%
- Reading proficiency
- 70% ▼ -6.00%
- Median HH income
- $74,949
- Composite
- 60.5/100
- National rank
- #844
- State rank
- #140 of 656 in OH
Livability — Maineville
- Score
- 69/100
- State rank
- #529
- US rank
- #9001
Category grades
Schools grade is shown separately in the Schools card above.
Census & demographics
- County
- Warren County · 196,906 people
- Metro
- Cincinnati, OH-KY-IN
- Population (ZIP)
- 28,335
- Household income
- $108,794
- Rent vs Own
- Severe rent burden
- 307.0
Population outlook (Warren County) Hauer SSP2
- Today (2025)
- 248,603 people
- By 2030
- 259,345 · +4.3%
- By 2040
- 277,666 · +11.7%
- By 2050
- 289,599 · +16.5%
- By 2075
- 311,681 · +25.4%
- By 2100
- 302,738 · +21.8%
Race, ethnicity, and origin ACS 2023
- Neighborhood character
- Predominantly White (88%)
- Race & ethnicity
- White 88% Hispanic / Latino 5% Two or more races 5% Asian 3% Black 2%
- Common ancestry
- Romanian 2% Scotch-Irish 2% Lithuanian 2%
- Foreign-born
- 8% · Canada, Jamaica
- Languages at home
- 92% English-only · Spanish 3% Russian/Polish/Slavic 2% Other Indo-European 1%
Political lean MEDSL · Warren
- 2024 margin
- Solid R (+31.5) · D 33.8% · R 65.3%
- 2008→2024 swing
- +4.5pp toward D · 2008: -36.1pp · 2024: -31.5pp
- All cycles
- 2024: R+31.5 2020: R+30.8 2016: R+37.6 2012: R+39.5 2008: R+36.1
Not yet ingested
- Civics
- —
Market trends
- HPI YoY
- ▲ 38.63%
- Current HPI
- 568.09
- Rent YoY
- ▲ 7.42%
- Metro
- Cincinnati, OH-KY-IN
- State GDP YoY
- ▲ 1.98%
- F500 in state
- 48
Industry mix (Fortune 500 HQ in OH)
| Industry | F500 HQs | Revenue |
|---|---|---|
| Insurance | 3 | $145B |
|
||
| Industrial Machinery | 3 | $49B |
|
||
| Financial Services | 3 | $24B |
|
||
| Consumer Goods | 2 | $93B |
|
||
| Aerospace / Defense | 2 | $47B |
|
||
| Utilities | 2 | $33B |
|
||
Price history
+249.1% since first listed8 events — show timeline
- 2026-06-10 Listed $449,900 Cincy MLS
- 2013-08-09 Sold (Public Records) $188,000 Public Records
- 2013-07-23 Sold (MLS) $188,000 Cincy MLS
- 2013-05-20 Listed $195,000 Cincy MLS
- 2007-07-12 Sold (Public Records) $195,000 Public Records
- 2007-06-29 Sold (MLS) $195,000 Cincy MLS
- 2007-03-20 Listed $204,901 Cincy MLS
- 1998-10-07 Sold (Public Records) $128,866 Public Records
Property tax history
+2.4%/yrLatest (2025): $4,983 · -0.0% YoY. Source: county tax records.
Cash-flow waterfall
monthlySold comps — $/sqft
last 12 mo · ≤1 miLoading sold comps…