11596 W Sierra Dawn Blvd #277 · Surprise, AZ
Flood risk 1/10 · Minimal
- FEMA flood zone
- X (shaded)
- Chance of flooding over 30 yrs
- 0.0%
- Est. flood insurance / yr
- $507 – $1,088
Fire risk 3/10 · Minor
- Est. fire insurance / yr
- $610 – $1,132
Heat risk 9/10 · Severe
- Hot days now (above 114°F)
- 7 days/yr
- Hot days in 30 yrs
- 16 days/yr
Wind risk 1/10 · Minimal
- Chance of severe wind over 30 yrs
- —
Air-quality risk 2/10 · Minimal
- Unhealthy air days now
- 1 days/yr
- Unhealthy air days in 30 yrs
- 1 days/yr
Risk factors via First Street. Map © Google.
Why this score? — see what drove the A- grade
The composite is a weighted blend of 9 inputs, each scored 0–100. Each bar is that input's sub-score; the figure is the points it added to the 100-point composite (weight × sub-score).
- Cash flow +30.0/30.0
- ARV discount +13.7/15.0
- 1% rule +10.0/10.0
- DSCR +10.0/10.0
- Appreciation +5.1/10.0
- Condition / age +3.8/5.0
- Livability +3.7/5.0
- Schools +3.3/10.0
- Rent growth +1.1/5.0
$69,000
🖨 Deal sheet 📄 Offer letter ✓ Due diligence
Listing remarks MLS
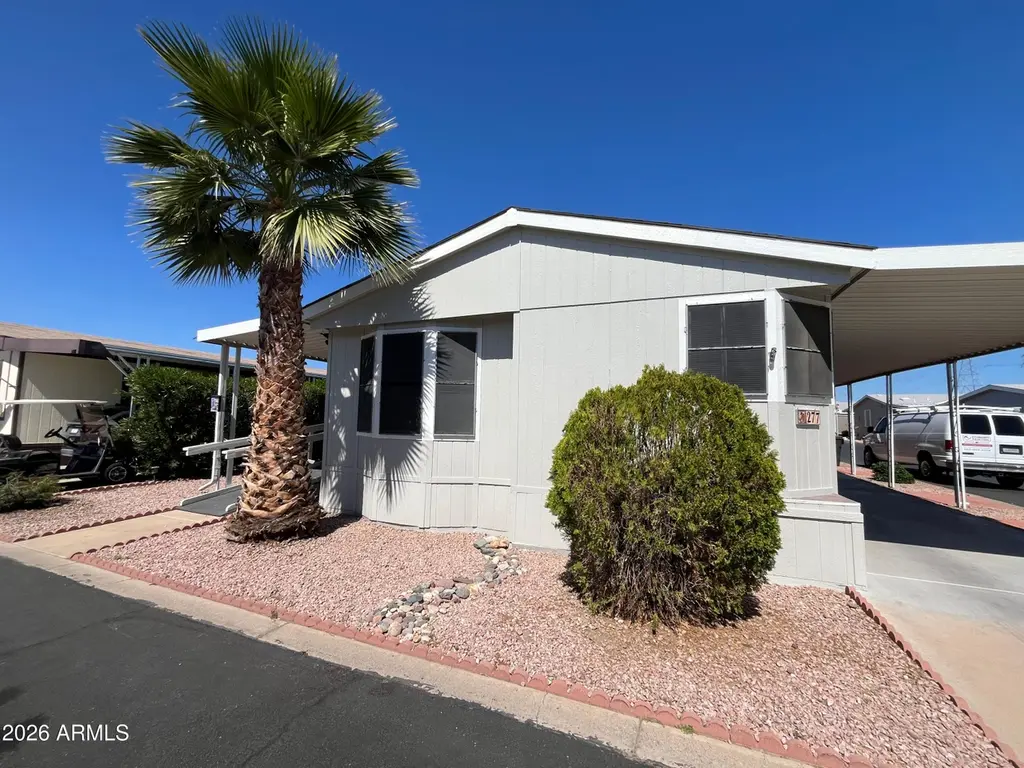
This Spacious 2Bed 2Bath+Den/Office Has been Freshly Painted Inside and out! with a GREAT floor plan that sits on a corner lot. With a screened in Patio to enjoy morning coffee or quiet evenings. This Cozy retreat Is located In the ACTIVE, GATED 55+Community of Rose Garden.Surrounded by restaurants, hiking, golf courses, and close to shopping! With 2 Large Dog Parks, Pickle Ball, Workout Facility, Swimming Pool/Heated, and much much more!!
Key facts
- Gated community
- Dog parks
- Pickle ball
Tags
Neighborhood map
What this means for you Summary
Snapshot
- This is a 2-bed/2.0-bath manufactured listed at $69k. Condition is rated good.
Deal economics
- At list price, monthly cash flow is $942 ($11k/yr) — positive.
- The deal already cash-flows at list — no discount required.
- Meets the 1% rule at list price ($2k rent vs $69k).
- Recommended offer: $63k (9.0% below list) — sets the bar for market timing.
- Cap rate 22.7% vs local median 3.3% in Surprise — top-decile yield for the area; either an underpriced asset or a hidden risk that comps aren't pricing in. Stress-test before assuming the spread holds.
Location & tenants
- Location reads 74/100 on livability (#19 in AZ, #4,616 nationally) — a middle-class / working-renter tenant base. Strengths: crime A+, housing A+, employment A-; Watch: health & safety D+, amenities D-, commute F.
- Dysart Unified District (4243) (suburban): math 34% / reading 40% proficiency, ranked #73 of 249 in AZ (top 29%) — families likely to look elsewhere, expect single-tenant / working-renter base with shorter leases.
- Market conditions: Rents falling (-5.5%/yr); 76 active listings in the ZIP; 21 comparable units currently listed for rent nearby; rentals at typical pace (median 17d on market — plan ~3-4 weeks tenant-placement turnaround); 36,011 units permitted in Maricopa County in 2024 (12,801 in 5+ unit buildings).
- This rent runs 38% of the median local income ($56k/yr) — at the standard rent-burdened threshold; future hikes will face affordability resistance.
Forward outlook
- In year one you build about $599 of equity ($477 loan paydown + $122 appreciation (0.2% local appreciation)).
- Maricopa County population projected at +38% by 2050 — long-run rental-demand tailwind backs the buy-and-hold thesis.
- At projected returns (0.2% appreciation + 0.0% rent growth), your $19k cash investment doubles in ~2 years — after that, you're playing with house money.
Negotiation context
- It's been on market 99 days — a 9% lower offer ($63k) is reasonable based on typical stale-listing flexibility.
- 2 sale attempts since 5y ago; this cycle's ask has dropped $4k (5%) from the opening price — seller is motivated, your offer sets the floor, not the list.
Risks & watch-outs
- Climate carrying-cost: extreme-heat days projected 7→16/yr by 2055 (HVAC capex compounding) — expect insurance premiums to compound above CPI over the hold.
Questions for the listing agent
- It's been on market 99 days. Have you received any prior offers? Is the seller open to a 9% concession, seller financing, or rate buy-down credit?
- Why hasn't it sold? Are there any deal-killer items the seller is aware of (foundation, flood, title, zoning, code violations)?
- Is there a deadline driving the sale (1031 exchange, divorce, estate, relocation)? That informs how much negotiation room exists.
- What's the average days-on-market for RENTAL listings here right now (not sales)? A rising rental-DOM trend means longer vacancies and softer asking-rent achievability than the comps imply.
- What's the recent tenant-quality profile in this submarket — average credit score on applications, eviction rate, late-payment / NSF rate, and stable-employment percentage? A property-management company in the area should have these aggregated.
- How much new for-sale + rental construction is in the pipeline within 1–3 miles? Heavy new supply typically softens prices + rents 12–24 months out; constrained supply supports both.
Investment metrics
- 1% rule
- 2.60% ✓
- Cap rate
- 22.68%
- Cash-on-cash
- 58.52%
- DSCR
- 3.60
- GRM
- 3.2
CMA / ARV
- ARV (median comp)
- $79,995
- List price
- $69,000
- Delta
- -13.74%
- Verdict
- UNDERPRICED
- Comps
- 20 within 1.0 mi
Show comp detail 12 sales within ~0.75 mi
| Address | Dist | Beds/Ba | Sqft | Sold | Price | $/sf | Match |
|---|---|---|---|---|---|---|---|
| 11596 W Sierra Dawn Blvd #165 | 0.00mi | 2/2.0 | 1,296 (-7%) | 1mo | $94,500 | $73 | 88 |
| 11596 W Sierra Dawn Blvd #188 | 0.11mi | 2/2.0 | 1,456 (+5%) | 2mo | $80,000 | $55 | 86 |
| 11596 W Sierra Dawn Blvd #33 | 0.10mi | 3/2.0 (+1) | 1,344 (-3%) | 4mo | $112,000 | $83 | 81 |
| 11596 W Sierra Dawn Blvd #182 | 0.10mi | 2/2.0 | 1,456 (+5%) | 9mo | $70,000 | $48 | 80 |
| 11596 W Sierra Dawn Blvd #25 | 0.10mi | 3/2.0 (+1) | 1,320 (-5%) | 2mo | $92,000 | $70 | 80 |
| 11596 W Sierra Dawn Blvd #134 | 0.10mi | 3/2.0 (+1) | 1,352 (-3%) | 9mo | $75,000 | $55 | 78 |
| 11596 W Sierra Dawn Blvd #80 | 0.10mi | 2/2.0 | 1,536 (+10%) | 1mo | $120,000 | $78 | 77 |
| 11596 W Sierra Dawn Blvd #29 | 0.11mi | 2/2.0 | 1,534 (+10%) | 5mo | $73,500 | $48 | 74 |
| 11596 W Sierra Dawn Blvd #271 | 0.23mi | 3/2.0 (+1) | 1,456 (+5%) | 8mo | $74,000 | $51 | 70 |
| 11596 W Sierra Dawn Blvd #99 | 0.10mi | 2/2.0 | 1,228 (-12%) | 10mo | $118,000 | $96 | 68 |
| 11596 W Sierra Dawn Blvd #243 | 0.10mi | 2/2.0 | 1,203 (-14%) | 7mo | $135,000 | $112 | 67 |
| 16101 N EL Mirage Rd #371 | 0.69mi | 3/2.0 (+1) | 1,344 (-3%) | 0mo | $64,000 | $48 | 57 |
Match score weights: distance 35% · size 25% · config 20% · recency 20%. Top-matched comps best support the ARV.
Projected returns pro-forma
0.18% appreciation · 0.0% rent growth · sell at horizon
- IRR
- 57.3%
- Equity multiple
- 3.76×
- Total profit
- $53,324
- Equity at exit
- $20,648
- IRR
- 58.3%
- Equity multiple
- 6.86×
- Total profit
- $113,172
- Equity at exit
- $25,314
Cash invested: $19,320 (down + closing). Projections, not guarantees.
Landlord ↔ Tenant lean methodology
- Overall (STATE)
- 87 Strongly Landlord-Friendly
- State Arizona
- 87 Strongly Landlord-Friendly · R+3
- County
- — inherits STATE
- City
- — inherits STATE
ZIP-level market 85378
- Home prices YoY
- 0.1%
- Rents YoY
- -5.5%
- Active inventory
- 76
- Price-to-rent
- 3.2×
Monthly cashflow live
- Estimated rent
- $1,796 high interval (Pro) →
- Mortgage (P&I)
- −$362
- Tax est. 1.5%
- −$86 /mo · $1,035/yr
- Insurance
- −$29
- HOA
- −$0
- Vacancy / Maint / Mgmt
- −$377
- Net cashflow
- $942
Break-even live
UW: 25.0% down · 7.5% · 30yr · 1.5% tax · 5.0% vac · 8.0% maint · 8.0% mgmt
Financing live
Cash to close
- Down payment
- $17,250
- Closing costs
- $2,070
- Reserves months
- —
- Total cash needed
- —
Loan-product check · same deal, 3 products live
Conventional
25% down · 7.5% · 30yr
- Down + closing
- —
- Monthly P&I
- —
- Monthly cashflow
- —
- DSCR
- —
- Eligible?
- —
Personal DTI + credit; lowest rate.
DSCR
20% down · 8.5% · 30yr
- Down + closing
- —
- Monthly P&I
- —
- Monthly cashflow
- —
- DSCR
- —
- Eligible?
- —
No personal income docs; deal must DSCR.
Hard money
10% down · 12.0% · 12mo
- Down + closing
- —
- Monthly P&I
- —
- Monthly cashflow
- —
- DSCR
- —
- Eligible?
- —
Short-term bridge; refi at stabilization.
Rent comps 21 comps
| Address | Beds | Baths | Sqft | Rent | $/sqft | DOM | Units | Dist |
|---|---|---|---|---|---|---|---|---|
| 11417 W Amber Trl Surprise, AZ | 3.0 | 2.0 | 1130 | $1,750 | $1.55 | 5d | 1 | 0.29mi |
| 11345 W Loma Blanca Dr Surprise, AZ | 3.0 | 2.0 | 1368 | $1,930 | $1.41 | 43d | 1 | 0.32mi |
| 17447 Avenue of the Arts Unit 2 Surprise, AZ | 2.0 | 2.0 | 1078 | $1,732 | $1.61 | 24d | 1 | 0.66mi |
| 17447 Avenue of the Arts Unit 3 Surprise, AZ | 3.0 | 2.0 | 1183 | $1,822 | $1.54 | 24d | 1 | 0.66mi |
| 17447 N Avenue of the Arts Surprise, AZ | 2.0 | 2.0 | 1078 | $1,813 | $1.68 | 12d | 1 | 0.73mi |
| 17447 N Avenue of the Arts Surprise, AZ | 3.0 | 2.0 | 1183 | $1,981 | $1.67 | 1d | 1 | 0.73mi |
| 17590 N 114th Ln Surprise, AZ | 3.0 | 3.0 | 1737 | $1,695 | $0.98 | 5d | 1 | 0.75mi |
| 17590 N 114th Ln Surprise, AZ | 3.0 | 2.5 | 1737 | $1,695 | $0.98 | 24d | 1 | 0.75mi |
| 12121 W Ironwood St El Mirage, AZ | 3.0 | 2.0 | 1680 | $1,999 | $1.19 | 24d | 1 | 0.80mi |
| 12134 W Ironwood St El Mirage, AZ | 3.0 | 2.0 | 1680 | $1,950 | $1.16 | 24d | 1 | 0.81mi |
| 15620 N El Mirage Rd Surprise, AZ | 3.0 | 2.5 | 1310 | $1,599 | $1.22 | 24d | 2 | 1.03mi |
| 16629 N Greasewood St Surprise, AZ | 2.0 | 1.5 | 1052 | $1,462 | $1.39 | 2d | 3 | 1.06mi |
| 15427 N Jerry St Surprise, AZ | 2.0 | 1.5 | 920 | $1,450 | $1.58 | 5d | 1 | 1.12mi |
| 16520 N Greasewood St Surprise, AZ | 2.0–3.0 | 2.5 | 1267 | $1,695 | $1.34 | 2d | 17 | 1.16mi |
| 11476 W Madisen Ellise Dr Surprise, AZ | 3.0 | 2.0 | 1301 | $2,070 | $1.59 | 43d | 1 | 1.16mi |
| 10831 W Tropicana Cir Sun City, AZ | 2.0 | 1.0 | 995 | $2,800 | $2.81 | 20d | 1 | 1.32mi |
| 10814 W El Capitan Cir Sun City, AZ | 2.0 | 1.0 | 995 | $3,000 | $3.02 | 15d | 1 | 1.36mi |
| 11755 W Thompson Ranch Rd El Mirage, AZ | 1.0–3.0 | 1.0–2.0 | 936 | $2,017 | $2.15 | 1d | 1 | 1.40mi |
| 12817 W Cottonwood St Surprise, AZ | 2.0 | 1.0 | 1795 | $1,300 | $0.72 | 3d | 1 | 1.48mi |
| 12438 W Hearn Rd El Mirage, AZ | 3.0 | 2.0 | 1308 | $1,595 | $1.22 | 24d | 1 | 1.49mi |
| 12437 W Via Camille El Mirage, AZ | 3.0 | 2.0 | 1534 | $1,875 | $1.22 | 16d | 1 | 1.50mi |
Listing history 18 events
-
2026-06-18days on market $69,000 Active 99 DOM
-
2026-06-17days on market $69,000 Active 98 DOM
-
2026-06-16days on market $69,000 Active 97 DOM
-
2026-06-15days on market $69,000 Active 96 DOM
-
2026-06-13days on market $69,000 Active 94 DOM
-
2026-06-09days on market $69,000 Active 90 DOM
-
2026-06-08days on market $69,000 Active 89 DOM
-
2026-06-07days on market $69,000 Active 88 DOM
-
2026-06-04days on market $69,000 Active 85 DOM
-
2026-06-03days on market $69,000 Active 84 DOM
-
2026-06-02days on market $69,000 Active 83 DOM
-
2026-06-01days on market $69,000 Active 82 DOM
-
2026-05-31days on market $69,000 Active 81 DOM
-
2026-05-09price $69,000 444-char remark
Show marketing remark (444 chars)
This Spacious 2Bed 2Bath+Den/Office Has been Freshly Painted Inside and out! with a GREAT floor plan that sits on a corner lot. With a screened in Patio to enjoy morning coffee or quiet evenings. This Cozy retreat Is located In the ACTIVE, GATED 55+Community of Rose Garden.Surrounded by restaurants, hiking, golf courses, and close to shopping! With 2 Large Dog Parks, Pickle Ball, Workout Facility, Swimming Pool/Heated, and much much more!!
-
2026-03-10$73,000 Active 444-char remark
Show marketing remark (444 chars)
This Spacious 2Bed 2Bath+Den/Office Has been Freshly Painted Inside and out! with a GREAT floor plan that sits on a corner lot. With a screened in Patio to enjoy morning coffee or quiet evenings. This Cozy retreat Is located In the ACTIVE, GATED 55+Community of Rose Garden.Surrounded by restaurants, hiking, golf courses, and close to shopping! With 2 Large Dog Parks, Pickle Ball, Workout Facility, Swimming Pool/Heated, and much much more!!
-
2021-04-28historical
-
2021-03-30price $72,000
-
2021-01-28$73,500 Active
ⓘ Source: listings_history table (triggers on properties + properties_extension) + one-shot
backfill from property_details.listing_events for pre-trigger history.
Climate risk First Street
- Flood 1/10 Low FEMA zone X (shaded) · 0% chance over 30 yrs
- Wildfire 3/10 Moderate
- Heat 9/10 Extreme 7 d/yr ≥114°F today · 16 d/yr by 30 yrs out
- Wind 1/10 Low
- Air quality 2/10 Low 1 unhealthy d/yr today · 1 by 30 yrs out
Nearby sold comps map
Loading sold comps map…
Walkable amenities ~0.75 mi
Loading nearby amenities…
Taxation est. · year 1
- Rental income
- $21,554
- − Mortgage interest
- −$3,865
- − Property taxes
- −$1,035
- − Insurance
- −$345
- − Repairs & maintenance
- −$1,724
- − Management
- −$1,724
- − Depreciation
- −$2,007
- Taxable income
- $10,853
- Est. tax owed @ 24.0%
- −$2,605
- After-tax cash flow
- $8,701/yr
For passive investors: Depreciation is non-cash, so a rental often shows a tax loss while cash-flowing — sheltering income. Rental losses are passive: they offset passive income freely, and up to $25,000/yr can offset ordinary (W-2) income if you actively participate and your MAGI is under $100k (phasing out to $0 by $150k); unused losses carry forward. On sale, claimed depreciation is recaptured at up to 25%, and gains may owe capital-gains tax (a 1031 exchange can defer both). Figures are a year-1 estimate at your 24.0% rate — not tax advice; consult a CPA.
Condition & rehab AI · 1 photo
This well-maintained 2-bedroom, 2-bathroom manufactured home is located in a gated community with excellent amenities. Fresh painting and landscaping improvements can further enhance its appeal.
Value-add opportunities
- Both Painting the exterior and interior — Fresh painting enhances curb appeal and interior aesthetics, attracting more buyers and renters.
- Both Landscaping improvements — Enhancing the landscaping can improve the home's curb appeal and attract more potential buyers and renters.
- Both HVAC maintenance — Regular HVAC maintenance ensures the system runs efficiently, reducing energy costs and attracting more buyers and renters.
- Both Interior updates — Updating the interior with new fixtures and decor can make the home more appealing and attract more buyers and renters.
- Both Exterior updates — Updating the exterior with new siding or a fresh coat of paint can significantly enhance the home's curb appeal and attract more buyers and renters.
Renovation cost estimate screening
Value-add ROI direction
- Both Painting the exterior and interior — Fresh painting enhances curb appeal and interior aesthetics, attracting more buyers and renters. ↑
- Both Landscaping improvements — Enhancing the landscaping can improve the home's curb appeal and attract more potential buyers and renters. ↑
- Both HVAC maintenance — Regular HVAC maintenance ensures the system runs efficiently, reducing energy costs and attracting more buyers and renters. ↑
- Both Interior updates — Updating the interior with new fixtures and decor can make the home more appealing and attract more buyers and renters. ↑
- Both Exterior updates — Updating the exterior with new siding or a fresh coat of paint can significantly enhance the home's curb appeal and attract more buyers and renters. ↑
ⓘ Cost ranges are severity-bucket heuristics (US national rule-of-thumb). Get contractor quotes + a written scope before underwriting a rehab budget.
Schools (NCES district)
- District
- Dysart Unified District (4243)
- NCES district ID
- 0402690
- Math proficiency
- 34% ▼ -10.00%
- Reading proficiency
- 40% ▼ -5.00%
- Median HH income
- $58,033
- Composite
- 32.76/100
- National rank
- #5634
- State rank
- #73 of 249 in AZ
Livability — Surprise
- Score
- 74/100
- State rank
- #19
- US rank
- #4616
Category grades
Schools grade is shown separately in the Schools card above.
Census & demographics
- Census place
- Surprise, AZ
- County
- Maricopa County · 4,537,380 people
- City population
- 160,031
- Metro
- Phoenix-Mesa-Chandler, AZ
- Population (ZIP)
- 9,765
- Household income
- $56,444
- Rent vs Own
- Severe rent burden
- 510.0
Population outlook (Maricopa County) Hauer SSP2
- Today (2025)
- 4,979,203 people
- By 2030
- 5,378,229 · +8.0%
- By 2040
- 6,156,598 · +23.6%
- By 2050
- 6,872,376 · +38.0%
- By 2075
- 8,401,270 · +68.7%
- By 2100
- 9,247,439 · +85.7%
Race, ethnicity, and origin ACS 2023
- Neighborhood character
- Diverse neighborhood (Simpson 0.56)
- Race & ethnicity
- White 54% Hispanic / Latino 38% Two or more races 17% Black 4% Native American 1%
- Hispanic origin (detail)
- Mexican 31% Cuban 3%
- Common ancestry
- Romanian 2% Portuguese 2% Lithuanian 1%
- Foreign-born
- 9% · Canada, Guatemala
- Languages at home
- 73% English-only · Spanish 22% Arabic 2% Russian/Polish/Slavic 1%
Political lean MEDSL · Maricopa
- 2024 margin
- Toss-up / Even · D 47.7% · R 51.2% · Other 1.1%
- 2008→2024 swing
- +7.1pp toward D · 2008: -10.6pp · 2024: -3.5pp
- All cycles
- 2024: R+3.5 2020: D+2.2 2016: R+3.5 2012: R+12.0 2008: R+10.6
Not yet ingested
- Civics
- —
Market trends
- HPI YoY
- ▲ 0.18%
- Current HPI
- 287.1228
- Rent YoY
- ▼ -5.53%
- Metro
- Phoenix-Mesa-Chandler, AZ
- State GDP YoY
- ▲ 4.54%
- F500 in state
- 20
Industry mix (Fortune 500 HQ in AZ)
| Industry | F500 HQs | Revenue |
|---|---|---|
| Technology | 2 | $13B |
|
||
| Mining / Metals | 1 | $23B |
|
||
| Environmental Services | 1 | $16B |
|
||
| Metals / Steel | 1 | $14B |
|
||
| Technology Distribution | 1 | $9B |
|
||
| Homebuilding | 1 | $8B |
|
||
Price history
-6.1% since first listed5 events — show timeline
- 2026-05-09 Price Changed $69,000 ARMLS
- 2026-03-10 Listed $73,000 ARMLS
- 2021-04-28 Listing Removed — ARMLS
- 2021-03-30 Price Changed $72,000 ARMLS
- 2021-01-28 Listed $73,500 ARMLS
Cash-flow waterfall
monthlySold comps — $/sqft
last 12 mo · ≤1 miLoading sold comps…