133 Coyote Creek Ct · Abilene, TX
Flood risk No data
- FEMA flood zone
- —
- Chance of flooding over 30 yrs
- —
- Est. flood insurance / yr
- —
Fire risk No data
- Est. fire insurance / yr
- —
Heat risk No data
- Hot days now (above threshold)
- —
- Hot days in 30 yrs
- —
Wind risk No data
- Chance of severe wind over 30 yrs
- —
Air-quality risk No data
- Unhealthy air days now
- —
- Unhealthy air days in 30 yrs
- —
Risk factors via First Street. Map © Google.
Why this score? — see what drove the C grade
The composite is a weighted blend of 9 inputs, each scored 0–100. Each bar is that input's sub-score; the figure is the points it added to the 100-point composite (weight × sub-score).
- Cash flow +22.0/30.0
- DSCR +7.0/10.0
- ARV discount +6.0/15.0
- 1% rule +5.8/10.0
- Schools +5.6/10.0
- Rent growth +5.0/5.0
- Livability +3.8/5.0
- Condition / age +2.5/5.0
- Appreciation +0.0/10.0
$279,990
🖨 Deal sheet 📄 Offer letter ✓ Due diligence
Listing remarks
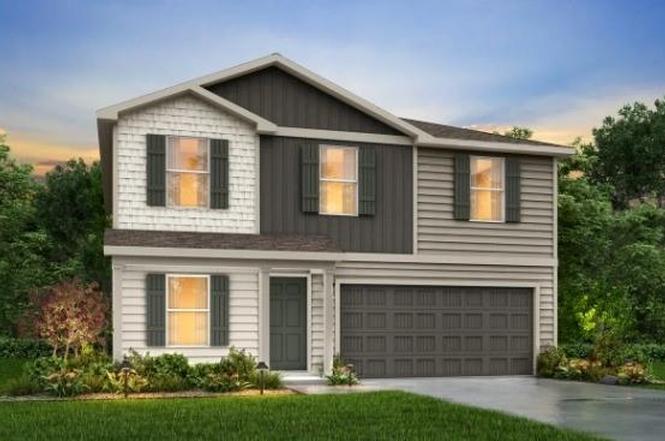
MLS# 21120766 - Built by NHC - Ready Now! ~ The Harrison Plan from our Liberty Series offers a perfect blend of comfort, practicality, and exceptional value. This 2-story home features 4 bedrooms, 2.5 bathrooms, a 2-car garage, and 2,203 square feet of thoughtfully designed living space. As you step inside, you’ll pass the versatile flex room before reaching the staircase to the upper level, a convenient closet, and a half bathroom. The heart of the home is the open kitchen and living area, complete with a central island, a dining area, and a spacious family room — perfect for entertaining or relaxing with loved ones. Upstairs, the private primary suite awaits, featuring an en s
Key facts
- 3,055 sq ft lot
- 2 garage spots
- Built 2026
Neighborhood map
What this means for you Summary
Snapshot
- This is a 4-bed/2.5-bath single-family listed at $280k.
Deal economics
- At list price, monthly cash flow is $446 ($5k/yr) — positive.
- The deal already cash-flows at list — no discount required.
- Meets the 1% rule at list price ($3k rent vs $280k).
- Recommended offer: $255k (9.0% below list) — sets the bar for market timing.
- Cap rate 8.2% vs local median 6.7% in Abilene — meaningfully above typical; check what's discounted (condition, days-on-market, listing class) to confirm the premium yield is real.
Location & tenants
- Location reads 75/100 on livability (#142 in TX, #4,037 nationally) — a middle-class / working-renter tenant base. Strengths: cost of living A+, housing A+, health & safety A+; Watch: schools D+, crime D, commute F.
- Wylie ISD (rural): math 63% / reading 62% proficiency, ranked #32 of 826 in TX (top 4%) — acceptable for families but not a draw, mixed tenant base, ~2y average lease; only 17% free/reduced lunch — higher-income household profile.
- Market conditions: Rents rising fast (+33.5%/yr); 370 active listings in the ZIP; 6 comparable units currently listed for rent nearby; rentals leasing fast (median 13d on market — plan ~1-2 weeks tenant-placement turnaround); solid renter incomes; 508 units permitted in Taylor County in 2024 (0 in 5+ unit buildings).
- This rent runs 40% of the median local income ($90k/yr) — at the standard rent-burdened threshold; future hikes will face affordability resistance.
Forward outlook
- Local home prices are declining (-3.0%/yr); year-one equity from $2k of loan paydown is wiped out by about $8k of value loss. Plan a longer hold.
- Taylor County population projected at +16% by 2050 — long-run rental-demand tailwind backs the buy-and-hold thesis.
- At projected returns (-3.0% appreciation + 8.0% rent growth), your $78k cash investment doubles in ~9 years — after that, you're playing with house money.
Negotiation context
- It's been on market 100 days — a 9% lower offer ($255k) is reasonable based on typical stale-listing flexibility.
- 2 sale attempts with the ask held roughly flat each time — persistent listings suggest the price (not the market) is what's stuck; bring a comps-based counter.
Questions for the listing agent
- It's been on market 100 days. Have you received any prior offers? Is the seller open to a 9% concession, seller financing, or rate buy-down credit?
- Why hasn't it sold? Are there any deal-killer items the seller is aware of (foundation, flood, title, zoning, code violations)?
- Is there a deadline driving the sale (1031 exchange, divorce, estate, relocation)? That informs how much negotiation room exists.
- Schools are D-rated, which usually means shorter tenancies and higher turnover. Who's the typical renter profile here, and what's been the actual vacancy rate?
- Crime grade is D in this area — have there been break-ins, vandalism, or insurance claims at this property in the last 3 years? What carrier currently insures it and at what premium?
- What's the average days-on-market for RENTAL listings here right now (not sales)? A rising rental-DOM trend means longer vacancies and softer asking-rent achievability than the comps imply.
- What's the recent tenant-quality profile in this submarket — average credit score on applications, eviction rate, late-payment / NSF rate, and stable-employment percentage? A property-management company in the area should have these aggregated.
- How much new for-sale + rental construction is in the pipeline within 1–3 miles? Heavy new supply typically softens prices + rents 12–24 months out; constrained supply supports both.
Investment metrics
- 1% rule
- 1.08% ✓
- Cap rate
- 8.21%
- Cash-on-cash
- 6.83%
- DSCR
- 1.30
- GRM
- 7.7
CMA / ARV
- ARV (on-the-fly)
- $270,969
- Comps found
- 12
Show comp detail 12 sales within ~0.75 mi
| Address | Dist | Beds/Ba | Sqft | Sold | Price | $/sf | Match |
|---|---|---|---|---|---|---|---|
| 133 Coyote Creek Ct | 0.00mi | 4/2.5 | 2,203 (0%) | 1mo | $279,990 | $127 | 99 |
| 3510 Silver Springs Ct | 0.40mi | 4/2.5 | 2,203 (0%) | 1mo | $277,990 | $126 | 81 |
| 209 Coyote Crk | 0.41mi | 4/2.5 | 2,203 (0%) | 1mo | $258,990 | $118 | 80 |
| 132 Dotty Lou | 0.57mi | 4/2.5 | 2,001 (-9%) | 3mo | $245,490 | $123 | 56 |
| 220 Dotty Lou | 0.57mi | 4/2.5 | 2,002 (-9%) | 3mo | $237,280 | $119 | 56 |
| 156 Dotty Lou | 0.57mi | 4/2.5 | 2,001 (-9%) | 3mo | $245,211 | $123 | 56 |
| 107 Dotty Lou | 0.57mi | 4/2.5 | 2,001 (-9%) | 3mo | $245,990 | $123 | 55 |
| 120 Dotty Lou | 0.57mi | 4/2.5 | 2,002 (-9%) | 4mo | $248,488 | $124 | 55 |
| 219 Polasek Dr | 0.63mi | 4/2.5 | 2,001 (-9%) | 0mo | $260,990 | $130 | 55 |
| 162 Dotty Lou St | 0.57mi | 5/2.5 (+1) | 2,408 (+9%) | 3mo | $271,489 | $113 | 51 |
| 138 Dotty Lou | 0.57mi | 5/2.5 (+1) | 2,408 (+9%) | 3mo | $266,990 | $111 | 50 |
| 517 Beretta | 0.69mi | 3/2.0 (-1) | 1,970 (-11%) | 3mo | $362,500 | $184 | 41 |
Match score weights: distance 35% · size 25% · config 20% · recency 20%. Top-matched comps best support the ARV.
Projected returns pro-forma
-3.0% appreciation · 8.0% rent growth · sell at horizon
- IRR
- -0.3%
- Equity multiple
- 0.99×
- Total profit
- $-965
- Equity at exit
- $41,747
- IRR
- 14.0%
- Equity multiple
- 2.38×
- Total profit
- $108,456
- Equity at exit
- $24,208
Cash invested: $78,397 (down + closing). Projections, not guarantees.
Landlord ↔ Tenant lean methodology
- Overall (STATE)
- 87 Strongly Landlord-Friendly
- State Texas
- 87 Strongly Landlord-Friendly · R+5
- County
- — inherits STATE
- City
- — inherits STATE
ZIP-level market 79602
- Home prices YoY
- -19.6%
- Rents YoY
- 33.5%
- Active inventory
- 370
- Price-to-rent
- 7.7×
Monthly cashflow live
- Estimated rent
- $3,014 high interval (Pro) →
- Mortgage (P&I)
- −$1,468
- Tax est. 1.5%
- −$350 /mo · $4,200/yr
- Insurance
- −$117
- HOA
- −$0
- Vacancy / Maint / Mgmt
- −$633
- Net cashflow
- $446
Break-even live
UW: 25.0% down · 7.5% · 30yr · 1.5% tax · 5.0% vac · 8.0% maint · 8.0% mgmt
Financing live
Cash to close
- Down payment
- $69,998
- Closing costs
- $8,400
- Reserves months
- —
- Total cash needed
- —
Loan-product check · same deal, 3 products live
Conventional
25% down · 7.5% · 30yr
- Down + closing
- —
- Monthly P&I
- —
- Monthly cashflow
- —
- DSCR
- —
- Eligible?
- —
Personal DTI + credit; lowest rate.
DSCR
20% down · 8.5% · 30yr
- Down + closing
- —
- Monthly P&I
- —
- Monthly cashflow
- —
- DSCR
- —
- Eligible?
- —
No personal income docs; deal must DSCR.
Hard money
10% down · 12.0% · 12mo
- Down + closing
- —
- Monthly P&I
- —
- Monthly cashflow
- —
- DSCR
- —
- Eligible?
- —
Short-term bridge; refi at stabilization.
Rent comps 6 comps
| Address | Beds | Baths | Sqft | Rent | $/sqft | DOM | Units | Dist |
|---|---|---|---|---|---|---|---|---|
| 609 Marlin Dr Abilene, TX | 3.0 | 2.0 | 1925 | $3,250 | $1.69 | 18d | 1 | 0.85mi |
| 801 Big Water Trl Abilene, TX | 3.0 | 2.0 | 1537 | $2,800 | $1.82 | 13d | 1 | 1.13mi |
| 3926 Duke Ln Abilene, TX | 3.0 | 2.0 | 1612 | $2,250 | $1.40 | 7d | 1 | 1.18mi |
| 1342 Lewis and Clark Trl Abilene, TX | 3.0 | 2.0 | 1572 | $6,900 | $4.39 | 13d | 1 | 1.38mi |
| 1341 Briar Cliff Path Abilene, TX | 4.0 | 2.0 | 1712 | $3,100 | $1.81 | 13d | 1 | 1.39mi |
| 1097 Lytle Creek Dr Abilene, TX | 3.0 | 2.0 | 1456 | $2,895 | $1.99 | 13d | 1 | 1.40mi |
Listing history 6 events
-
2026-03-25status Pending
-
2026-03-24status Active
-
2026-03-11status Pending
-
2026-03-06price $279,990
-
2026-02-11price $279,490
-
2025-11-25$277,990 Active
ⓘ Source: listings_history table (triggers on properties + properties_extension) + one-shot
backfill from property_details.listing_events for pre-trigger history.
Nearby sold comps map
Loading sold comps map…
Walkable amenities ~0.75 mi
Loading nearby amenities…
Taxation est. · year 1
- Rental income
- $36,172
- − Mortgage interest
- −$15,684
- − Property taxes
- −$4,200
- − Insurance
- −$1,400
- − Repairs & maintenance
- −$2,894
- − Management
- −$2,894
- − Depreciation
- −$8,145
- Taxable income
- $956
- Est. tax owed @ 24.0%
- −$229
- After-tax cash flow
- $5,127/yr
For passive investors: Depreciation is non-cash, so a rental often shows a tax loss while cash-flowing — sheltering income. Rental losses are passive: they offset passive income freely, and up to $25,000/yr can offset ordinary (W-2) income if you actively participate and your MAGI is under $100k (phasing out to $0 by $150k); unused losses carry forward. On sale, claimed depreciation is recaptured at up to 25%, and gains may owe capital-gains tax (a 1031 exchange can defer both). Figures are a year-1 estimate at your 24.0% rate — not tax advice; consult a CPA.
Schools (NCES district)
- District
- Wylie ISD
- NCES district ID
- 4846500
- Math proficiency
- 63% ▼ -12.00%
- Reading proficiency
- 62% ▼ -4.00%
- Median HH income
- $78,248
- Composite
- 55.86/100
- National rank
- #1206
- State rank
- #32 of 826 in TX
Livability — Abilene
- Score
- 75/100
- State rank
- #142
- US rank
- #4037
Category grades
Schools grade is shown separately in the Schools card above.
Census & demographics
- Census place
- Abilene, TX
- County
- Taylor County · 136,672 people
- City population
- 136,672
- Metro
- Abilene, TX
- Population (ZIP)
- 27,425
- Household income
- $89,551
- Rent vs Own
- Severe rent burden
- 338.0
Population outlook (Taylor County) Hauer SSP2
- Today (2025)
- 145,270 people
- By 2030
- 150,050 · +3.3%
- By 2040
- 159,417 · +9.7%
- By 2050
- 168,883 · +16.3%
- By 2075
- 194,436 · +33.8%
- By 2100
- 203,163 · +39.9%
Race, ethnicity, and origin ACS 2023
- Neighborhood character
- Majority White (64%)
- Race & ethnicity
- White 64% Hispanic / Latino 22% Two or more races 12% Black 10% Asian 2%
- Hispanic origin (detail)
- Mexican 19%
- Common ancestry
- Romanian 2% Italian 2% Portuguese 2%
- Foreign-born
- 6% · Canada, Vietnam, Jamaica
- Languages at home
- 87% English-only · Spanish 9% Other Asian/Pacific 1% French/Haitian/Cajun 1%
Political lean MEDSL · Taylor
- 2024 margin
- Solid R (+49.8) · D 24.6% · R 74.4% · Other 1.0%
- 2008→2024 swing
- -4.2pp toward R · 2008: -45.6pp · 2024: -49.8pp
- All cycles
- 2024: R+49.8 2020: R+45.3 2016: R+51.1 2012: R+53.6 2008: R+45.6
Not yet ingested
- Civics
- —
Market trends
- HPI YoY
- ▼ -46.04%
- Current HPI
- 189.3098
- Rent YoY
- ▲ 33.46%
- Metro
- Abilene, TX
- State GDP YoY
- ▲ 3.95%
- F500 in state
- 110
Industry mix (Fortune 500 HQ in TX)
| Industry | F500 HQs | Revenue |
|---|---|---|
| Energy | 16 | $1,198B |
|
||
| Technology | 5 | $198B |
|
||
| Engineering / Construction | 4 | $72B |
|
||
| Energy Services | 3 | $60B |
|
||
| Utilities | 3 | $41B |
|
||
| Healthcare | 2 | $330B |
|
||
Price history
+0.7% since first listed6 events — show timeline
- 2026-03-25 Pending — NTREIS
- 2026-03-24 Relisted — NTREIS
- 2026-03-11 Pending — NTREIS
- 2026-03-06 Price Changed $279,990 NTREIS
- 2026-02-11 Price Changed $279,490 NTREIS
- 2025-11-25 Listed $277,990 NTREIS
Cash-flow waterfall
monthlySold comps — $/sqft
last 12 mo · ≤1 miLoading sold comps…