 🏗️ New Construction
Longport Plan · Pine Ridge at Crestwood, NJ
Flood risk No data
- FEMA flood zone
- —
- Chance of flooding over 30 yrs
- —
- Est. flood insurance / yr
- —
Fire risk No data
- Est. fire insurance / yr
- —
Heat risk No data
- Hot days now (above threshold)
- —
- Hot days in 30 yrs
- —
Wind risk No data
- Chance of severe wind over 30 yrs
- —
Air-quality risk No data
- Unhealthy air days now
- —
- Unhealthy air days in 30 yrs
- —
Risk factors via First Street. Map © Google.
Why this score? — see what drove the B- grade
The composite is a weighted blend of 9 inputs, each scored 0–100. Each bar is that input's sub-score; the figure is the points it added to the 100-point composite (weight × sub-score).
- Cash flow +30.0/30.0
- DSCR +10.0/10.0
- 1% rule +9.3/10.0
- ARV discount +7.5/15.0
- Condition / age +4.0/5.0
- Livability +3.0/5.0
- Schools +2.9/10.0
- Rent growth +2.5/5.0
- Appreciation +0.0/10.0
$114,900
🖨 Deal sheet 📄 Offer letter ✓ Due diligence
Listing remarks
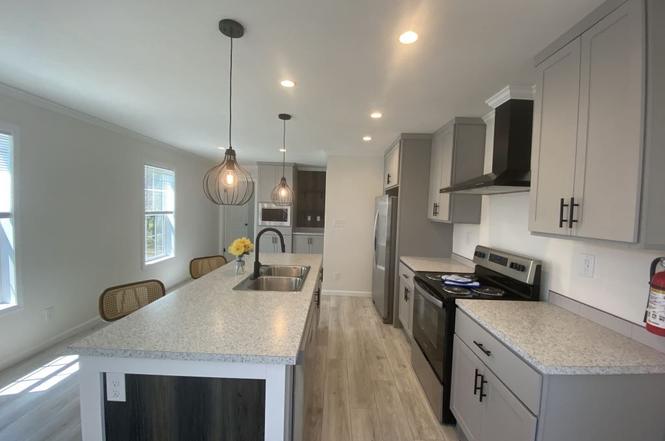
55+ age qualified community. Welcome to Pine Ridge at Crestwood a 55+ age-qualified active and vibrant community, where you can find yourself in your dream home. We have a stunning, 2026 2 bed, 2 bath home for sale featuring 991.32 sq ft of beautifully designed living space. Located in Whiting, this property offers the perfect blend of modern amenities and timeless charm. Step inside to find a split floor plan, vinyl floors, high ceilings, natural light. The eat in kitchen boasts stainless steel appliances, custom cabinetry, recess lighting, and a beautiful island perfect for both everyday living and entertaining. The spacious primary suite offers a peaceful retreat, complete with walk in s
Key facts
- Custom cabinetry
- Vinyl floors
- Split floor plan
Tags
Property features AI
Finance
- Financial info: List price $114,900
Exterior
- Home design: New construction plan; Plan name: Longport
- Exterior features: Living area approximately 991 (displayed)
Interior
- Bedrooms: 2 bedrooms
- Bathrooms: 2 full bathrooms
- Interior features: Plan: Longport
Neighborhood map
What this means for you Summary
Snapshot
- This is a 2-bed/2.0-bath manufactured listed at $115k. Condition is rated good.
Deal economics
- At list price, monthly cash flow is $506 ($6k/yr) — positive.
- The deal already cash-flows at list — no discount required.
- Meets the 1% rule at list price ($2k rent vs $115k).
- Cap rate 11.6% vs local median 5.9% in Pine Ridge at Crestwood — top-decile yield for the area; either an underpriced asset or a hidden risk that comps aren't pricing in. Stress-test before assuming the spread holds.
Location & tenants
- Location reads 60/100 on livability (#481 in NJ) — a middle-class / working-renter tenant base. Strengths: crime A+, housing A+, cost of living B; Watch: employment D, schools F, amenities F.
- Manchester Township School District (suburban): math 25% / reading 44% proficiency, ranked #320 of 472 in NJ (top 68%) — families likely to look elsewhere, expect single-tenant / working-renter base with shorter leases.
- Market conditions: 648 active listings in the ZIP; 2 comparable units currently listed for rent nearby; 4,434 units permitted in Ocean County in 2024 (868 in 5+ unit buildings).
Forward outlook
- Local home prices are declining (-3.0%/yr); year-one equity from $794 of loan paydown is wiped out by about $3k of value loss. Plan a longer hold.
- Ocean County population projected to shrink 8% by 2050 — rents likely to lag national; underwrite the cash flow, not the appreciation.
- At projected returns (-3.0% appreciation + 3.0% rent growth), your $32k cash investment doubles in ~7 years — after that, you're playing with house money.
Negotiation context
- Only 2 days on market — expect competitive offers; lowballing is unlikely to land.
Questions for the listing agent
- Is there a deadline driving the sale (1031 exchange, divorce, estate, relocation)? That informs how much negotiation room exists.
- Schools are F-rated, which usually means shorter tenancies and higher turnover. Who's the typical renter profile here, and what's been the actual vacancy rate?
- What's the average days-on-market for RENTAL listings here right now (not sales)? A rising rental-DOM trend means longer vacancies and softer asking-rent achievability than the comps imply.
- What's the recent tenant-quality profile in this submarket — average credit score on applications, eviction rate, late-payment / NSF rate, and stable-employment percentage? A property-management company in the area should have these aggregated.
- How much new for-sale + rental construction is in the pipeline within 1–3 miles? Heavy new supply typically softens prices + rents 12–24 months out; constrained supply supports both.
Investment metrics
- 1% rule
- 1.43% ✓
- Cap rate
- 11.58%
- Cash-on-cash
- 18.87%
- DSCR
- 1.84
- GRM
- 5.8
CMA / ARV
No comps found within radius.
Projected returns pro-forma
-3.0% appreciation · 3.0% rent growth · sell at horizon
- IRR
- 10.7%
- Equity multiple
- 1.42×
- Total profit
- $13,619
- Equity at exit
- $17,132
- IRR
- 19.8%
- Equity multiple
- 2.66×
- Total profit
- $53,440
- Equity at exit
- $9,934
Cash invested: $32,172 (down + closing). Projections, not guarantees.
Landlord ↔ Tenant lean methodology
- Overall (STATE)
- 21 Tenant-Leaning
- State New Jersey
- 21 Tenant-Leaning · D+6
- County
- — inherits STATE
- City
- — inherits STATE
ZIP-level market 08759
- Active inventory
- 648
- Price-to-rent
- 5.8×
Monthly cashflow live
- Estimated rent
- $1,645 medium interval (Pro) →
- Mortgage (P&I)
- −$603
- Tax est. 1.5%
- −$144 /mo · $1,724/yr
- Insurance
- −$48
- HOA
- −$0
- Vacancy / Maint / Mgmt
- −$346
- Net cashflow
- $506
Break-even live
UW: 25.0% down · 7.5% · 30yr · 1.5% tax · 5.0% vac · 8.0% maint · 8.0% mgmt
Financing live
Cash to close
- Down payment
- $28,725
- Closing costs
- $3,447
- Reserves months
- —
- Total cash needed
- —
Loan-product check · same deal, 3 products live
Conventional
25% down · 7.5% · 30yr
- Down + closing
- —
- Monthly P&I
- —
- Monthly cashflow
- —
- DSCR
- —
- Eligible?
- —
Personal DTI + credit; lowest rate.
DSCR
20% down · 8.5% · 30yr
- Down + closing
- —
- Monthly P&I
- —
- Monthly cashflow
- —
- DSCR
- —
- Eligible?
- —
No personal income docs; deal must DSCR.
Hard money
10% down · 12.0% · 12mo
- Down + closing
- —
- Monthly P&I
- —
- Monthly cashflow
- —
- DSCR
- —
- Eligible?
- —
Short-term bridge; refi at stabilization.
Rent comps 2 comps
| Address | Beds | Baths | Sqft | Rent | $/sqft | DOM | Units | Dist |
|---|---|---|---|---|---|---|---|---|
| 7 Teal Ct Whiting, NJ | 2.0 | 2.0 | 1056 | $1,600 | $1.52 | 3d | 1 | 0.44mi |
| 57D Milford Ave Unit 53 Whiting, NJ | 2.0 | 1.0 | 880 | $1,800 | $2.05 | 24d | 1 | 1.43mi |
Listing history 4 events
-
2026-06-18days on market $114,900 Active 2 DOM
-
2026-06-17$114,900 Active 1 DOM
-
2026-06-16remarks 699-char remark
-
2026-06-16$114,900 Active 1 DOM
ⓘ Source: listings_history table (triggers on properties + properties_extension) + one-shot
backfill from property_details.listing_events for pre-trigger history.
Nearby sold comps map
Loading sold comps map…
Walkable amenities ~0.75 mi
Loading nearby amenities…
Taxation est. · year 1
- Rental income
- $19,744
- − Mortgage interest
- −$6,436
- − Property taxes
- −$1,724
- − Insurance
- −$574
- − Repairs & maintenance
- −$1,580
- − Management
- −$1,580
- − Depreciation
- −$3,343
- Taxable income
- $4,508
- Est. tax owed @ 24.0%
- −$1,082
- After-tax cash flow
- $4,987/yr
For passive investors: Depreciation is non-cash, so a rental often shows a tax loss while cash-flowing — sheltering income. Rental losses are passive: they offset passive income freely, and up to $25,000/yr can offset ordinary (W-2) income if you actively participate and your MAGI is under $100k (phasing out to $0 by $150k); unused losses carry forward. On sale, claimed depreciation is recaptured at up to 25%, and gains may owe capital-gains tax (a 1031 exchange can defer both). Figures are a year-1 estimate at your 24.0% rate — not tax advice; consult a CPA.
Condition & rehab AI · 12 photos
This home is in excellent condition with a good condition score of 80. It is move-in ready with a cosmetic rehab level and no visible repairs or maintenance needed. The highest-ROI updates would be painting the exterior and interior walls, and landscaping the front yard to enhance curb appeal and add value.
Value-add opportunities
- Both Painting the exterior and interior walls — Enhances curb appeal and interior aesthetics.
- Both Landscaping the front yard — Improves curb appeal and adds value to the property.
Renovation cost estimate screening
Value-add ROI direction
- Both Painting the exterior and interior walls — Enhances curb appeal and interior aesthetics. ↑
- Both Landscaping the front yard — Improves curb appeal and adds value to the property. ↑
ⓘ Cost ranges are severity-bucket heuristics (US national rule-of-thumb). Get contractor quotes + a written scope before underwriting a rehab budget.
Schools (NCES district)
- District
- Manchester Township School District
- NCES district ID
- 3409450
- Math proficiency
- 25% ▼ -17.00%
- Reading proficiency
- 44% ▼ -5.00%
- Median HH income
- $38,905
- Composite
- 28.8/100
- National rank
- #6662
- State rank
- #320 of 472 in NJ
Livability — Pine Ridge at Crestwood
- Score
- 60/100
- State rank
- #481
- US rank
- #18916
Category grades
Schools grade is shown separately in the Schools card above.
Census & demographics
- Census place
- Pine Ridge at Crestwood, NJ
- Population (ZIP)
- 34,290
Population outlook (Ocean County) Hauer SSP2
- Today (2025)
- 586,991 people
- By 2030
- 581,403 · -1.0%
- By 2040
- 564,913 · -3.8%
- By 2050
- 538,149 · -8.3%
- By 2075
- 468,845 · -20.1%
- By 2100
- 350,297 · -40.3%
Race, ethnicity, and origin ACS 2023
- Neighborhood character
- Predominantly White (87%)
- Race & ethnicity
- White 87% Hispanic / Latino 5% Black 4% Two or more races 4% Asian 2%
- Hispanic origin (detail)
- Puerto Rican 2%
- Common ancestry
- Romanian 8% Scotch-Irish 2% Lithuanian 2%
- Foreign-born
- 11% · Canada, China
- Languages at home
- 88% English-only · Spanish 3% Russian/Polish/Slavic 2% Other Indo-European 2%
Political lean MEDSL · Ocean
- 2024 margin
- Solid R (+36.0) · D 31.4% · R 67.4% · Other 1.2%
- 2008→2024 swing
- -17.6pp toward R · 2008: -18.4pp · 2024: -36.0pp
- All cycles
- 2024: R+36.0 2020: R+28.7 2016: R+34.0 2012: R+17.7 2008: R+18.4
Not yet ingested
- Civics
- —
Market trends
- HPI YoY
- ▼ -347.85%
- Current HPI
- 274.4679
- Rent YoY
- —
- Metro
- —
- State GDP YoY
- ▲ 2.05%
- F500 in state
- 34
Industry mix (Fortune 500 HQ in NJ)
| Industry | F500 HQs | Revenue |
|---|---|---|
| Consumer Goods | 3 | $31B |
|
||
| Pharmaceuticals | 2 | $153B |
|
||
| Technology | 2 | $21B |
|
||
| Insurance | 2 | $20B |
|
||
| Healthcare | 2 | $19B |
|
||
| Financial Services | 1 | $70B |
|
||
Cash-flow waterfall
monthlySold comps — $/sqft
last 12 mo · ≤1 miLoading sold comps…