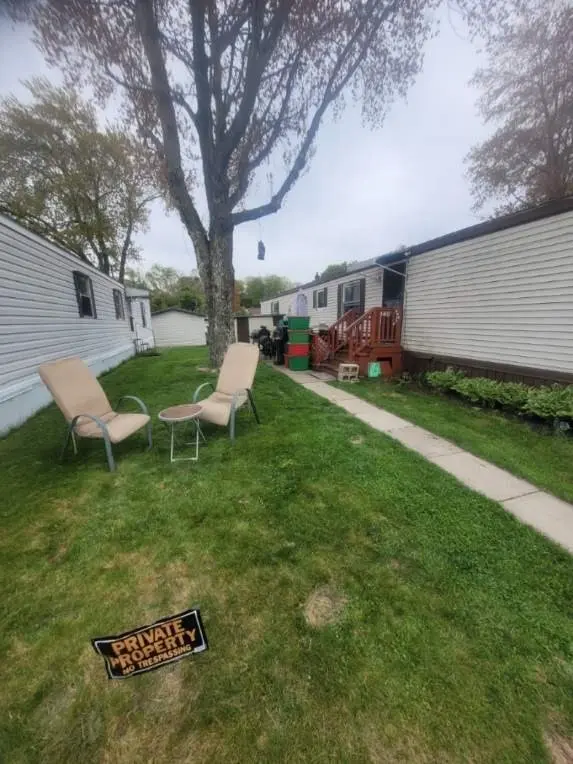
557 Southwest Cutoff #140 · Worcester, MA
Flood risk No data
- FEMA flood zone
- —
- Chance of flooding over 30 yrs
- —
- Est. flood insurance / yr
- —
Fire risk No data
- Est. fire insurance / yr
- —
Heat risk 4/10 · Minor
- Hot days now (above threshold)
- 7 days/yr
- Hot days in 30 yrs
- 17 days/yr
Wind risk No data
- Chance of severe wind over 30 yrs
- —
Air-quality risk 2/10 · Minimal
- Unhealthy air days now
- 1 days/yr
- Unhealthy air days in 30 yrs
- 2 days/yr
Risk factors via First Street. Map © Google.
Why this score? — see what drove the B- grade
The composite is a weighted blend of 9 inputs, each scored 0–100. Each bar is that input's sub-score; the figure is the points it added to the 100-point composite (weight × sub-score).
- Cash flow +26.3/30.0
- ARV discount +12.6/15.0
- DSCR +8.9/10.0
- 1% rule +7.0/10.0
- Livability +4.4/5.0
- Rent growth +2.5/5.0
- Condition / age +2.5/5.0
- Schools +2.0/10.0
- Appreciation +0.0/10.0
$165,000
🖨 Deal sheet (PDF) 📄 Offer letter ✓ Due diligence
Listing remarks MLS
Description: MOVE IN READY!!!!!! Why rent when you can own. Updated spacious mobile home. Recent updates including wall to wall carpeting in Living Room and Bedrooms. Updated Kitchen. Recently installed replacement windows. Freshly painted. Patio. Fees include rental of land, water, sewer, taxes, road maintenance and trash.
Key facts
- Open floor plan
- New water tank
- Newer roof
Tags
Property features AI
Finance
- HOA & community: Community offers shopping and highway access; Not a senior community
Exterior
- Parking: 2 open parking spaces
- Utilities: Public water; Public sewer; Electric with circuit breakers
- Home design: Mobile home; Beige exterior
- Construction: Shingle roof; Built in public-record year (actual)
- Exterior features: Deck; Level lot; Paved road access
Interior
- Kitchen: Range; Dishwasher; Refrigerator
- Bedrooms: Master bedroom with private bathroom
- Flooring: Laminate
- Bathrooms: 2 full bathrooms
- Heating & cooling: Forced air heating (oil); Window cooling unit(s)
- Interior features: Total of 4 rooms; Laminate flooring; One fireplace
Neighborhood map
What this means for you Summary
Snapshot
- This is a 2-bed/2.0-bath manufactured listed at $165k.
Deal economics
- At list price, monthly cash flow is $426 ($5k/yr) — positive.
- The deal already cash-flows at list — no discount required.
- Meets the 1% rule at list price ($2k rent vs $165k).
- Recommended offer: $163k (1.5% below list) — sets the bar for market timing.
- Cap rate 9.4% vs local median 4.1% in Worcester — top-decile yield for the area; either an underpriced asset or a hidden risk that comps aren't pricing in. Stress-test before assuming the spread holds.
Location & tenants
- Location reads 87/100 on livability (#9 in MA, #312 nationally) — a professional / high-income tenant draw. Strengths: crime A+, amenities A+, commute A+; Watch: schools C-, cost of living D.
- Worcester (urban): math 17% / reading 30% proficiency, ranked #280 of 302 in MA (top 93%) — low school quality limits family demand, transient renter base, plan for 1-2y turnover; 66% free/reduced lunch — lower-income household profile, screen leases tightly.
- Market conditions: 13 active listings in the ZIP; 14 comparable units currently listed for rent nearby; rentals at typical pace (median 24d on market — plan ~3-4 weeks tenant-placement turnaround); solid renter incomes; 2,293 units permitted in Worcester County in 2024 (1,205 in 5+ unit buildings).
- This rent runs 30% of the median local income ($79k/yr) — at the standard rent-burdened threshold; future hikes will face affordability resistance.
Forward outlook
- Local home prices are declining (-3.0%/yr); year-one equity from $1k of loan paydown is wiped out by about $5k of value loss. Plan a longer hold.
- At projected returns (-3.0% appreciation + 3.0% rent growth), your $46k cash investment doubles in ~10 years — after that, you're playing with house money.
Negotiation context
- It's been on market 22 days — a 2% lower offer ($163k) is reasonable based on typical stale-listing flexibility.
- 2 sale attempts since 17y ago with the ask held roughly flat each time — persistent listings suggest the price (not the market) is what's stuck; bring a comps-based counter.
- Current owner paid $38k; list at $165k implies a 334% gain — meaningful room to come down on a strong offer.
Questions for the listing agent
- Is there a deadline driving the sale (1031 exchange, divorce, estate, relocation)? That informs how much negotiation room exists.
- What's the average days-on-market for RENTAL listings here right now (not sales)? A rising rental-DOM trend means longer vacancies and softer asking-rent achievability than the comps imply.
- What's the recent tenant-quality profile in this submarket — average credit score on applications, eviction rate, late-payment / NSF rate, and stable-employment percentage? A property-management company in the area should have these aggregated.
- How much new for-sale + rental construction is in the pipeline within 1–3 miles? Heavy new supply typically softens prices + rents 12–24 months out; constrained supply supports both.
Investment metrics
- 1% rule
- 1.20% ✓
- Cap rate
- 9.39%
- Cash-on-cash
- 11.06%
- DSCR
- 1.49
- GRM
- 6.9
CMA / ARV
- ARV (on-the-fly)
- $186,200
- Comps found
- 11
Show comp detail 11 sales within ~0.75 mi
| Address | Dist | Beds/Ba | Sqft | Sold | Price | $/sf | Match |
|---|---|---|---|---|---|---|---|
| 47 Washington St #16 | 0.28mi | 2/2.0 | 980 (0%) | 12mo | $180,000 | $184 | 76 |
| 47 Washington St #7 | 0.28mi | 2/2.0 | 980 (0%) | 14mo | $130,000 | $133 | 76 |
| 3 Washington St #70 | 0.16mi | 2/2.0 | 924 (-6%) | 10mo | $195,000 | $211 | 75 |
| 47 Washington St #33 | 0.28mi | 2/1.0 | 924 (-6%) | 1mo | $199,900 | $216 | 72 |
| 47 Washington St #47 | 0.28mi | 2/2.0 | 1,056 (+8%) | 4mo | $204,000 | $193 | 70 |
| 557 Southwest Cutoff #60 | 0.14mi | 2/2.0 | 840 (-14%) | 0mo | $160,000 | $190 | 69 |
| 47 Washington St #45 | 0.28mi | 2/2.0 | 1,008 (+3%) | 16mo | $195,000 | $193 | 68 |
| 557 Southwest Cutoff #70 | 0.10mi | 2/2.0 | 896 (-9%) | 23mo | $170,000 | $190 | 62 |
| 47 Washington St #54 | 0.28mi | 2/2.0 | 1,100 (+12%) | 9mo | $199,000 | $181 | 59 |
| 113 Washington St #17 | 0.31mi | 2/2.0 | 1,064 (+9%) | 19mo | $190,000 | $179 | 55 |
| 16 Breezy Bnd | 0.57mi | 2/1.0 | 840 (-14%) | 15mo | $138,750 | $165 | 33 |
Match score weights: distance 35% · size 25% · config 20% · recency 20%. Top-matched comps best support the ARV.
Projected returns pro-forma
-3.0% appreciation · 3.0% rent growth · sell at horizon
- IRR
- 0.2%
- Equity multiple
- 1.01×
- Total profit
- $417
- Equity at exit
- $24,602
- IRR
- 9.9%
- Equity multiple
- 1.77×
- Total profit
- $35,411
- Equity at exit
- $14,266
Cash invested: $46,200 (down + closing). Projections, not guarantees.
Landlord ↔ Tenant lean methodology
- Overall (STATE)
- 20 Strongly Tenant-Friendly
- State Massachusetts
- 20 Strongly Tenant-Friendly · D+15
- County
- — inherits STATE
- City
- — inherits STATE
ZIP-level market 01607
- Home prices YoY
- -5.3%
- Active inventory
- 13
- Price-to-rent
- 6.9×
Monthly cashflow live
- Estimated rent
- $1,982 high interval (Pro) →
- Mortgage (P&I)
- −$865
- Tax est. 1.5%
- −$206 /mo · $2,475/yr
- Insurance
- −$69
- HOA
- −$0
- Vacancy / Maint / Mgmt
- −$416
- Net cashflow
- $426
Break-even live
Sensitivity live
| Price | -10% $540 | -5% $483 | +0% $426 | +5% $369 | +10% $312 |
|---|---|---|---|---|---|
| Rent | -10% $269 | -5% $348 | +0% $426 | +5% $504 | +10% $582 |
| Rate | -1.0pp $509 | -0.5pp $468 | base $426 | +0.5pp $383 | +1.0pp $340 |
UW: 25.0% down · 7.5% · 30yr · 1.5% tax · 5.0% vac · 8.0% maint · 8.0% mgmt
Financing live
Cash to close
- Down payment
- $41,250
- Closing costs
- $4,950
- Reserves months
- —
- Total cash needed
- —
Loan-product check · same deal, 3 products live
Conventional
25% down · 7.5% · 30yr
- Down + closing
- —
- Monthly P&I
- —
- Monthly cashflow
- —
- DSCR
- —
- Eligible?
- —
Personal DTI + credit; lowest rate.
DSCR
20% down · 8.5% · 30yr
- Down + closing
- —
- Monthly P&I
- —
- Monthly cashflow
- —
- DSCR
- —
- Eligible?
- —
No personal income docs; deal must DSCR.
Hard money
10% down · 12.0% · 12mo
- Down + closing
- —
- Monthly P&I
- —
- Monthly cashflow
- —
- DSCR
- —
- Eligible?
- —
Short-term bridge; refi at stabilization.
Rent comps 14 comps
| Address | Beds | Baths | Sqft | Rent | $/sqft | DOM | Units | Dist |
|---|---|---|---|---|---|---|---|---|
| 394 Greenwood St Unit B Millbury, MA | 2.0 | 1.0 | 900 | $2,200 | $2.44 | 15d | 1 | 0.88mi |
| 19 Kosta St Unit 3 Worcester, MA | 2.0 | 1.0 | 1055 | $1,700 | $1.61 | 44d | 1 | 1.20mi |
| 78 Greenwood St Unit 2 Worcester, MA | 3.0 | 1.0 | 1000 | $2,200 | $2.20 | 15d | 1 | 1.22mi |
| 28 Ekman St Apt 1 Worcester, MA | 3.0 | 1.0 | 900 | $2,200 | $2.44 | 44d | 1 | 1.32mi |
| 6 Ekman St Unit 3 Worcester, MA | 2.0 | 1.0 | 900 | $1,700 | $1.89 | 24d | 1 | 1.33mi |
| 19 Reeves St Unit 2 Worcester, MA | 2.0 | 1.0 | 1100 | $2,200 | $2.00 | 24d | 1 | 1.34mi |
| 19 Reeves St Unit 3 Worcester, MA | 2.0 | 1.0 | 1100 | $2,199 | $2.00 | 24d | 1 | 1.34mi |
| 19 Reeves St Unit 1 Worcester, MA | 3.0 | 1.0 | 1100 | $2,300 | $2.09 | 24d | 1 | 1.34mi |
| 9 Reeves St Unit C Worcester, MA | 2.0 | 1.0 | 1000 | $2,000 | $2.00 | 44d | 1 | 1.36mi |
| 9 Reeves St Unit B Worcester, MA | 2.0 | 1.0 | 935 | $2,100 | $2.25 | 44d | 1 | 1.36mi |
| 21 Whipple St #3 Worcester, MA | 2.0 | 1.0 | 1100 | $1,900 | $1.73 | 24d | 1 | 1.38mi |
| 10 Henry Ter Worcester, MA | 2.0 | 1.0 | 875 | $1,975 | $2.26 | 24d | 1 | 1.40mi |
| 10 Oswald St Unit 1 Worcester, MA | 2.0 | 1.0 | 835 | $1,700 | $2.04 | 15d | 1 | 1.43mi |
| 6 Oswald St Unit 1 Worcester, MA | 1.0 | 1.0 | 800 | $1,500 | $1.88 | 15d | 1 | 1.45mi |
Listing history 19 events
-
2026-06-18days on market $165,000 Active 22 DOM
-
2026-06-17days on market $165,000 Active 21 DOM
-
2026-06-16days on market $165,000 Active 20 DOM
-
2026-06-15days on market $165,000 Active 19 DOM
-
2026-06-14days on market $165,000 Active 17 DOM
-
2026-06-10days on market $165,000 Active 14 DOM
-
2026-06-09days on market $165,000 Active 13 DOM
-
2026-06-08days on market $165,000 Active 12 DOM
-
2026-06-07days on market $165,000 Active 11 DOM
-
2026-06-05days on market $165,000 Active 8 DOM
-
2026-06-03days on market $165,000 Active 7 DOM
-
2026-06-02days on market $165,000 Active 6 DOM
-
2026-06-01days on market $165,000 Active 5 DOM
-
2026-05-31statusdays on market $165,000 Active 4 DOM
-
2026-05-31days on market $165,000 New 3 DOM
-
2026-05-27$165,000 New
-
2009-09-24soldstatus $38,000 Sold 326-char remark
Show marketing remark (326 chars)
Description: MOVE IN READY!!!!!! Why rent when you can own. Updated spacious mobile home. Recent updates including wall to wall carpeting in Living Room and Bedrooms. Updated Kitchen. Recently installed replacement windows. Freshly painted. Patio. Fees include rental of land, water, sewer, taxes, road maintenance and trash.
-
2009-08-28historical Under Agreement 326-char remark
Show marketing remark (326 chars)
Description: MOVE IN READY!!!!!! Why rent when you can own. Updated spacious mobile home. Recent updates including wall to wall carpeting in Living Room and Bedrooms. Updated Kitchen. Recently installed replacement windows. Freshly painted. Patio. Fees include rental of land, water, sewer, taxes, road maintenance and trash.
-
2009-08-05$44,900 New 326-char remark
Show marketing remark (326 chars)
Description: MOVE IN READY!!!!!! Why rent when you can own. Updated spacious mobile home. Recent updates including wall to wall carpeting in Living Room and Bedrooms. Updated Kitchen. Recently installed replacement windows. Freshly painted. Patio. Fees include rental of land, water, sewer, taxes, road maintenance and trash.
ⓘ Source: listings_history table (triggers on properties + properties_extension) + one-shot
backfill from property_details.listing_events for pre-trigger history.
Climate risk First Street
- Heat 4/10 Moderate
- Air quality 2/10 Low 1 unhealthy d/yr today · 2 by 30 yrs out
Nearby sold comps map
Loading sold comps map…
Walkable amenities ~0.75 mi
Loading nearby amenities…
Taxation est. · year 1
- Rental income
- $23,790
- − Mortgage interest
- −$9,243
- − Property taxes
- −$2,475
- − Insurance
- −$825
- − Repairs & maintenance
- −$1,903
- − Management
- −$1,903
- − Depreciation
- −$4,800
- Taxable income
- $2,641
- Est. tax owed @ 24.0%
- −$634
- After-tax cash flow
- $4,477/yr
For passive investors: Depreciation is non-cash, so a rental often shows a tax loss while cash-flowing — sheltering income. Rental losses are passive: they offset passive income freely, and up to $25,000/yr can offset ordinary (W-2) income if you actively participate and your MAGI is under $100k (phasing out to $0 by $150k); unused losses carry forward. On sale, claimed depreciation is recaptured at up to 25%, and gains may owe capital-gains tax (a 1031 exchange can defer both). Figures are a year-1 estimate at your 24.0% rate — not tax advice; consult a CPA.
Schools (NCES district)
- District
- Worcester
- NCES district ID
- 2513230
- Math proficiency
- 17% ▼ -15.00%
- Reading proficiency
- 30% ▼ -8.00%
- Median HH income
- $45,063
- Composite
- 20.3/100
- National rank
- #8615
- State rank
- #280 of 302 in MA
Livability — Worcester
- Score
- 87/100
- State rank
- #9
- US rank
- #312
Category grades
Schools grade is shown separately in the Schools card above.
Census & demographics
- Census place
- Worcester, MA
- County
- Worcester County · 487,911 people
- City population
- 207,324
- Metro
- Worcester, MA-CT
- Population (ZIP)
- 8,706
- Household income
- $78,727
- Rent vs Own
- Severe rent burden
- 379.0
Population outlook (Worcester County) Hauer SSP2
- Today (2025)
- 850,858 people
- By 2030
- 860,403 · +1.1%
- By 2040
- 869,902 · +2.2%
- By 2050
- 869,110 · +2.1%
- By 2075
- 870,120 · +2.3%
- By 2100
- 829,703 · -2.5%
Race, ethnicity, and origin ACS 2023
- Neighborhood character
- Diverse neighborhood (Simpson 0.69)
- Race & ethnicity
- White 47% Hispanic / Latino 22% Two or more races 20% Black 19% Asian 3%
- Hispanic origin (detail)
- Puerto Rican 16% Dominican 2%
- Common ancestry
- Lithuanian 9% Romanian 3% Slovak 2%
- Foreign-born
- 24% · Canada, Vietnam, Jamaica
- Languages at home
- 62% English-only · Spanish 16% Other Indo-European 5% Russian/Polish/Slavic 3%
Political lean MEDSL · Worcester
- 2024 margin
- D (+10.0) · D 53.9% · R 43.9% · Other 2.2%
- 2008→2024 swing
- -3.8pp toward R · 2008: 13.8pp · 2024: 10.0pp
- All cycles
- 2024: D+10.0 2020: D+17.8 2016: D+10.5 2012: D+9.2 2008: D+13.8
Not yet ingested
- Civics
- —
Market trends
- HPI YoY
- ▼ -20.31%
- Current HPI
- 365.7055
- Rent YoY
- —
- Metro
- Worcester, MA-CT
- State GDP YoY
- ▲ 2.28%
- F500 in state
- 38
Industry mix (Fortune 500 HQ in MA)
| Industry | F500 HQs | Revenue |
|---|---|---|
| Technology | 3 | $17B |
|
||
| Insurance | 2 | $84B |
|
||
| Retail | 2 | $76B |
|
||
| Life Sciences | 1 | $43B |
|
||
| Energy Technology | 1 | $31B |
|
||
| Aerospace / Defense | 1 | $18B |
|
||
Price history
+267.5% since first listed4 events — show timeline
- 2026-05-27 Listed $165,000 MLS PIN
- 2009-09-24 Sold (MLS) $38,000 MLS PIN
- 2009-08-28 Contingent — MLS PIN
- 2009-08-05 Listed $44,900 MLS PIN
Cash-flow waterfall
monthlySold comps — $/sqft
last 12 mo · ≤1 miLoading sold comps…