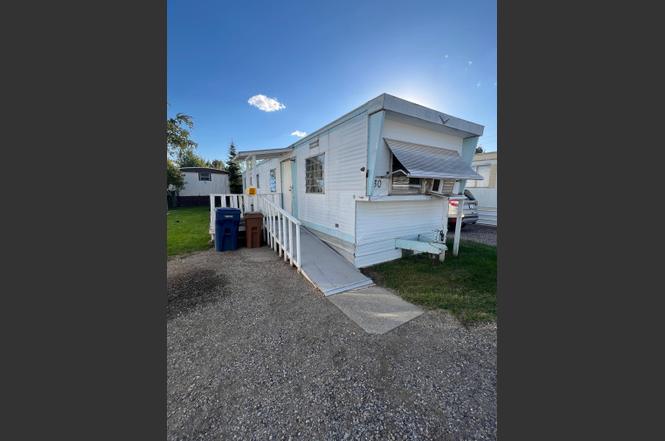
6417 N Cincinnati St #30 · Spokane, WA
Flood risk 1/10 · Minimal
- FEMA flood zone
- X (unshaded)
- Chance of flooding over 30 yrs
- 0.0%
- Est. flood insurance / yr
- $507 – $1,088
Fire risk 2/10 · Minimal
- Est. fire insurance / yr
- $604 – $1,122
Heat risk 3/10 · Minor
- Hot days now (above 94°F)
- 7 days/yr
- Hot days in 30 yrs
- 14 days/yr
Wind risk 1/10 · Minimal
- Chance of severe wind over 30 yrs
- —
Air-quality risk 10/10 · Severe
- Unhealthy air days now
- 19 days/yr
- Unhealthy air days in 30 yrs
- 21 days/yr
Risk factors via First Street. Map © Google.
Why this score? — see what drove the D+ grade
The composite is a weighted blend of 9 inputs, each scored 0–100. Each bar is that input's sub-score; the figure is the points it added to the 100-point composite (weight × sub-score).
- Cash flow +15.0/30.0
- ARV discount +7.5/15.0
- 1% rule +5.0/10.0
- DSCR +5.0/10.0
- Schools +4.6/10.0
- Livability +4.0/5.0
- Rent growth +2.6/5.0
- Condition / age +2.5/5.0
- Appreciation +0.0/10.0
$15,000
🖨 Deal sheet (PDF) 📄 Offer letter ✓ Due diligence
Listing remarks
2 bed 1 bath fixer in quiet mobile home park. Great opportunity to build equity quickly. The park is near shopping, medical, restaurants and bus routes. Com see for yourself
Key facts
- Near bus routes
- Near shopping
- Near restaurants
Tags
Property features AI
Finance
- Financial info: Annual tax amount: $213
- HOA & community: Located in a senior community (Ponderosa); Land lease: $445
Exterior
- Parking: Off-site parking
- Utilities: High-speed internet available (any provider)
- Home design: Manufactured home; Single-level (manufactured house); Skirted with tie downs; Entry on private road
- Construction: Steel frame construction; Flat metal roof; Slab and block foundation
- Exterior features: Level site; City bus service within six blocks; Private, paved road frontage
Interior
- Kitchen: Free-standing range; Refrigerator
- Bedrooms: 2 bedrooms
- Heating & cooling: Natural gas forced air heating; Window unit(s) for cooling
- Interior features: Free-standing range; Refrigerator; No basement
Neighborhood map
What this means for you Summary
Snapshot
- This is a 2-bed/1.0-bath manufactured listed at $15k.
Deal economics
- At list price, monthly cash flow is $886 ($11k/yr) — positive.
- The deal already cash-flows at list — no discount required.
- Meets the 1% rule at list price ($1k rent vs $15k).
- Recommended offer: $14k (6.0% below list) — sets the bar for market timing.
- Cap rate 77.2% vs local median 3.2% in Spokane — top-decile yield for the area; either an underpriced asset or a hidden risk that comps aren't pricing in. Stress-test before assuming the spread holds.
Location & tenants
- Location reads 80/100 on livability (#93 in WA, #1,822 nationally) — a professional / high-income tenant draw. Strengths: amenities A+, commute A+, housing A+; Watch: crime F.
- Spokane School District (urban): math 47% / reading 58% proficiency, ranked #136 of 291 in WA (top 47%) — acceptable for families but not a draw, mixed tenant base, ~2y average lease.
- Zoned schools: Arlington Elementary (399 students, 84% FRL); Garry Middle School (569 students, 88% FRL); Rogers High School (1,536 students, 83% FRL) — zoned schools average 85% FRL vs 50% district-wide (35 pts higher); higher-poverty schools than district average — tighter screening recommended.
- Market conditions: Rents flat; 466 active listings in the ZIP; 32 comparable units currently listed for rent nearby; rentals at typical pace (median 25d on market — plan ~3-4 weeks tenant-placement turnaround); solid renter incomes; 3,608 units permitted in Spokane County in 2024 (1,792 in 5+ unit buildings).
- This rent is only 17% of the median local income ($89k/yr) — well below the 30% rent-burden line; pricing power to push rent on renewal without tenant pushback.
Forward outlook
- Local home prices are declining (-3.0%/yr); year-one equity from $104 of loan paydown is wiped out by about $450 of value loss. Plan a longer hold.
- Spokane County population projected at +13% by 2050 — modest demand growth; plan on rents tracking national, not racing it.
- At projected returns (-3.0% appreciation + 0.5% rent growth), your $4k cash investment doubles in ~1 year — after that, you're playing with house money.
Negotiation context
- It's been on market 84 days — a 6% lower offer ($14k) is reasonable based on typical stale-listing flexibility.
- 2 sale attempts; this cycle's ask has dropped $2k (14%) from the opening price — seller is motivated, your offer sets the floor, not the list.
Questions for the listing agent
- It's been on market 84 days. Have you received any prior offers? Is the seller open to a 6% concession, seller financing, or rate buy-down credit?
- Built in 1962 — when were the roof, HVAC, electrical panel, plumbing, and water heater last replaced?
- Why hasn't it sold? Are there any deal-killer items the seller is aware of (foundation, flood, title, zoning, code violations)?
- Is there a deadline driving the sale (1031 exchange, divorce, estate, relocation)? That informs how much negotiation room exists.
- Schools are B-rated — typically a magnet for longer-tenancy family renters. What's the average tenant stay here, and is there a school-zone premium baked into asking?
- Crime grade is F in this area — have there been break-ins, vandalism, or insurance claims at this property in the last 3 years? What carrier currently insures it and at what premium?
- The area grade is low — what's the realistic commute time and amenity access for the typical tenant pool here? Any planned neighborhood developments (good or bad) we should know about?
- What's the average days-on-market for RENTAL listings here right now (not sales)? A rising rental-DOM trend means longer vacancies and softer asking-rent achievability than the comps imply.
- What's the recent tenant-quality profile in this submarket — average credit score on applications, eviction rate, late-payment / NSF rate, and stable-employment percentage? A property-management company in the area should have these aggregated.
- How much new for-sale + rental construction is in the pipeline within 1–3 miles? Heavy new supply typically softens prices + rents 12–24 months out; constrained supply supports both.
Investment metrics
- 1% rule
- 8.34% ✓
- Cap rate
- 77.19%
- Cash-on-cash
- 253.20%
- DSCR
- 12.27
- GRM
- 1.0
CMA / ARV
No comps found within radius.
Projected returns pro-forma
-3.0% appreciation · 0.46% rent growth · sell at horizon
- IRR
- —
- Equity multiple
- 13.12×
- Total profit
- $50,910
- Equity at exit
- $2,237
- IRR
- —
- Equity multiple
- 25.98×
- Total profit
- $104,917
- Equity at exit
- $1,297
Cash invested: $4,200 (down + closing). Projections, not guarantees.
Landlord ↔ Tenant lean methodology
- Overall (STATE)
- 28 Tenant-Leaning
- State Washington
- 28 Tenant-Leaning · D+8
- County
- — inherits STATE
- City
- — inherits STATE
ZIP-level market 99208
- Rents YoY
- 0.5%
- Active inventory
- 466
- Price-to-rent
- 1.0×
Monthly cashflow live
- Estimated rent
- $1,252 high interval (Pro) →
- Mortgage (P&I)
- −$79
- Tax from tax record
- −$18 /mo · $213/yr
- Insurance
- −$6
- HOA
- −$0
- Vacancy / Maint / Mgmt
- −$263
- Net cashflow
- $886
Break-even live
Sensitivity live
| Price | -10% $895 | -5% $890 | +0% $886 | +5% $882 | +10% $878 |
|---|---|---|---|---|---|
| Rent | -10% $787 | -5% $837 | +0% $886 | +5% $936 | +10% $985 |
| Rate | -1.0pp $894 | -0.5pp $890 | base $886 | +0.5pp $882 | +1.0pp $878 |
UW: 25.0% down · 7.5% · 30yr · 1.5% tax · 5.0% vac · 8.0% maint · 8.0% mgmt
Financing live
Cash to close
- Down payment
- $3,750
- Closing costs
- $450
- Reserves months
- —
- Total cash needed
- —
Loan-product check · same deal, 3 products live
Conventional
25% down · 7.5% · 30yr
- Down + closing
- —
- Monthly P&I
- —
- Monthly cashflow
- —
- DSCR
- —
- Eligible?
- —
Personal DTI + credit; lowest rate.
DSCR
20% down · 8.5% · 30yr
- Down + closing
- —
- Monthly P&I
- —
- Monthly cashflow
- —
- DSCR
- —
- Eligible?
- —
No personal income docs; deal must DSCR.
Hard money
10% down · 12.0% · 12mo
- Down + closing
- —
- Monthly P&I
- —
- Monthly cashflow
- —
- DSCR
- —
- Eligible?
- —
Short-term bridge; refi at stabilization.
Rent comps 32 comps
| Address | Beds | Baths | Sqft | Rent | $/sqft | DOM | Units | Dist |
|---|---|---|---|---|---|---|---|---|
| 617 E Houston Ave Unit HH340 Spokane, WA | 2.0 | 1.0 | 710 | $1,100 | $1.55 | 15d | 1 | 0.01mi |
| 617 E Houston Ave Unit HH301 Spokane, WA | 1.0 | 1.0 | 510 | $950 | $1.86 | 25d | 1 | 0.01mi |
| 6603 N Standard St Unit 6605 Spokane, WA | 2.0 | 1.0 | 750 | $1,200 | $1.60 | 25d | 1 | 0.12mi |
| 910 E Holyoke Ave Spokane, WA | 1.0–2.0 | 1.0 | 755 | $1,425 | $1.89 | 15d | 4 | 0.12mi |
| 901 E Holyoke Ave Spokane, WA | 1.0 | 1.0 | 588 | $1,075 | $1.83 | 25d | 3 | 0.15mi |
| 6980 N Nevada St Spokane, WA | 1.0–2.0 | 1.0 | 622 | $1,383 | $2.22 | 25d | 1 | 0.39mi |
| 121 E Wedgewood Ave Spokane, WA | 1.0–3.0 | 1.0–1.5 | 833 | $1,205 | $1.45 | 15d | 17 | 0.43mi |
| 6123 N Colton St Unit 2 Spokane, WA | 1.0 | 1.0 | 450 | $900 | $2.00 | 22d | 1 | 0.45mi |
| 6123 N Colton St Apt 1 Spokane, WA | 1.0 | 1.0 | 450 | $999 | $2.22 | 25d | 1 | 0.45mi |
| 6123 N Colton St Spokane, WA | 1.0 | 1.0 | 450 | $999 | $2.22 | 15d | 2 | 0.45mi |
| 1015 E Cozza Dr Unit 65 Spokane, WA | 1.0 | 1.0 | 660 | $1,065 | $1.61 | 15d | 1 | 0.53mi |
| 1015 E Cozza Dr Unit 41 Spokane, WA | 1.0 | 1.0 | 660 | $1,065 | $1.61 | 25d | 1 | 0.53mi |
| 6029 N Mayfair St Unit 7 Spokane, WA | 1.0 | 1.0 | 725 | $1,025 | $1.41 | 15d | 1 | 0.53mi |
| 6018 N Ruby St #8 Spokane, WA | 2.0 | 1.0 | 600 | $995 | $1.66 | 15d | 1 | 0.57mi |
| 1015 E Cozza Dr Unit 165 Spokane, WA | 1.0 | 1.0 | 660 | $1,010 | $1.53 | 15d | 1 | 0.57mi |
| 1015 E Cozza Dr Unit 160 Spokane, WA | 1.0 | 1.0 | 660 | $1,010 | $1.53 | 25d | 1 | 0.58mi |
| 1015 E Cozza Dr Unit 167 Spokane, WA | 1.0 | 1.0 | 660 | $1,050 | $1.59 | 25d | 1 | 0.58mi |
| 6601 N Atlantic St Unit 6625 Spokane, WA | 2.0 | 1.0 | 697 | $1,000 | $1.43 | 15d | 1 | 0.65mi |
| 1011 E Sharpsburg Ave Unit 574 Spokane, WA | 1.0 | 1.0 | 660 | $1,065 | $1.61 | 25d | 1 | 0.68mi |
| 7001 N Atlantic St Spokane, WA | 1.0 | 1.0 | 600 | $995 | $1.66 | 25d | 1 | 0.71mi |
| 7808 N Morton St Unit 631 Spokane, WA | 1.0 | 1.0 | 660 | $1,050 | $1.59 | 25d | 1 | 0.91mi |
| 1712 E Sanson Ave Unit 1 Spokane, WA | 1.0 | 1.0 | 520 | $995 | $1.91 | 25d | 1 | 1.02mi |
| 8424 N Nevada St Unit 54 Spokane, WA | 1.0 | 1.0 | 660 | $1,050 | $1.59 | 25d | 1 | 1.24mi |
| 8424 N Nevada St Unit 412 Spokane, WA | 1.0 | 1.0 | 660 | $1,010 | $1.53 | 45d | 1 | 1.24mi |
| 8424 N Nevada St Apt 314 Spokane, WA | 1.0 | 1.0 | 660 | $1,065 | $1.61 | 45d | 1 | 1.24mi |
| 8424 N Nevada St Unit 308 Spokane, WA | 1.0 | 1.0 | 660 | $1,065 | $1.61 | 25d | 1 | 1.24mi |
| 636 E Magnesium Rd Spokane, WA | 1.0–3.0 | 1.0–3.0 | 1053 | $1,780 | $1.69 | 15d | 12 | 1.30mi |
| 401 E Magnesium Rd Spokane, WA | 1.0–2.0 | 1.0 | 730 | $1,290 | $1.77 | 45d | 4 | 1.41mi |
| 20 E Pineridge Ct Spokane, WA | 1.0 | 1.0 | 625 | $1,375 | $2.20 | 25d | 2 | 1.41mi |
| 6105 N Regal St Unit B Spokane, WA | 2.0 | 1.5 | 600 | $1,295 | $2.16 | 15d | 1 | 1.44mi |
| 8719 N Hill N Dale St Spokane, WA | 1.0–3.0 | 1.0–1.5 | 850 | $1,356 | $1.59 | 15d | 8 | 1.45mi |
| 849 E Magnesium Rd Spokane, WA | 1.0–3.0 | 1.0–2.0 | 931 | $1,512 | $1.62 | 15d | 6 | 1.49mi |
Listing history 5 events
-
2026-05-21status Pending
-
2026-05-01price $15,000
-
2026-02-27$17,500 Active
-
2025-12-31historical
-
2025-09-25$20,000 Active
ⓘ Source: listings_history table (triggers on properties + properties_extension) + one-shot
backfill from property_details.listing_events for pre-trigger history.
Tax reassessment forecast WA · Resets to sale price
- Current annual tax
- $213 · $18/mo
- Projected year-2 tax
- $213 · $18/mo
- Expected delta
- $0/yr ($0/mo · 0.0%)
ⓘ Screening estimate from a state-policy table — verify with the county assessor before closing.
Climate risk First Street
- Flood 1/10 Low FEMA zone X (unshaded) · 0% chance over 30 yrs
- Wildfire 2/10 Low
- Heat 3/10 Moderate 7 d/yr ≥94°F today · 14 d/yr by 30 yrs out
- Wind 1/10 Low
- Air quality 10/10 Extreme 19 unhealthy d/yr today · 21 by 30 yrs out
Nearby sold comps map
Loading sold comps map…
Walkable amenities ~0.75 mi
Loading nearby amenities…
Taxation est. · year 1
- Rental income
- $15,021
- − Mortgage interest
- −$840
- − Property taxes
- −$213
- − Insurance
- −$75
- − Repairs & maintenance
- −$1,202
- − Management
- −$1,202
- − Depreciation
- −$436
- Taxable income
- $11,053
- Est. tax owed @ 24.0%
- −$2,653
- After-tax cash flow
- $7,982/yr
For passive investors: Depreciation is non-cash, so a rental often shows a tax loss while cash-flowing — sheltering income. Rental losses are passive: they offset passive income freely, and up to $25,000/yr can offset ordinary (W-2) income if you actively participate and your MAGI is under $100k (phasing out to $0 by $150k); unused losses carry forward. On sale, claimed depreciation is recaptured at up to 25%, and gains may owe capital-gains tax (a 1031 exchange can defer both). Figures are a year-1 estimate at your 24.0% rate — not tax advice; consult a CPA.
Schools (NCES district)
- District
- Spokane School District
- NCES district ID
- 5308250
- Math proficiency
- 47% ▲ 1.00%
- Reading proficiency
- 58% ▲ 1.00%
- Median HH income
- $43,187
- Composite
- 46.1/100
- National rank
- #5477
- State rank
- #136 of 291 in WA
Livability — Spokane
- Score
- 80/100
- State rank
- #93
- US rank
- #1822
Category grades
Schools grade is shown separately in the Schools card above.
Census & demographics
- Census place
- Spokane, WA
- County
- Spokane County · 496,401 people
- City population
- 298,820
- Metro
- Spokane-Spokane Valley, WA
- Population (ZIP)
- 58,669
- Household income
- $88,599
- Rent vs Own
- Severe rent burden
- 1832.0
Population outlook (Spokane County) Hauer SSP2
- Today (2025)
- 531,314 people
- By 2030
- 549,278 · +3.4%
- By 2040
- 577,822 · +8.8%
- By 2050
- 598,188 · +12.6%
- By 2075
- 630,744 · +18.7%
- By 2100
- 622,360 · +17.1%
Race, ethnicity, and origin ACS 2023
- Neighborhood character
- Predominantly White (83%)
- Race & ethnicity
- White 83% Two or more races 7% Hispanic / Latino 5% Black 2% Asian 2% Pacific Islander 1%
- Hispanic origin (detail)
- Mexican 4%
- Common ancestry
- Portuguese 4% Italian 2% Lithuanian 2%
- Foreign-born
- 6% · Canada, China
- Languages at home
- 93% English-only · Spanish 2% Russian/Polish/Slavic 1% Other Asian/Pacific 1%
Political lean MEDSL · Spokane
- 2024 margin
- Toss-up / Even · D 46.0% · R 51.0% · Other 3.0%
- 2008→2024 swing
- -3.8pp toward R · 2008: -1.1pp · 2024: -5.0pp
- All cycles
- 2024: R+5.0 2020: R+4.3 2016: R+8.3 2012: R+6.3 2008: R+1.1
Not yet ingested
- Civics
- —
Market trends
- HPI YoY
- ▼ -392.58%
- Current HPI
- 324.2299
- Rent YoY
- ▲ 0.46%
- Metro
- Spokane-Spokane Valley, WA
- State GDP YoY
- ▲ 4.65%
- F500 in state
- 22
Industry mix (Fortune 500 HQ in WA)
| Industry | F500 HQs | Revenue |
|---|---|---|
| Retail | 2 | $269B |
|
||
| Technology / Retail | 1 | $638B |
|
||
| Technology | 1 | $245B |
|
||
| Telecommunications | 1 | $38B |
|
||
| Food / Beverage | 1 | $36B |
|
||
| Automotive / Trucks | 1 | $34B |
|
||
Price history
-25.0% since first listed5 events — show timeline
- 2026-05-21 Pending — SPOKANEMLS as Distributed by MLS Grid
- 2026-05-01 Price Changed $15,000 SPOKANEMLS as Distributed by MLS Grid
- 2026-02-27 Listed $17,500 SPOKANEMLS as Distributed by MLS Grid
- 2025-12-31 Listing Removed — SPOKANEMLS as Distributed by MLS Grid
- 2025-09-25 Listed $20,000 SPOKANEMLS as Distributed by MLS Grid
Property tax history
+20.7%/yrLatest (2026): $213 · +27.4% YoY. Source: county tax records.
Cash-flow waterfall
monthlySold comps — $/sqft
last 12 mo · ≤1 miLoading sold comps…