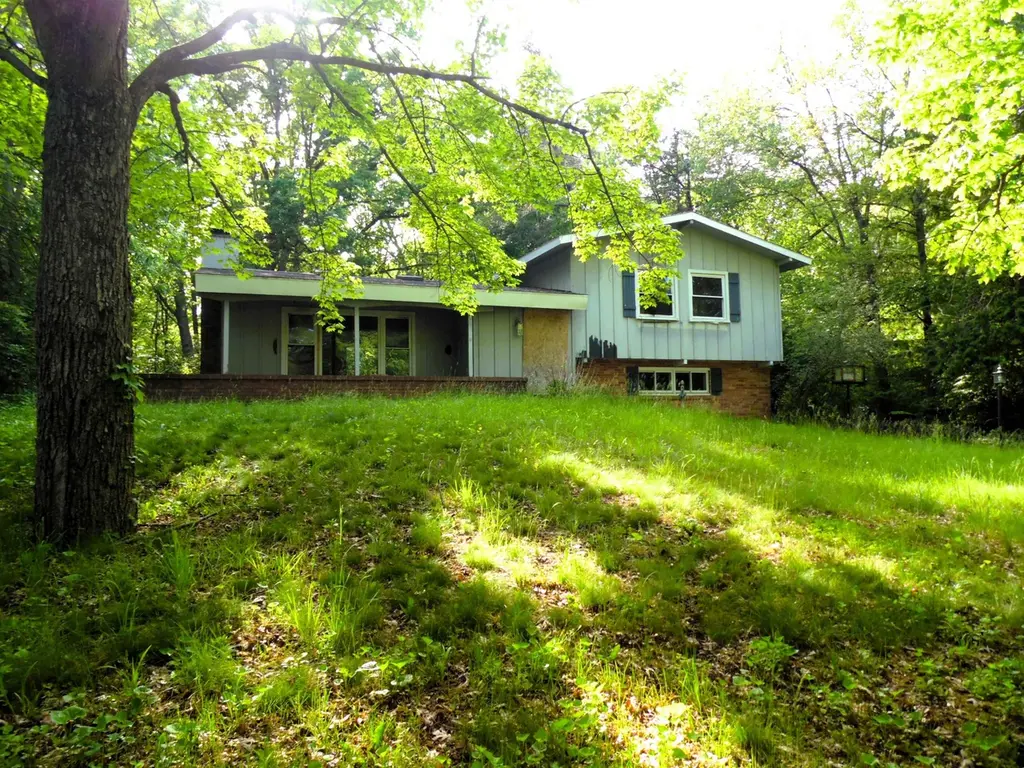
5207 Sturgeon Ave · Midland, MI
Flood risk 1/10 · Minimal
- FEMA flood zone
- X (shaded)
- Chance of flooding over 30 yrs
- 0.0%
- Est. flood insurance / yr
- $473 – $860
Fire risk 1/10 · Minimal
- Est. fire insurance / yr
- $784 – $1,456
Heat risk 2/10 · Minimal
- Hot days now (above 98°F)
- 7 days/yr
- Hot days in 30 yrs
- 14 days/yr
Wind risk 1/10 · Minimal
- Chance of severe wind over 30 yrs
- —
Air-quality risk 2/10 · Minimal
- Unhealthy air days now
- 1 days/yr
- Unhealthy air days in 30 yrs
- 2 days/yr
Risk factors via First Street. Map © Google.
Why this score? — see what drove the B- grade
The composite is a weighted blend of 9 inputs, each scored 0–100. Each bar is that input's sub-score; the figure is the points it added to the 100-point composite (weight × sub-score).
- Cash flow +27.9/30.0
- DSCR +9.9/10.0
- 1% rule +8.3/10.0
- ARV discount +7.5/15.0
- Schools +4.9/10.0
- Livability +4.2/5.0
- Rent growth +2.5/5.0
- Condition / age +2.5/5.0
- Appreciation +0.0/10.0
$124,900
🖨 Deal sheet 📄 Offer letter ✓ Due diligence
Listing remarks
TLC on Sturgeon-handyman special. Priced a little over SEV, home was gutted after a fire and being prepared for re-construction. Beautiful location; large mature oaks surround the half acre yard. Back yard completely fenced. Attached 2 car garage. CASH ONLY or Construction loan-selling as is.
Key facts
- Half acre yard
- Large mature oaks
- 0.59 acre lot
Tags
Property features AI
Finance
- Other: Property sits on approximately 0.59 acre; Frontage approximately 120 feet; Road access: city/county paved, year-round; Zoning: Residential; Flood insurance / floodplain unknown
Exterior
- Parking: Attached 2-car garage (20 x 22); Additional parking for 3+ spaces
- Utilities: Public water; Public sanitary sewer; Electricity connected; Natural gas available and connected; Cable available; Phone available; Internet DSL and fiber available (Hard line, Spectrum); Water heater: None listed
- Home design: Tri-level residence; Residential property; Built in 1968; Below-grade finished area listed as none (unfinished basement)
- Construction: Basement foundation; Basement present (unfinished, block foundation); Brick and vinyl siding construction
- Exterior features: Brick and vinyl siding; Exterior balcony; Deck; Patio; Porch; Garden area; Fenced yard (owned); Shed and garage outbuildings; Park / greenbelt view; Subdivision with sidewalks; Wooded, treed lot; Deep lot (150+ ft) and large lot (65+ ft)
Interior
- Kitchen: No appliances included
- Bedrooms: Main-level bedroom (12 x 14); Main-level bedroom (12 x 10); Main-level bedroom (approx. 10 wide)
- Flooring: Bedroom floors: Other
- Bathrooms: Three full bathrooms; Main floor full bathroom; Basement bathroom
- Heating & cooling: Natural gas heat; Supplemental wood heat; Cooling: None listed; Heating system: See remarks / other
- Interior features: 9+ foot ceilings; Cathedral / vaulted ceiling; Skylights; Cable / internet available; DSL available
- Laundry & utility: Basement with interior access and sump pump (unfinished)
Neighborhood map
What this means for you Summary
Snapshot
- This is a 3-bed/1.0-bath single-family listed at $125k.
Deal economics
- At list price, monthly cash flow is $385 ($5k/yr) — positive.
- The deal already cash-flows at list — no discount required.
- Meets the 1% rule at list price ($2k rent vs $125k).
- Cap rate 10.0% vs local median 4.4% in Midland — top-decile yield for the area; either an underpriced asset or a hidden risk that comps aren't pricing in. Stress-test before assuming the spread holds.
Location & tenants
- Location reads 85/100 on livability (#28 in MI, #578 nationally) — a professional / high-income tenant draw. Strengths: crime A+, cost of living A+, housing A+; Watch: commute F.
- Midland Public Schools (urban): math 49% / reading 64% proficiency, ranked #62 of 540 in MI (top 12%) — acceptable for families but not a draw, mixed tenant base, ~2y average lease.
- Zoned schools: Woodcrest Elementary School (math 59% / reading 64%, grade B, #188 of 1,397 statewide, top 13%, 586 students, 30% FRL); Hh Dow High School (math 63% / reading 79%, grade B+, #31 of 713 statewide, top 4%, 1,268 students, 21% FRL) — zoned schools at 25% FRL track the district average.
- Market conditions: 110 active listings in the ZIP; solid renter incomes; 320 units permitted in Midland County in 2024 (204 in 5+ unit buildings).
Forward outlook
- Local home prices are declining (-3.0%/yr); year-one equity from $864 of loan paydown is wiped out by about $4k of value loss. Plan a longer hold.
- Midland County population projected to shrink 9% by 2050 — rents likely to lag national; underwrite the cash flow, not the appreciation.
- At projected returns (-3.0% appreciation + 3.0% rent growth), your $35k cash investment doubles in ~9 years — after that, you're playing with house money.
Negotiation context
- Only 6 days on market — expect competitive offers; lowballing is unlikely to land.
- Current owner paid $90k; 39% above their basis — modest negotiation headroom, anchor on the comps not their cost.
Questions for the listing agent
- Built in 1968 — when were the roof, HVAC, electrical panel, plumbing, and water heater last replaced?
- Is there a deadline driving the sale (1031 exchange, divorce, estate, relocation)? That informs how much negotiation room exists.
- Schools are A-rated — typically a magnet for longer-tenancy family renters. What's the average tenant stay here, and is there a school-zone premium baked into asking?
- What's the average days-on-market for RENTAL listings here right now (not sales)? A rising rental-DOM trend means longer vacancies and softer asking-rent achievability than the comps imply.
- What's the recent tenant-quality profile in this submarket — average credit score on applications, eviction rate, late-payment / NSF rate, and stable-employment percentage? A property-management company in the area should have these aggregated.
- How much new for-sale + rental construction is in the pipeline within 1–3 miles? Heavy new supply typically softens prices + rents 12–24 months out; constrained supply supports both.
Investment metrics
- 1% rule
- 1.33% ✓
- Cap rate
- 9.99%
- Cash-on-cash
- 13.21%
- DSCR
- 1.59
- GRM
- 6.3
CMA / ARV
- ARV (on-the-fly)
- $277,695
- Comps found
- 12
Show comp detail 12 sales within ~0.75 mi
| Address | Dist | Beds/Ba | Sqft | Sold | Price | $/sf | Match |
|---|---|---|---|---|---|---|---|
| 4905 Sturgeon Creek Pkwy | 0.26mi | 4/2.0 (+1) | 1,936 (+7%) | 2mo | $260,000 | $134 | 66 |
| 4910 Sturgeon Creek Pkwy | 0.22mi | 3/2.0 | 2,048 (+13%) | 3mo | $288,000 | $141 | 62 |
| 5113 Christie Ct | 0.41mi | 4/2.0 (+1) | 1,860 (+2%) | 11mo | $191,500 | $103 | 59 |
| 4911 Sturgeon Creek Pkwy | 0.26mi | 3/2.0 | 1,596 (-12%) | 7mo | $289,000 | $181 | 58 |
| 3819 Haskin Dr | 0.36mi | 3/1.5 | 1,576 (-13%) | 8mo | $244,000 | $155 | 53 |
| 4914 Natalie Ct | 0.53mi | 3/2.5 | 1,700 (-6%) | 9mo | $298,500 | $176 | 51 |
| 2707 Valorie Ln | 0.36mi | 4/1.5 (+1) | 2,048 (+13%) | 8mo | $235,000 | $115 | 49 |
| 3716 Haskin Dr | 0.29mi | 4/2.0 (+1) | 2,047 (+13%) | 15mo | $300,000 | $147 | 44 |
| 5009 Campau Dr | 0.64mi | 3/2.0 | 1,958 (+8%) | 14mo | $255,000 | $130 | 42 |
| 4109 Moorland Dr | 0.58mi | 4/3.0 (+1) | 1,896 (+4%) | 14mo | $289,900 | $153 | 41 |
| 4907 Campau Dr | 0.66mi | 4/3.0 (+1) | 1,741 (-4%) | 14mo | $280,000 | $161 | 38 |
| 5900 Perrine Rd | 0.62mi | 4/3.0 (+1) | 1,700 (-6%) | 16mo | $260,000 | $153 | 34 |
Match score weights: distance 35% · size 25% · config 20% · recency 20%. Top-matched comps best support the ARV.
Projected returns pro-forma
-3.0% appreciation · 3.0% rent growth · sell at horizon
- IRR
- 3.2%
- Equity multiple
- 1.12×
- Total profit
- $4,338
- Equity at exit
- $18,623
- IRR
- 12.8%
- Equity multiple
- 2.02×
- Total profit
- $35,607
- Equity at exit
- $10,799
Cash invested: $34,972 (down + closing). Projections, not guarantees.
Landlord ↔ Tenant lean methodology
- Overall (STATE)
- 62 Landlord-Friendly
- State Michigan
- 62 Landlord-Friendly · EVEN
- County
- — inherits STATE
- City
- — inherits STATE
ZIP-level market 48640
- Home prices YoY
- -21.7%
- Active inventory
- 110
- Price-to-rent
- 6.3×
Monthly cashflow live
- Estimated rent
- $1,664 medium interval (Pro) →
- Mortgage (P&I)
- −$655
- Tax from tax record
- −$223 /mo · $2,674/yr
- Insurance
- −$52
- HOA
- −$0
- Vacancy / Maint / Mgmt
- −$349
- Net cashflow
- $385
Break-even live
UW: 25.0% down · 7.5% · 30yr · 1.5% tax · 5.0% vac · 8.0% maint · 8.0% mgmt
Financing live
Cash to close
- Down payment
- $31,225
- Closing costs
- $3,747
- Reserves months
- —
- Total cash needed
- —
Loan-product check · same deal, 3 products live
Conventional
25% down · 7.5% · 30yr
- Down + closing
- —
- Monthly P&I
- —
- Monthly cashflow
- —
- DSCR
- —
- Eligible?
- —
Personal DTI + credit; lowest rate.
DSCR
20% down · 8.5% · 30yr
- Down + closing
- —
- Monthly P&I
- —
- Monthly cashflow
- —
- DSCR
- —
- Eligible?
- —
No personal income docs; deal must DSCR.
Hard money
10% down · 12.0% · 12mo
- Down + closing
- —
- Monthly P&I
- —
- Monthly cashflow
- —
- DSCR
- —
- Eligible?
- —
Short-term bridge; refi at stabilization.
Listing history 5 events
-
2026-06-10status $124,900 Pending 6 DOM
-
2026-06-09days on market $124,900 Active 6 DOM
-
2026-06-08days on market $124,900 Active 5 DOM
-
2026-06-07remarks 293-char remark
-
2026-06-07$124,900 Active 4 DOM
ⓘ Source: listings_history table (triggers on properties + properties_extension) + one-shot
backfill from property_details.listing_events for pre-trigger history.
Tax reassessment forecast MI · Partial reset (capped growth)
- Current annual tax
- $2,674 · $223/mo
- Projected year-2 tax
- $2,674 · $223/mo
- Expected delta
- $0/yr ($0/mo · 0.0%)
ⓘ Screening estimate from a state-policy table — verify with the county assessor before closing.
Climate risk First Street
- Flood 1/10 Low FEMA zone X (shaded) · 0% chance over 30 yrs
- Wildfire 1/10 Low
- Heat 2/10 Low 7 d/yr ≥98°F today · 14 d/yr by 30 yrs out
- Wind 1/10 Low
- Air quality 2/10 Low 1 unhealthy d/yr today · 2 by 30 yrs out
Nearby sold comps map
Loading sold comps map…
Walkable amenities ~0.75 mi
Loading nearby amenities…
Taxation est. · year 1
- Rental income
- $19,970
- − Mortgage interest
- −$6,996
- − Property taxes
- −$2,674
- − Insurance
- −$624
- − Repairs & maintenance
- −$1,598
- − Management
- −$1,598
- − Depreciation
- −$3,633
- Taxable income
- $2,847
- Est. tax owed @ 24.0%
- −$683
- After-tax cash flow
- $3,935/yr
For passive investors: Depreciation is non-cash, so a rental often shows a tax loss while cash-flowing — sheltering income. Rental losses are passive: they offset passive income freely, and up to $25,000/yr can offset ordinary (W-2) income if you actively participate and your MAGI is under $100k (phasing out to $0 by $150k); unused losses carry forward. On sale, claimed depreciation is recaptured at up to 25%, and gains may owe capital-gains tax (a 1031 exchange can defer both). Figures are a year-1 estimate at your 24.0% rate — not tax advice; consult a CPA.
Schools (NCES district)
- District
- Midland Public Schools
- NCES district ID
- 2623820
- Math proficiency
- 49% ▼ -6.00%
- Reading proficiency
- 64% ▼ -3.00%
- Median HH income
- $55,844
- Composite
- 48.67/100
- National rank
- #2105
- State rank
- #62 of 540 in MI
Livability — Midland
- Score
- 85/100
- State rank
- #28
- US rank
- #578
Category grades
Schools grade is shown separately in the Schools card above.
Census & demographics
- Census place
- Midland, MI
- County
- Midland County · 66,531 people
- Metro
- Midland, MI
- Population (ZIP)
- 32,492
- Household income
- $80,574
- Rent vs Own
- Severe rent burden
- 939.0
Population outlook (Midland County) Hauer SSP2
- Today (2025)
- 83,968 people
- By 2030
- 83,368 · -0.7%
- By 2040
- 80,713 · -3.9%
- By 2050
- 76,698 · -8.7%
- By 2075
- 67,617 · -19.5%
- By 2100
- 57,529 · -31.5%
Race, ethnicity, and origin ACS 2023
- Neighborhood character
- Predominantly White (90%)
- Race & ethnicity
- White 90% Two or more races 5% Hispanic / Latino 4% Asian 1% Black 1%
- Common ancestry
- Romanian 7% Lithuanian 4% Italian 3%
- Foreign-born
- 3% · Canada, South Korea, China
- Languages at home
- 97% English-only · Spanish 1% Other Indo-European 1% German/W. Germanic 1%
Political lean MEDSL · Midland
- 2024 margin
- R (+15.2) · D 41.6% · R 56.8% · Other 1.6%
- 2008→2024 swing
- -11.6pp toward R · 2008: -3.6pp · 2024: -15.2pp
- All cycles
- 2024: R+15.2 2020: R+14.6 2016: R+19.4 2012: R+15.5 2008: R+3.6
Not yet ingested
- Civics
- —
Market trends
- HPI YoY
- ▼ -63.88%
- Current HPI
- 230.5702
- Rent YoY
- —
- Metro
- Midland, MI
- State GDP YoY
- ▲ 1.37%
- F500 in state
- 28
Industry mix (Fortune 500 HQ in MI)
| Industry | F500 HQs | Revenue |
|---|---|---|
| Automotive Parts | 3 | $48B |
|
||
| Automotive | 2 | $372B |
|
||
| Chemicals | 1 | $45B |
|
||
| Automotive Retail | 1 | $29B |
|
||
| Healthcare / Medical Devices | 1 | $23B |
|
||
| Automotive Technology | 1 | $20B |
|
||
Price history
-12.0% since first listed3 events — show timeline
- 2026-06-03 Listed $124,900 MiRealSource-MiMLS
- 2024-05-16 Sold (Public Records) $90,000 Public Records
- 2019-06-06 Sold (Public Records) $142,000 Public Records
Property tax history
+2.2%/yrLatest (2024): $2,674 · +4.9% YoY. Source: county tax records.
Cash-flow waterfall
monthlySold comps — $/sqft
last 12 mo · ≤1 miLoading sold comps…