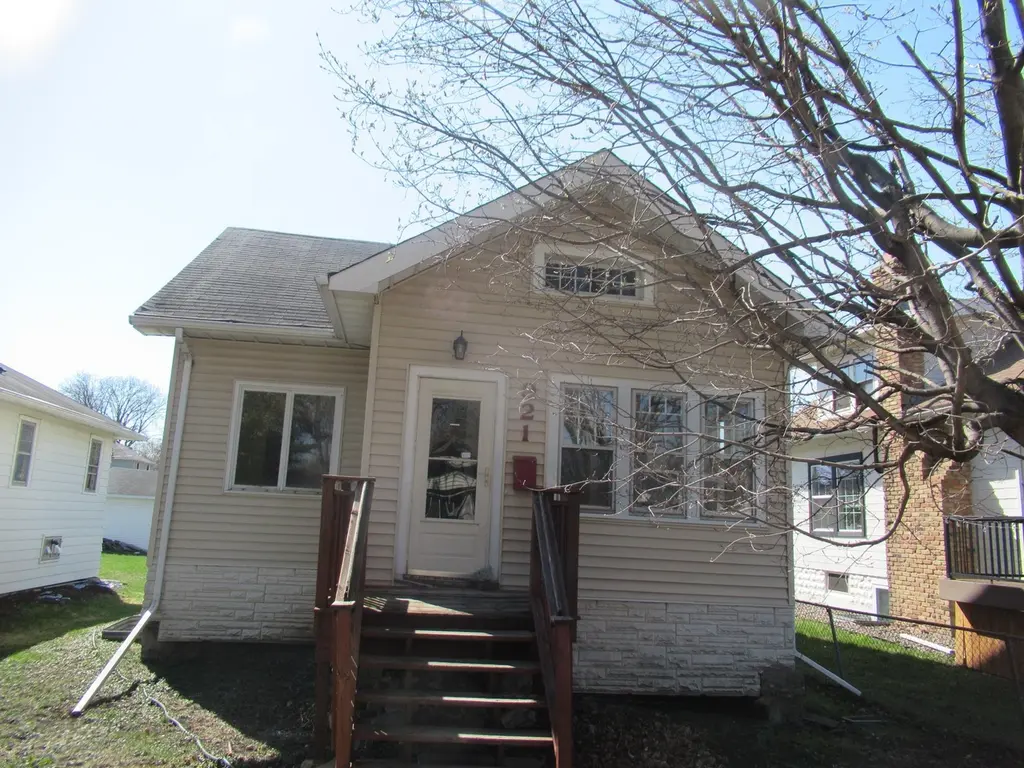
921 20th Ave SE · Minneapolis, MN
Flood risk 1/10 · Minimal
- FEMA flood zone
- X (unshaded)
- Chance of flooding over 30 yrs
- 0.0%
- Est. flood insurance / yr
- $473 – $860
Fire risk 1/10 · Minimal
- Est. fire insurance / yr
- $888 – $1,650
Heat risk 2/10 · Minimal
- Hot days now (above 100°F)
- 7 days/yr
- Hot days in 30 yrs
- 14 days/yr
Wind risk 2/10 · Minimal
- Chance of severe wind over 30 yrs
- —
Air-quality risk 2/10 · Minimal
- Unhealthy air days now
- 1 days/yr
- Unhealthy air days in 30 yrs
- 1 days/yr
Risk factors via First Street. Map © Google.
Why this score? — see what drove the C grade
The composite is a weighted blend of 9 inputs, each scored 0–100. Each bar is that input's sub-score; the figure is the points it added to the 100-point composite (weight × sub-score).
- Cash flow +18.4/30.0
- ARV discount +14.5/15.0
- DSCR +5.8/10.0
- 1% rule +5.0/10.0
- Livability +3.9/5.0
- Rent growth +3.7/5.0
- Schools +3.5/10.0
- Condition / age +2.5/5.0
- Appreciation +0.0/10.0
$245,000
🖨 Deal sheet 📄 Offer letter ✓ Due diligence
Listing remarks
Great opportunity! Hard to find 1 1/2 story home off Como Ave. 3 bedrooms and one full bath above grade and 4th bedroom and . 75 bath below grade with egress window. hardwoods, front porch, newer detached 2 car garage with extra asphalt parking. Great location near the U of M and bus line!! Priced to sell! Quick possession.
Key facts
- Extra parking
- Hardwoods
- Front porch
Tags
Property features AI
Exterior
- Parking: 2-car garage (approx. 20x22, 440 sq ft)
- Utilities: City water connected; City sewer connected; Natural gas; Electric with circuit breakers (Xcel Energy)
- Home design: Residential property; One and one-half story; City street frontage; Publicly maintained road
- Construction: Frame construction; Block foundation; Roof over 8 years old; Foundation area approximately 634
- Exterior features: Deck; Vinyl exterior; Light tree coverage nearby; Located within about 6 blocks of public transit; No fencing
Interior
- Kitchen: Kitchen with window; Kitchen and dining combined
- Bedrooms: 4 bedrooms (one on the main floor; two on the upper level; one lower level bedroom)
- Flooring: Hardwood floors
- Bathrooms: Main floor full bath; Upper level 3/4 bath
- Heating & cooling: Forced air heating; Central air conditioning
- Interior features: Main floor primary bedroom; Ceiling fan(s); Kitchen/Dining Room; Egress window(s) in basement; Partially finished basement; Main floor bedroom
- Laundry & utility: Laundry on lower level
Neighborhood map
What this means for you Summary
Snapshot
- This is a 4-bed/2.0-bath single-family listed at $245k.
Deal economics
- At list price, monthly cash flow is $229 ($3k/yr) — positive.
- The deal already cash-flows at list — no discount required.
- To meet the 1% rule (rent ≥ 1% of price), the offer needs to be $244k (0.5% below list).
- Recommended offer: $238k (3.0% below list) — sets the bar for market timing.
- Cap rate 7.4% vs local median 3.1% in Minneapolis — top-decile yield for the area; either an underpriced asset or a hidden risk that comps aren't pricing in. Stress-test before assuming the spread holds.
Location & tenants
- Location reads 78/100 on livability (#110 in MN, #2,525 nationally) — a middle-class / working-renter tenant base. Strengths: amenities A+, commute A+, housing A+; Watch: cost of living C-, crime F.
- Minneapolis Public School District (urban): math 35% / reading 46% proficiency, ranked #217 of 301 in MN (top 72%) — families likely to look elsewhere, expect single-tenant / working-renter base with shorter leases.
- Market conditions: Rents rising fast (+5.0%/yr); 87 active listings in the ZIP; 21 comparable units currently listed for rent nearby; rentals at typical pace (median 25d on market — plan ~3-4 weeks tenant-placement turnaround); 48% of comp listings sitting > 30 days — soft ceiling on asking rent; 4,651 units permitted in Hennepin County in 2024 (2,443 in 5+ unit buildings).
- At $2,438/mo this rent would consume 56% of the median local household income ($52k/yr) (locally 3687% of renters already pay >50% of income on rent) — very limited rent-growth headroom before tenants either downsize or default.
Forward outlook
- Local home prices are declining (-3.0%/yr); year-one equity from $2k of loan paydown is wiped out by about $7k of value loss. Plan a longer hold.
- Hennepin County population projected at +30% by 2050 — long-run rental-demand tailwind backs the buy-and-hold thesis.
Negotiation context
- It's been on market 51 days — a 3% lower offer ($238k) is reasonable based on typical stale-listing flexibility.
- 4 sale attempts since 26y ago; this cycle's ask has dropped $14k (5%) from the opening price — seller is motivated, your offer sets the floor, not the list.
Risks & watch-outs
- Watch-outs: built in 1918 — expect roof / HVAC / electrical / plumbing capex.
Questions for the listing agent
- It's been on market 51 days. Have you received any prior offers? Is the seller open to a 3% concession, seller financing, or rate buy-down credit?
- Built in 1918 — when were the roof, HVAC, electrical panel, plumbing, and water heater last replaced?
- Is there a deadline driving the sale (1031 exchange, divorce, estate, relocation)? That informs how much negotiation room exists.
- Crime grade is F in this area — have there been break-ins, vandalism, or insurance claims at this property in the last 3 years? What carrier currently insures it and at what premium?
- What's the average days-on-market for RENTAL listings here right now (not sales)? A rising rental-DOM trend means longer vacancies and softer asking-rent achievability than the comps imply.
- What's the recent tenant-quality profile in this submarket — average credit score on applications, eviction rate, late-payment / NSF rate, and stable-employment percentage? A property-management company in the area should have these aggregated.
- How much new for-sale + rental construction is in the pipeline within 1–3 miles? Heavy new supply typically softens prices + rents 12–24 months out; constrained supply supports both.
Investment metrics
- 1% rule
- 1.00% ✗
- Cap rate
- 7.42%
- Cash-on-cash
- 4.01%
- DSCR
- 1.18
- GRM
- 8.4
CMA / ARV
- ARV (median comp)
- $290,146
- List price
- $245,000
- Delta
- -15.56%
- Verdict
- UNDERPRICED
- Comps
- 3 within 2.0 mi
Projected returns pro-forma
-3.0% appreciation · 4.98% rent growth · sell at horizon
- IRR
- -7.8%
- Equity multiple
- 0.71×
- Total profit
- $-20,093
- Equity at exit
- $36,530
- IRR
- 4.2%
- Equity multiple
- 1.33×
- Total profit
- $22,647
- Equity at exit
- $21,183
Cash invested: $68,600 (down + closing). Projections, not guarantees.
Landlord ↔ Tenant lean methodology
- Overall (CITY)
- 34 Tenant-Leaning
- State Minnesota
- 46 Balanced · D+2
- County
- — inherits STATE
- City Minneapolis
- 34 Tenant-Leaning · D+50
ZIP-level market 55414
- Rents YoY
- 5.0%
- Active inventory
- 87
- Price-to-rent
- 8.4×
Monthly cashflow live
- Estimated rent
- $2,438 high interval (Pro) →
- Mortgage (P&I)
- −$1,285
- Tax from tax record
- −$310 /mo · $3,718/yr
- Insurance
- −$102
- HOA
- −$0
- Vacancy / Maint / Mgmt
- −$512
- Net cashflow
- $229
Break-even live
UW: 25.0% down · 7.5% · 30yr · 1.5% tax · 5.0% vac · 8.0% maint · 8.0% mgmt
Financing live
Cash to close
- Down payment
- $61,250
- Closing costs
- $7,350
- Reserves months
- —
- Total cash needed
- —
Loan-product check · same deal, 3 products live
Conventional
25% down · 7.5% · 30yr
- Down + closing
- —
- Monthly P&I
- —
- Monthly cashflow
- —
- DSCR
- —
- Eligible?
- —
Personal DTI + credit; lowest rate.
DSCR
20% down · 8.5% · 30yr
- Down + closing
- —
- Monthly P&I
- —
- Monthly cashflow
- —
- DSCR
- —
- Eligible?
- —
No personal income docs; deal must DSCR.
Hard money
10% down · 12.0% · 12mo
- Down + closing
- —
- Monthly P&I
- —
- Monthly cashflow
- —
- DSCR
- —
- Eligible?
- —
Short-term bridge; refi at stabilization.
Rent comps 21 comps
| Address | Beds | Baths | Sqft | Rent | $/sqft | DOM | Units | Dist |
|---|---|---|---|---|---|---|---|---|
| 924 17th Ave SE Minneapolis, MN | 2.0–4.0 | 1.0–2.0 | 1100 | $2,400 | $2.18 | 43d | 1 | 0.21mi |
| 1801 Talmage Ave SE Minneapolis, MN | 4.0–5.0 | 2.0 | 1800 | $2,695 | $1.50 | 1d | 2 | 0.21mi |
| 1410 Rollins Ave SE Minneapolis, MN | 2.0–3.0 | 1.0 | 1200 | $2,400 | $2.00 | 43d | 1 | 0.33mi |
| 1097 24th Ave SE Minneapolis, MN | 5.0 | 2.0 | 1584 | $2,395 | $1.51 | 43d | 1 | 0.39mi |
| 919 26th Ave SE Minneapolis, MN | 4.0 | 2.0 | 1534 | $2,750 | $1.79 | 10d | 1 | 0.40mi |
| 1015 13th Ave SE Unit 2 Minneapolis, MN | 5.0 | 2.5 | 1800 | $2,795 | $1.55 | 4d | 1 | 0.43mi |
| 1220 Brook Ave SE Minneapolis, MN | 3.0 | 1.0–3.0 | 807 | $2,362 | $2.93 | 3d | 32 | 0.43mi |
| 815 13th Ave SE Minneapolis, MN | 1.0–4.0 | 1.0–2.0 | 1171 | $2,450 | $2.09 | 43d | 46 | 0.46mi |
| 1117 SE 8th St Unit 001 Minneapolis, MN | 4.0 | 2.0 | 1800 | $2,200 | $1.22 | 3d | 1 | 0.54mi |
| 612 11th Ave SE Minneapolis, MN | 4.0 | 2.0 | 1577 | $2,800 | $1.78 | 20d | 1 | 0.65mi |
| 902 SE 9th Ave Unit 902 Minneapolis, MN | 3.0 | 1.0 | 1100 | $1,800 | $1.64 | 43d | 1 | 0.67mi |
| 721 10th Ave SE Unit B Minneapolis, MN | 3.0 | 1.0 | 1100 | $1,850 | $1.68 | 24d | 1 | 0.68mi |
| 425 13th Ave SE Minneapolis, MN | 1.0–4.0 | 1.0–2.0 | 827 | $2,302 | $2.78 | 2d | 36 | 0.68mi |
| 1215 4th St SE Unit 1 Minneapolis, MN | 3.0 | 1.0 | 1050 | $1,600 | $1.52 | 43d | 1 | 0.73mi |
| 815 SE 9th St Minneapolis, MN | 1.0–4.0 | 1.0–4.0 | 1149 | $3,125 | $2.72 | 2d | 13 | 0.77mi |
| 1000 University Ave SE Minneapolis, MN | 2.0–4.0 | 1.0–2.0 | 1136 | $3,050 | $2.68 | 24d | 9 | 0.92mi |
| 711 4th St SE Minneapolis, MN | 4.0 | 1.0–2.0 | 1667 | $3,250 | $1.95 | 43d | 51 | 0.95mi |
| 627 Pierce St NE Unit 2 Minneapolis, MN | 3.0 | 1.0 | 900 | $1,795 | $1.99 | 43d | 1 | 0.99mi |
| 515 5th Ave SE Minneapolis, MN | 3.0 | 1.0 | 1200 | $1,995 | $1.66 | 43d | 1 | 1.10mi |
| 626 NE Taylor St Unit 1 Minneapolis, MN | 3.0 | 1.0 | 1250 | $1,875 | $1.50 | 43d | 1 | 1.11mi |
| 200 University Ave SE Minneapolis, MN | 3.0 | 1.0–3.0 | 1554 | $8,035 | $5.17 | 2d | 25 | 1.39mi |
Listing history 28 events
-
2026-06-18days on market $245,000 Active 51 DOM
-
2026-06-17days on market $245,000 Active 50 DOM
-
2026-06-16days on market $245,000 Active 49 DOM
-
2026-06-15days on market $245,000 Active 48 DOM
-
2026-06-13days on market $245,000 Active 46 DOM
-
2026-06-09days on market $245,000 Active 42 DOM
-
2026-06-08days on market $245,000 Active 41 DOM
-
2026-06-07days on market $245,000 Active 40 DOM
-
2026-06-04days on market $245,000 Active 37 DOM
-
2026-06-03pricedays on market $245,000 Active 36 DOM
-
2026-06-02days on market $259,000 Active 35 DOM
-
2026-06-01days on market $259,000 Active 34 DOM
-
2026-05-31days on market $259,000 Active 33 DOM
-
2026-04-28$259,000 Active 324-char remark
-
2021-01-31status Pending
-
2021-01-27status Pending
-
2021-01-26status Pending
-
2020-01-22status Pending
-
2020-01-21historical Contingent - Inspection
-
2020-01-13$205,000 Active
-
2019-01-31soldstatus $250,000
-
2019-01-31soldstatus $120,000
-
2009-11-19historical
-
2009-10-05$204,900
-
2000-11-02soldstatus $125,000
-
2000-10-24historical
-
2000-08-07$129,900
-
1990-05-02soldstatus $59,000
ⓘ Source: listings_history table (triggers on properties + properties_extension) + one-shot
backfill from property_details.listing_events for pre-trigger history.
Tax reassessment forecast MN · Partial reset (capped growth)
- Current annual tax
- $3,718 · $310/mo
- Projected year-2 tax
- $3,718 · $310/mo
- Expected delta
- $0/yr ($0/mo · 0.0%)
ⓘ Screening estimate from a state-policy table — verify with the county assessor before closing.
Climate risk First Street
- Flood 1/10 Low FEMA zone X (unshaded) · 0% chance over 30 yrs
- Wildfire 1/10 Low
- Heat 2/10 Low 7 d/yr ≥100°F today · 14 d/yr by 30 yrs out
- Wind 2/10 Low
- Air quality 2/10 Low 1 unhealthy d/yr today · 1 by 30 yrs out
Nearby sold comps map
Loading sold comps map…
Walkable amenities ~0.75 mi
Loading nearby amenities…
Taxation est. · year 1
- Rental income
- $29,259
- − Mortgage interest
- −$13,724
- − Property taxes
- −$3,718
- − Insurance
- −$1,225
- − Repairs & maintenance
- −$2,341
- − Management
- −$2,341
- − Depreciation
- −$7,127
- Taxable loss
- −$1,217
- Est. tax savings @ 24.0%
- +$292
- After-tax cash flow
- $3,046/yr
For passive investors: Depreciation is non-cash, so a rental often shows a tax loss while cash-flowing — sheltering income. Rental losses are passive: they offset passive income freely, and up to $25,000/yr can offset ordinary (W-2) income if you actively participate and your MAGI is under $100k (phasing out to $0 by $150k); unused losses carry forward. On sale, claimed depreciation is recaptured at up to 25%, and gains may owe capital-gains tax (a 1031 exchange can defer both). Figures are a year-1 estimate at your 24.0% rate — not tax advice; consult a CPA.
Schools (NCES district)
- District
- Minneapolis Public School District
- NCES district ID
- 2721240
- Math proficiency
- 35% ▼ -7.00%
- Reading proficiency
- 46% ▼ -1.00%
- Median HH income
- $50,521
- Composite
- 34.92/100
- National rank
- #5067
- State rank
- #217 of 301 in MN
Livability — Minneapolis
- Score
- 78/100
- State rank
- #110
- US rank
- #2525
Category grades
Schools grade is shown separately in the Schools card above.
Census & demographics
- Census place
- Minneapolis, MN
- County
- Hennepin County · 1,150,272 people
- City population
- 417,555
- Metro
- Minneapolis-St. Paul-Bloomington, MN-WI
- Population (ZIP)
- 35,007
- Household income
- $51,966
- Rent vs Own
- Severe rent burden
- 3687.0
Population outlook (Hennepin County) Hauer SSP2
- Today (2025)
- 1,405,227 people
- By 2030
- 1,492,650 · +6.2%
- By 2040
- 1,660,157 · +18.1%
- By 2050
- 1,823,498 · +29.8%
- By 2075
- 2,221,283 · +58.1%
- By 2100
- 2,509,976 · +78.6%
Race, ethnicity, and origin ACS 2023
- Neighborhood character
- Predominantly White (66%)
- Race & ethnicity
- White 66% Asian 12% Two or more races 9% Black 8% Hispanic / Latino 8%
- Hispanic origin (detail)
- Mexican 4%
- Common ancestry
- Portuguese 8% Romanian 4% Lithuanian 2%
- Foreign-born
- 16% · China, Canada, South Korea
- Languages at home
- 79% English-only · Chinese 5% Spanish 3% Other Asian/Pacific 3%
Political lean MEDSL · Hennepin
- 2024 margin
- Solid D (+42.6) · D 70.2% · R 27.5% · Other 2.3%
- 2008→2024 swing
- +14.0pp toward D · 2008: 28.6pp · 2024: 42.6pp
- All cycles
- 2024: D+42.6 2020: D+43.2 2016: D+35.3 2012: D+27.1 2008: D+28.6
Not yet ingested
- Civics
- —
Market trends
- HPI YoY
- ▼ -130.69%
- Current HPI
- 202.7105
- Rent YoY
- ▲ 4.98%
- Metro
- Minneapolis-St. Paul-Bloomington, MN-WI
- State GDP YoY
- ▲ 2.41%
- F500 in state
- 34
Industry mix (Fortune 500 HQ in MN)
| Industry | F500 HQs | Revenue |
|---|---|---|
| Healthcare | 2 | $407B |
|
||
| Retail | 2 | $150B |
|
||
| Consumer Goods | 2 | $32B |
|
||
| Industrial Machinery | 2 | $6B |
|
||
| Agriculture | 1 | $40B |
|
||
| Healthcare / Medical Devices | 1 | $32B |
|
||
Price history
+315.3% since first listed16 events — show timeline
- 2026-06-03 Price Changed $245,000 NORTHSTARMLS as Distributed by MLS Grid
- 2026-04-28 Listed $259,000 NORTHSTARMLS as Distributed by MLS Grid
- 2021-01-31 Pending — NORTHSTARMLS as Distributed by MLS Grid
- 2021-01-27 Pending — NORTHSTARMLS as Distributed by MLS Grid
- 2021-01-26 Pending — NORTHSTARMLS as Distributed by MLS Grid
- 2020-01-22 Pending — NORTHSTARMLS as Distributed by MLS Grid
- 2020-01-21 Contingent — NORTHSTARMLS as Distributed by MLS Grid
- 2020-01-13 Listed $205,000 NORTHSTARMLS as Distributed by MLS Grid
- 2019-01-31 Sold (Public Records) $120,000 Public Records
- 2019-01-31 Sold (Public Records) $250,000 Public Records
- 2009-11-19 Listing Removed — NORTHSTARMLS as Distributed by MLS Grid
- 2009-10-05 Listed $204,900 NORTHSTARMLS as Distributed by MLS Grid
- 2000-11-02 Sold (MLS) $125,000 NORTHSTARMLS as Distributed by MLS Grid
- 2000-10-24 Listing Removed — NORTHSTARMLS as Distributed by MLS Grid
- 2000-08-07 Listed $129,900 NORTHSTARMLS as Distributed by MLS Grid
- 1990-05-02 Sold (Public Records) $59,000 Public Records
Property tax history
+1.1%/yrLatest (2025): $3,718 · +9.6% YoY. Source: county tax records.
Cash-flow waterfall
monthlySold comps — $/sqft
last 12 mo · ≤1 miLoading sold comps…