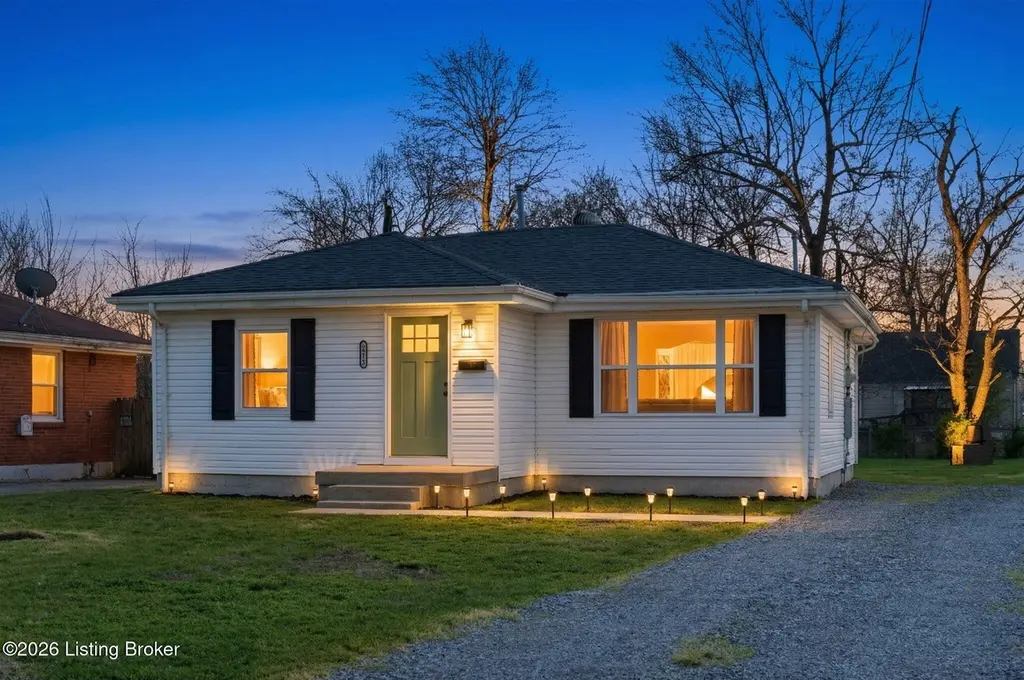
6918 Bowen Ave · Louisville/Jefferson County metro government (balance), KY
Flood risk 1/10 · Minimal
- FEMA flood zone
- X
- Chance of flooding over 30 yrs
- 0.0%
- Est. flood insurance / yr
- $507 – $1,088
Fire risk 3/10 · Minor
- Est. fire insurance / yr
- $839 – $1,559
Heat risk 5/10 · Moderate
- Hot days now (above 105°F)
- 7 days/yr
- Hot days in 30 yrs
- 19 days/yr
Wind risk 2/10 · Minimal
- Chance of severe wind over 30 yrs
- 3.0%
Air-quality risk 3/10 · Minor
- Unhealthy air days now
- 2 days/yr
- Unhealthy air days in 30 yrs
- 3 days/yr
Risk factors via First Street. Map © Google.
Why this score? — see what drove the D grade
The composite is a weighted blend of 9 inputs, each scored 0–100. Each bar is that input's sub-score; the figure is the points it added to the 100-point composite (weight × sub-score).
- Cash flow +16.1/30.0
- ARV discount +8.9/15.0
- DSCR +5.0/10.0
- 1% rule +3.4/10.0
- Rent growth +3.0/5.0
- Livability +2.5/5.0
- Condition / age +2.5/5.0
- Schools +2.3/10.0
- Appreciation +0.0/10.0
$199,900
🖨 Deal sheet (PDF) 📄 Offer letter ✓ Due diligence
Listing remarks MLS
Nice neighborhood. This property needs some TLC. Much potential for 1st time buyer or investor more expensive homes in neighborhood. 1 year home warranty.HL-5683 CN-Louisville
Key facts
- Fenced in backyard
- Ranch style home
- Storage shed
Tags
Property features AI
Finance
- Other: Subdivision: TIEDEMANN
- HOA & community: No association fee
Exterior
- Parking: Driveway
- Utilities: Electricity connected; One HVAC unit for heating and one for cooling
- Home design: Single-family ranch home; One story
- Construction: Built in 1953; Vinyl siding with wood frame construction; Shingle roof; Crawl space with concrete block foundation
- Exterior features: Cleared, level lot; Full chain-link fencing
Interior
- Kitchen: Kitchen on the first floor
- Bedrooms: Three bedrooms, all on the first floor
- Bathrooms: Two full bathrooms
- Heating & cooling: Forced air heating (natural gas); Central air conditioning
- Interior features: Nine total rooms; Five closets; Basement: none; First-floor primary bathroom; First-floor full bathroom
- Laundry & utility: First-floor laundry
Neighborhood map
What this means for you Summary
Snapshot
- This is a 3-bed/2.0-bath single-family listed at $200k.
Deal economics
- At list price, monthly cash flow is $104 ($1k/yr) — positive.
- The deal already cash-flows at list — no discount required.
- To meet the 1% rule (rent ≥ 1% of price), the offer needs to be $169k (15.6% below list).
- Recommended offer: $169k (15.6% below list) — sets the bar for 1% rule.
- Cap rate 6.9% vs local median 4.0% in Louisville/Jefferson County metro government (balance) — top-decile yield for the area; either an underpriced asset or a hidden risk that comps aren't pricing in. Stress-test before assuming the spread holds.
Location & tenants
- Location reads: area grade D — affects rentability + tenant quality, not the cash-flow math above.
- Jefferson County (urban): math 19% / reading 35% proficiency, ranked #121 of 165 in KY (top 73%) — low school quality limits family demand, transient renter base, plan for 1-2y turnover.
- Zoned schools: Watson Lane Elementary (math 8% / reading 17%); Robert Frost Sixth-Grade Academy (math 3% / reading 14%); Valley High (math 17% / reading 22%, grade F, #213 of 254 statewide, top 86%, 964 students, 70% FRL).
- Zoned-school proficiency averages 13% at this address vs 27% district-wide (-14 pts) — the specific schools serving this property underperform the Jefferson County average; the district grade overstates school quality for this exact location.
- Market conditions: Rents rising (+2.1%/yr); 218 active listings in the ZIP; 3 comparable units currently listed for rent nearby; rentals leasing fast (median 4d on market — plan ~1-2 weeks tenant-placement turnaround); 2,836 units permitted in Jefferson County in 2024 (1,558 in 5+ unit buildings).
Forward outlook
- Local home prices are declining (-3.0%/yr); year-one equity from $1k of loan paydown is wiped out by about $6k of value loss. Plan a longer hold.
- Jefferson County population projected at +13% by 2050 — modest demand growth; plan on rents tracking national, not racing it.
Negotiation context
- Only 8 days on market — expect competitive offers; lowballing is unlikely to land.
- 3 sale attempts since 24y ago with the ask held roughly flat each time — persistent listings suggest the price (not the market) is what's stuck; bring a comps-based counter.
- Current owner paid $40k; list at $200k implies a 400% gain — meaningful room to come down on a strong offer.
Risks & watch-outs
- Watch-outs: built in 1953 — expect roof / HVAC / electrical / plumbing capex.
- Climate carrying-cost: extreme-heat days projected 7→19/yr by 2055 (HVAC capex compounding) — expect insurance premiums to compound above CPI over the hold.
Questions for the listing agent
- Built in 1953 — when were the roof, HVAC, electrical panel, plumbing, and water heater last replaced?
- Is there a deadline driving the sale (1031 exchange, divorce, estate, relocation)? That informs how much negotiation room exists.
- The area grade is low — what's the realistic commute time and amenity access for the typical tenant pool here? Any planned neighborhood developments (good or bad) we should know about?
- What's the average days-on-market for RENTAL listings here right now (not sales)? A rising rental-DOM trend means longer vacancies and softer asking-rent achievability than the comps imply.
- What's the recent tenant-quality profile in this submarket — average credit score on applications, eviction rate, late-payment / NSF rate, and stable-employment percentage? A property-management company in the area should have these aggregated.
- How much new for-sale + rental construction is in the pipeline within 1–3 miles? Heavy new supply typically softens prices + rents 12–24 months out; constrained supply supports both.
Investment metrics
- 1% rule
- 0.84% ✗
- Cap rate
- 6.91%
- Cash-on-cash
- 2.22%
- DSCR
- 1.10
- GRM
- 9.9
CMA / ARV
- ARV (on-the-fly)
- $206,412
- Comps found
- 12
Show comp detail 12 sales within ~0.75 mi
| Address | Dist | Beds/Ba | Sqft | Sold | Price | $/sf | Match |
|---|---|---|---|---|---|---|---|
| 14017 Beeston Blvd | 0.04mi | 3/1.0 | 1,230 (-0%) | 4mo | $170,000 | $138 | 90 |
| 7110 Rainbow Dr | 0.24mi | 3/2.0 | 1,230 (-0%) | 4mo | $225,000 | $183 | 84 |
| 13900 Beeston Blvd | 0.23mi | 3/1.0 | 1,230 (-0%) | 7mo | $205,000 | $167 | 78 |
| 7011 Betsy Ross Dr | 0.39mi | 3/2.0 | 1,230 (-0%) | 6mo | $206,000 | $167 | 76 |
| 7114 Nathan Hale Way | 0.40mi | 3/1.0 | 1,176 (-5%) | 3mo | $169,900 | $144 | 67 |
| 7309 Rainbow Dr | 0.45mi | 4/1.0 (+1) | 1,230 (-0%) | 4mo | $177,000 | $144 | 66 |
| 13609 Tennis Blvd | 0.63mi | 3/1.0 | 1,230 (-0%) | 4mo | $195,000 | $159 | 63 |
| 7307 Nathan Hale Way | 0.55mi | 4/1.0 (+1) | 1,204 (-3%) | 1mo | $215,000 | $179 | 60 |
| 13511 Greystone Ave | 0.57mi | 3/1.0 | 1,176 (-5%) | 4mo | $195,000 | $166 | 58 |
| 13422 Hopedale Way | 0.66mi | 3/1.0 | 1,176 (-5%) | 2mo | $155,000 | $132 | 56 |
| 13501 Horncastle Way | 0.74mi | 3/1.5 | 1,165 (-6%) | 3mo | $210,000 | $180 | 51 |
| 13507 Tennis Blvd | 0.68mi | 3/1.0 | 1,134 (-8%) | 1mo | $190,000 | $168 | 50 |
Match score weights: distance 35% · size 25% · config 20% · recency 20%. Top-matched comps best support the ARV.
Projected returns pro-forma
-3.0% appreciation · 2.07% rent growth · sell at horizon
- IRR
- -13.8%
- Equity multiple
- 0.51×
- Total profit
- $-27,430
- Equity at exit
- $29,806
- IRR
- -6.4%
- Equity multiple
- 0.61×
- Total profit
- $-21,970
- Equity at exit
- $17,284
Cash invested: $55,972 (down + closing). Projections, not guarantees.
Landlord ↔ Tenant lean methodology
- Overall (STATE)
- 83 Strongly Landlord-Friendly
- State Kentucky
- 83 Strongly Landlord-Friendly · R+16
- County
- — inherits STATE
- City
- — inherits STATE
ZIP-level market 40272
- Rents YoY
- 2.1%
- Active inventory
- 218
- Price-to-rent
- 9.9×
Monthly cashflow live
- Estimated rent
- $1,688 medium interval (Pro) →
- Mortgage (P&I)
- −$1,048
- Tax from tax record
- −$98 /mo · $1,177/yr
- Insurance
- −$83
- HOA
- −$0
- Vacancy / Maint / Mgmt
- −$354
- Net cashflow
- $104
Break-even live
Sensitivity live
| Price | -10% $217 | -5% $160 | +0% $104 | +5% $47 | +10% $-10 |
|---|---|---|---|---|---|
| Rent | -10% $-30 | -5% $37 | +0% $104 | +5% $170 | +10% $237 |
| Rate | -1.0pp $204 | -0.5pp $154 | base $104 | +0.5pp $52 | +1.0pp $-1 |
UW: 25.0% down · 7.5% · 30yr · 1.5% tax · 5.0% vac · 8.0% maint · 8.0% mgmt
Financing live
Cash to close
- Down payment
- $49,975
- Closing costs
- $5,997
- Reserves months
- —
- Total cash needed
- —
Loan-product check · same deal, 3 products live
Conventional
25% down · 7.5% · 30yr
- Down + closing
- —
- Monthly P&I
- —
- Monthly cashflow
- —
- DSCR
- —
- Eligible?
- —
Personal DTI + credit; lowest rate.
DSCR
20% down · 8.5% · 30yr
- Down + closing
- —
- Monthly P&I
- —
- Monthly cashflow
- —
- DSCR
- —
- Eligible?
- —
No personal income docs; deal must DSCR.
Hard money
10% down · 12.0% · 12mo
- Down + closing
- —
- Monthly P&I
- —
- Monthly cashflow
- —
- DSCR
- —
- Eligible?
- —
Short-term bridge; refi at stabilization.
Rent comps 3 comps
| Address | Beds | Baths | Sqft | Rent | $/sqft | DOM | Units | Dist |
|---|---|---|---|---|---|---|---|---|
| 6902 Betsy Ross Dr Louisville, KY | 4.0 | 1.0 | 1230 | $1,700 | $1.38 | 16d | 1 | 0.35mi |
| 13217 Forge Cir Louisville, KY | 3.0 | 1.5 | 1092 | $1,495 | $1.37 | 3d | 1 | 0.96mi |
| 7019 James Madison Way Louisville, KY | 3.0 | 2.0 | 1374 | $1,750 | $1.27 | 3d | 1 | 1.01mi |
Listing history 9 events
-
2026-05-20status Pending
-
2026-05-18price $199,900
-
2026-05-15status Active
-
2026-03-23status Pending
-
2026-03-23price $210,000
-
2026-03-21$209,000 Active
-
2025-08-22price $145,000
-
2002-08-29soldstatus $40,000 175-char remark
Show marketing remark (175 chars)
Nice neighborhood. This property needs some TLC. Much potential for 1st time buyer or investor more expensive homes in neighborhood. 1 year home warranty.HL-5683 CN-Louisville
-
2002-07-19$59,900 175-char remark
Show marketing remark (175 chars)
Nice neighborhood. This property needs some TLC. Much potential for 1st time buyer or investor more expensive homes in neighborhood. 1 year home warranty.HL-5683 CN-Louisville
ⓘ Source: listings_history table (triggers on properties + properties_extension) + one-shot
backfill from property_details.listing_events for pre-trigger history.
Tax reassessment forecast KY · Resets to sale price
- Current annual tax
- $1,177 · $98/mo
- Projected year-2 tax
- $1,719 · $143/mo
- Expected delta
- +$542/yr (+$45/mo · 46.0%)
ⓘ Screening estimate from a state-policy table — verify with the county assessor before closing.
Climate risk First Street
- Flood 1/10 Low FEMA zone X · 0% chance over 30 yrs
- Wildfire 3/10 Moderate
- Heat 5/10 Major 7 d/yr ≥105°F today · 19 d/yr by 30 yrs out
- Wind 2/10 Low 3% chance of damaging wind over 30 yrs
- Air quality 3/10 Moderate 2 unhealthy d/yr today · 3 by 30 yrs out
Nearby sold comps map
Loading sold comps map…
Walkable amenities ~0.75 mi
Loading nearby amenities…
Taxation est. · year 1
- Rental income
- $20,252
- − Mortgage interest
- −$11,198
- − Property taxes
- −$1,177
- − Insurance
- −$1,000
- − Repairs & maintenance
- −$1,620
- − Management
- −$1,620
- − Depreciation
- −$5,815
- Taxable loss
- −$2,178
- Est. tax savings @ 24.0%
- +$523
- After-tax cash flow
- $1,765/yr
For passive investors: Depreciation is non-cash, so a rental often shows a tax loss while cash-flowing — sheltering income. Rental losses are passive: they offset passive income freely, and up to $25,000/yr can offset ordinary (W-2) income if you actively participate and your MAGI is under $100k (phasing out to $0 by $150k); unused losses carry forward. On sale, claimed depreciation is recaptured at up to 25%, and gains may owe capital-gains tax (a 1031 exchange can defer both). Figures are a year-1 estimate at your 24.0% rate — not tax advice; consult a CPA.
Schools (NCES district)
- District
- Jefferson County
- NCES district ID
- 2102990
- Math proficiency
- 19% ▼ -17.00%
- Reading proficiency
- 35% ▼ -11.00%
- Median HH income
- $47,885
- Composite
- 23.45/100
- National rank
- #7884
- State rank
- #121 of 165 in KY
Livability — Louisville/Jefferson County metro government (balance)
No livability data for this city. (Only ~50 U.S. cities are tracked.)
Census & demographics
- Census place
- Louisville/Jefferson County metro government (balance), KY
- County
- Jefferson County · 790,184 people
- City population
- 419,741
- Metro
- Louisville/Jefferson County, KY-IN
- Population (ZIP)
- 38,289
- Household income
- $69,940
- Rent vs Own
- Severe rent burden
- 702.0
Population outlook (Jefferson County) Hauer SSP2
- Today (2025)
- 823,112 people
- By 2030
- 849,343 · +3.2%
- By 2040
- 895,696 · +8.8%
- By 2050
- 933,630 · +13.4%
- By 2075
- 1,028,262 · +24.9%
- By 2100
- 1,072,675 · +30.3%
Race, ethnicity, and origin ACS 2023
- Neighborhood character
- Predominantly White (77%)
- Race & ethnicity
- White 77% Black 9% Hispanic / Latino 9% Two or more races 9%
- Hispanic origin (detail)
- Mexican 3% Cuban 3%
- Common ancestry
- Slovak 2% Lithuanian 1% Italian 1%
- Foreign-born
- 6% · Canada
- Languages at home
- 92% English-only · Spanish 7%
Political lean MEDSL · Jefferson
- 2024 margin
- D (+16.6) · D 57.4% · R 40.9% · Other 1.7%
- 2008→2024 swing
- +4.5pp toward D · 2008: 12.0pp · 2024: 16.6pp
- All cycles
- 2024: D+16.6 2020: D+20.1 2016: D+13.3 2012: D+11.1 2008: D+12.0
Not yet ingested
- Civics
- —
Market trends
- HPI YoY
- ▼ -262.10%
- Current HPI
- 247.2954
- Rent YoY
- ▲ 2.07%
- Metro
- Louisville/Jefferson County, KY-IN
- State GDP YoY
- ▲ 1.81%
- F500 in state
- 4
Industry mix (Fortune 500 HQ in KY)
| Industry | F500 HQs | Revenue |
|---|---|---|
| Healthcare | 1 | $118B |
|
||
| Food / Beverage | 1 | $7B |
|
||
Price history
+233.7% since first listed9 events — show timeline
- 2026-05-20 Pending — Metro Search MLS
- 2026-05-18 Price Changed $199,900 Metro Search MLS
- 2026-05-15 Relisted — Metro Search MLS
- 2026-03-23 Pending — Metro Search MLS
- 2026-03-23 Price Changed $210,000 Metro Search MLS
- 2026-03-21 Listed $209,000 Metro Search MLS
- 2025-08-22 Price Changed $145,000 Metro Search MLS
- 2002-08-29 Sold (MLS) $40,000 Metro Search MLS
- 2002-07-19 Listed $59,900 Metro Search MLS
Property tax history
+1.2%/yrLatest (2025): $1,177 · -2.1% YoY. Source: county tax records.
Cash-flow waterfall
monthlySold comps — $/sqft
last 12 mo · ≤1 miLoading sold comps…