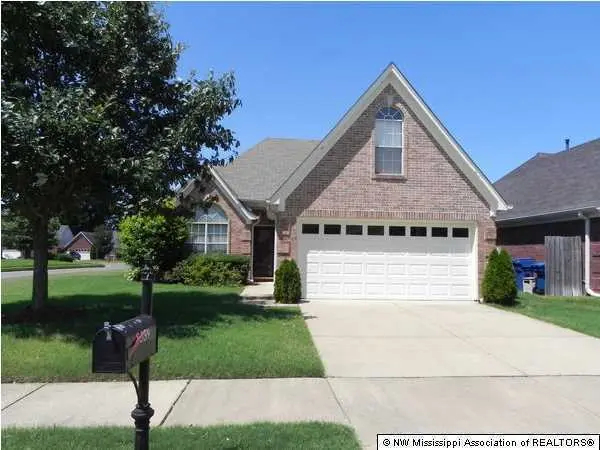
8339 Cross Point Dr · Olive Branch, MS
Flood risk 1/10 · Minimal
- FEMA flood zone
- X (unshaded)
- Chance of flooding over 30 yrs
- 0.0%
- Est. flood insurance / yr
- $507 – $1,088
Fire risk 1/10 · Minimal
- Est. fire insurance / yr
- $1,241 – $2,305
Heat risk 7/10 · Major
- Hot days now (above 109°F)
- 7 days/yr
- Hot days in 30 yrs
- 22 days/yr
Wind risk 4/10 · Minor
- Chance of severe wind over 30 yrs
- 19.0%
Air-quality risk 2/10 · Minimal
- Unhealthy air days now
- 2 days/yr
- Unhealthy air days in 30 yrs
- 2 days/yr
Risk factors via First Street. Map © Google.
Why this score? — see what drove the D grade
The composite is a weighted blend of 9 inputs, each scored 0–100. Each bar is that input's sub-score; the figure is the points it added to the 100-point composite (weight × sub-score).
- Cash flow +14.5/30.0
- ARV discount +8.8/15.0
- DSCR +4.4/10.0
- Schools +4.0/10.0
- Livability +3.6/5.0
- 1% rule +3.3/10.0
- Condition / age +2.5/5.0
- Rent growth +2.4/5.0
- Appreciation +0.0/10.0
$245,000
🖨 Deal sheet (PDF) 📄 Offer letter ✓ Due diligence
Listing remarks MLS
AMAZING 3 Bedroom, 2 Bath HOME!!! It would make a wonderful STARTER HOME or Any Time Home. Spacious Open Floor Plan, The HOME boasts a corner fireplace in the living room and a Formal Dining Room with a View of the Living Room. You can have a nice sized Master Bedroom with a Salon Master Bath. There is a Separate Tub and Shower, a Jacuzzi Tub, and a Walk-in Closet. Step out back and Enjoy the wonderful weather on YOUR OWN Private Screened in Patio. If your desire is to relax, this would be the ideal place to stay cool and bug free. Also, There is a Future expandable has been already floored. The HOME is centrally located in Olive Branch in a quiet community and is priced to sell. MAKE IT YOURS TODAY, and CALL to Set-up a Private Showing!!!
Key facts
- Screened-in patio
- Walk-in attic
- Corner lot
Tags
Neighborhood map
What this means for you Summary
Snapshot
- This is a 3-bed/2.0-bath single-family listed at $245k.
Deal economics
- At list price, monthly cash flow is $53 ($630/yr) — positive.
- The deal already cash-flows at list — no discount required.
- To meet the 1% rule (rent ≥ 1% of price), the offer needs to be $202k (17.4% below list).
- Recommended offer: $202k (17.4% below list) — sets the bar for 1% rule.
- Cap rate 6.6% vs local median 4.3% in Olive Branch — top-decile yield for the area; either an underpriced asset or a hidden risk that comps aren't pricing in. Stress-test before assuming the spread holds.
Location & tenants
- Location reads 72/100 on livability (#29 in MS) — a middle-class / working-renter tenant base. Strengths: cost of living A+, housing A+, employment A; Watch: amenities F, commute F.
- Desoto County School District (suburban): math 48% / reading 42% proficiency, ranked #20 of 130 in MS (top 15%) — families likely to look elsewhere, expect single-tenant / working-renter base with shorter leases.
- Zoned schools: Overpark Elementary (math 47% / reading 50%, grade D, #80 of 375 statewide, top 21%, 677 students, 100% FRL); Center Hill Middle (math 65% / reading 44%, grade B-, #17 of 179 statewide, top 9%, 775 students, 100% FRL); Center Hill High School (math 57% / reading 53%, grade C, #9 of 197 statewide, top 4%, 1,075 students, 100% FRL) — zoned schools average 100% FRL vs 43% district-wide (56 pts higher); higher-poverty schools than district average — tighter screening recommended.
- Market conditions: Rents soft (-0.3%/yr); 575 active listings in the ZIP; 31 comparable units currently listed for rent nearby; rentals at typical pace (median 19d on market — plan ~3-4 weeks tenant-placement turnaround); solid renter incomes; 1,155 units permitted in DeSoto County in 2024 (0 in 5+ unit buildings).
Forward outlook
- Local home prices are declining (-3.0%/yr); year-one equity from $2k of loan paydown is wiped out by about $7k of value loss. Plan a longer hold.
- DeSoto County population projected at +33% by 2050 — long-run rental-demand tailwind backs the buy-and-hold thesis.
Negotiation context
- It's been on market 61 days — a 6% lower offer ($230k) is reasonable based on typical stale-listing flexibility.
- 7 sale attempts since 24y ago with the ask held roughly flat each time — persistent listings suggest the price (not the market) is what's stuck; bring a comps-based counter.
Risks & watch-outs
- Climate carrying-cost: extreme-heat days projected 7→22/yr by 2055 (HVAC capex compounding) — expect insurance premiums to compound above CPI over the hold.
Questions for the listing agent
- It's been on market 61 days. Have you received any prior offers? Is the seller open to a 17% concession, seller financing, or rate buy-down credit?
- What does the HOA fee cover, when was the last increase, and are there any pending special assessments or reserve-fund shortfalls?
- Why hasn't it sold? Are there any deal-killer items the seller is aware of (foundation, flood, title, zoning, code violations)?
- Is there a deadline driving the sale (1031 exchange, divorce, estate, relocation)? That informs how much negotiation room exists.
- Schools are B-rated — typically a magnet for longer-tenancy family renters. What's the average tenant stay here, and is there a school-zone premium baked into asking?
- The area grade is low — what's the realistic commute time and amenity access for the typical tenant pool here? Any planned neighborhood developments (good or bad) we should know about?
- What's the average days-on-market for RENTAL listings here right now (not sales)? A rising rental-DOM trend means longer vacancies and softer asking-rent achievability than the comps imply.
- What's the recent tenant-quality profile in this submarket — average credit score on applications, eviction rate, late-payment / NSF rate, and stable-employment percentage? A property-management company in the area should have these aggregated.
- How much new for-sale + rental construction is in the pipeline within 1–3 miles? Heavy new supply typically softens prices + rents 12–24 months out; constrained supply supports both.
Investment metrics
- 1% rule
- 0.83% ✗
- Cap rate
- 6.55%
- Cash-on-cash
- 0.92%
- DSCR
- 1.04
- GRM
- 10.1
CMA / ARV
- ARV (median comp)
- $252,196
- List price
- $245,000
- Delta
- -2.85%
- Verdict
- FAIR
- Comps
- 20 within 1.0 mi
Show comp detail 12 sales within ~0.75 mi
| Address | Dist | Beds/Ba | Sqft | Sold | Price | $/sf | Match |
|---|---|---|---|---|---|---|---|
| 8260 Clubview Dr | 0.10mi | 3/2.0 | 1,588 (-1%) | 5mo | $236,000 | $149 | 89 |
| 8318 Waverly Cv | 0.25mi | 3/2.0 | 1,555 (-3%) | 2mo | $259,900 | $167 | 82 |
| 8151 Montrose Dr | 0.28mi | 3/2.5 | 1,600 (0%) | 7mo | $275,000 | $172 | 79 |
| 9129 Tremont Dr | 0.25mi | 3/2.0 | 1,525 (-5%) | 4mo | $255,000 | $167 | 78 |
| 9899 Wynngate Dr | 0.32mi | 3/2.0 | 1,520 (-5%) | 8mo | $240,000 | $158 | 69 |
| 9290 Lakeside Dr | 0.64mi | 3/2.0 | 1,529 (-4%) | 1mo | $319,000 | $209 | 62 |
| 9857 Tremont Dr | 0.23mi | 3/2.0 | 1,382 (-14%) | 8mo | $215,000 | $156 | 60 |
| 9908 Vista Ridge Dr | 0.41mi | 4/2.0 (+1) | 1,523 (-5%) | 11mo | $234,900 | $154 | 58 |
| 9178 William Paul Dr | 0.53mi | 3/2.0 | 1,733 (+8%) | 6mo | $295,000 | $170 | 56 |
| 10069 Fox Chase Dr | 0.72mi | 3/2.0 | 1,643 (+3%) | 10mo | $265,000 | $161 | 53 |
| 10035 Tally Ho Dr | 0.64mi | 3/2.0 | 1,750 (+9%) | 4mo | $289,000 | $165 | 51 |
| 9209 Hickory Dr | 0.73mi | 3/2.0 | 1,781 (+11%) | 2mo | $294,900 | $166 | 45 |
Match score weights: distance 35% · size 25% · config 20% · recency 20%. Top-matched comps best support the ARV.
Projected returns pro-forma
-3.0% appreciation · 0.0% rent growth · sell at horizon
- IRR
- -18.0%
- Equity multiple
- 0.38×
- Total profit
- $-42,346
- Equity at exit
- $36,530
- IRR
- -16.7%
- Equity multiple
- 0.19×
- Total profit
- $-55,729
- Equity at exit
- $21,183
Cash invested: $68,600 (down + closing). Projections, not guarantees.
Landlord ↔ Tenant lean methodology
- Overall (STATE)
- 90 Strongly Landlord-Friendly
- State Mississippi
- 90 Strongly Landlord-Friendly · R+11
- County
- — inherits STATE
- City
- — inherits STATE
ZIP-level market 38654
- Home prices YoY
- -26.1%
- Rents YoY
- -0.3%
- Active inventory
- 575
- Price-to-rent
- 10.1×
Monthly cashflow live
- Estimated rent
- $2,023 high interval (Pro) →
- Mortgage (P&I)
- −$1,285
- Tax from tax record
- −$139 /mo · $1,670/yr
- Insurance
- −$102
- HOA
- −$20
- Vacancy / Maint / Mgmt
- −$425
- Net cashflow
- $53
Break-even live
Sensitivity live
| Price | -10% $191 | -5% $122 | +0% $53 | +5% $-17 | +10% $-86 |
|---|---|---|---|---|---|
| Rent | -10% $-107 | -5% $-27 | +0% $53 | +5% $132 | +10% $212 |
| Rate | -1.0pp $176 | -0.5pp $115 | base $53 | +0.5pp $-11 | +1.0pp $-76 |
UW: 25.0% down · 7.5% · 30yr · 1.5% tax · 5.0% vac · 8.0% maint · 8.0% mgmt
Financing live
Cash to close
- Down payment
- $61,250
- Closing costs
- $7,350
- Reserves months
- —
- Total cash needed
- —
Loan-product check · same deal, 3 products live
Conventional
25% down · 7.5% · 30yr
- Down + closing
- —
- Monthly P&I
- —
- Monthly cashflow
- —
- DSCR
- —
- Eligible?
- —
Personal DTI + credit; lowest rate.
DSCR
20% down · 8.5% · 30yr
- Down + closing
- —
- Monthly P&I
- —
- Monthly cashflow
- —
- DSCR
- —
- Eligible?
- —
No personal income docs; deal must DSCR.
Hard money
10% down · 12.0% · 12mo
- Down + closing
- —
- Monthly P&I
- —
- Monthly cashflow
- —
- DSCR
- —
- Eligible?
- —
Short-term bridge; refi at stabilization.
Rent comps 31 comps
| Address | Beds | Baths | Sqft | Rent | $/sqft | DOM | Units | Dist |
|---|---|---|---|---|---|---|---|---|
| 8255 Cross Point Dr Olive Branch, MS | 3.0 | 2.0 | 1380 | $1,725 | $1.25 | 4d | 1 | 0.10mi |
| 8243 Cross Point Dr Olive Branch, MS | 3.0 | 2.0 | 1398 | $1,720 | $1.23 | 4d | 1 | 0.11mi |
| 8260 Clubview Dr Olive Branch, MS | 3.0 | 2.0 | 1588 | $1,875 | $1.18 | 21d | 1 | 0.13mi |
| 9135 Tremont Dr Olive Branch, MS | 4.0 | 2.0 | 1774 | $2,220 | $1.25 | 25d | 1 | 0.21mi |
| 9908 Tremont Dr Olive Branch, MS | 3.0 | 2.0 | 1507 | $1,770 | $1.17 | 19d | 1 | 0.22mi |
| 9913 Vista Ridge Dr Olive Branch, MS | 3.0 | 2.0 | 1312 | $1,680 | $1.28 | 4d | 1 | 0.35mi |
| 9007 Billy Pat Dr Olive Branch, MS | 4.0 | 2.0 | 1877 | $2,035 | $1.08 | 4d | 1 | 0.35mi |
| 9042 Billy Pat Dr Olive Branch, MS | 3.0 | 2.0 | 1877 | $2,000 | $1.07 | 19d | 1 | 0.37mi |
| 9069 Gavin Dr Olive Branch, MS | 4.0 | 2.0 | 1889 | $2,185 | $1.16 | 4d | 1 | 0.42mi |
| 9085 Billy Pat Dr Olive Branch, MS | 4.0 | 2.0 | 1457 | $2,000 | $1.37 | 22d | 1 | 0.45mi |
| 7843 Plantation Ridge Cv Olive Branch, MS | 3.0 | 2.0 | 1750 | $1,935 | $1.11 | 19d | 1 | 0.45mi |
| 7831 Plantation Ridge Cv Olive Branch, MS | 3.0 | 2.0 | 1543 | $1,980 | $1.28 | 6d | 1 | 0.47mi |
| 7838 Alexanders Crossing Dr Olive Branch, MS | 4.0 | 3.0 | 2159 | $2,220 | $1.03 | 4d | 1 | 0.47mi |
| 9117 Billy Pat Dr Olive Branch, MS | 3.0 | 2.0 | 1727 | $1,850 | $1.07 | 45d | 1 | 0.49mi |
| 7665 Fox Hunt Dr E Olive Branch, MS | 3.0 | 2.0 | 1320 | $1,695 | $1.28 | 45d | 1 | 0.77mi |
| 9083 Erie Cv Olive Branch, MS | 3.0 | 2.0 | 1600 | $1,995 | $1.25 | 22d | 1 | 0.78mi |
| 7642 Fox Hunt Dr E Olive Branch, MS | 3.0 | 2.0 | 1286 | $1,675 | $1.30 | 25d | 1 | 0.80mi |
| 9112 Lakeshore Dr Olive Branch, MS | 4.0 | 2.5 | 1985 | $2,350 | $1.18 | 45d | 1 | 0.86mi |
| 9025 Creekside Dr Olive Branch, MS | 3.0 | 2.5 | 1800 | $1,995 | $1.11 | 6d | 1 | 0.87mi |
| 9305 Stateline Rd Olive Branch, MS | 1.0–2.0 | 1.0–2.0 | 927 | $1,600 | $1.73 | 4d | 12 | 0.89mi |
| 7335 Red Maple Dr Olive Branch, MS | 3.0 | 2.5 | 1935 | $1,895 | $0.98 | 5d | 1 | 1.01mi |
| 7352 Alexander Rd Olive Branch, MS | 3.0 | 2.0 | 1650 | $1,825 | $1.11 | 45d | 1 | 1.02mi |
| 7310 Green Ash Dr Olive Branch, MS | 4.0 | 2.5 | 2229 | $2,160 | $0.97 | 45d | 1 | 1.04mi |
| 9961 Fox Run Dr Olive Branch, MS | 3.0 | 2.0 | 1578 | $2,300 | $1.46 | 4d | 1 | 1.10mi |
| 10595 Pecan Vw Olive Branch, MS | 4.0 | 3.0 | 1531 | $2,050 | $1.34 | 6d | 1 | 1.16mi |
| 9400 Goodman Rd Olive Branch, MS | 1.0–3.0 | 1.0–2.0 | 1163 | $2,005 | $1.72 | 3d | 17 | 1.24mi |
| 8564 Courtly Cir N Olive Branch, MS | 4.0 | 3.0 | 2207 | $2,140 | $0.97 | 45d | 1 | 1.34mi |
| 10734 Ridgefield Dr Olive Branch, MS | 3.0 | 2.0 | 1658 | $1,830 | $1.10 | 19d | 1 | 1.35mi |
| 10824 Ridgefield Dr Olive Branch, MS | 3.0 | 2.0 | 1520 | $1,785 | $1.17 | 23d | 1 | 1.43mi |
| 6866 Valerie Dr Olive Branch, MS | 3.0 | 2.0 | 1500 | $1,795 | $1.20 | 45d | 1 | 1.47mi |
| 6863 Delta Newberry Cv Olive Branch, MS | 3.0 | 2.5 | 1600 | $1,735 | $1.08 | 6d | 1 | 1.47mi |
HOA detail
- Monthly dues
- $20 · $240/yr
Listing history 26 events
-
2026-06-10days on market $245,000 Active 61 DOM
-
2026-06-09days on market $245,000 Active 60 DOM
-
2026-06-08days on market $245,000 Active 59 DOM
-
2026-06-07days on market $245,000 Active 58 DOM
-
2026-06-03days on market $245,000 Active 54 DOM
-
2026-06-02days on market $245,000 Active 53 DOM
-
2026-06-01days on market $245,000 Active 52 DOM
-
2026-05-31days on market $245,000 Active 51 DOM
-
2026-05-13historical
-
2026-05-11price $235,000
-
2026-04-04$250,000 Active
-
2013-11-14soldstatus
-
2013-11-08soldstatus 749-char remark
Show marketing remark (749 chars)
AMAZING 3 Bedroom, 2 Bath HOME!!! It would make a wonderful STARTER HOME or Any Time Home. Spacious Open Floor Plan, The HOME boasts a corner fireplace in the living room and a Formal Dining Room with a View of the Living Room. You can have a nice sized Master Bedroom with a Salon Master Bath. There is a Separate Tub and Shower, a Jacuzzi Tub, and a Walk-in Closet. Step out back and Enjoy the wonderful weather on YOUR OWN Private Screened in Patio. If your desire is to relax, this would be the ideal place to stay cool and bug free. Also, There is a Future expandable has been already floored. The HOME is centrally located in Olive Branch in a quiet community and is priced to sell. MAKE IT YOURS TODAY, and CALL to Set-up a Private Showing!!!
-
2013-08-15$110,000 749-char remark
Show marketing remark (749 chars)
AMAZING 3 Bedroom, 2 Bath HOME!!! It would make a wonderful STARTER HOME or Any Time Home. Spacious Open Floor Plan, The HOME boasts a corner fireplace in the living room and a Formal Dining Room with a View of the Living Room. You can have a nice sized Master Bedroom with a Salon Master Bath. There is a Separate Tub and Shower, a Jacuzzi Tub, and a Walk-in Closet. Step out back and Enjoy the wonderful weather on YOUR OWN Private Screened in Patio. If your desire is to relax, this would be the ideal place to stay cool and bug free. Also, There is a Future expandable has been already floored. The HOME is centrally located in Olive Branch in a quiet community and is priced to sell. MAKE IT YOURS TODAY, and CALL to Set-up a Private Showing!!!
-
2012-06-12soldstatus
-
2011-06-07historical
-
2011-04-13$129,900
-
2010-08-07historical
-
2010-07-01$139,000
-
2009-08-28historical
-
2009-07-21$143,900
-
2007-07-31soldstatus
-
2007-07-30soldstatus
-
2007-06-04$142,900
-
2002-09-27soldstatus
-
2002-06-13$121,900
ⓘ Source: listings_history table (triggers on properties + properties_extension) + one-shot
backfill from property_details.listing_events for pre-trigger history.
Tax reassessment forecast MS · Resets to sale price
- Current annual tax
- $1,670 · $139/mo
- Projected year-2 tax
- $1,936 · $161/mo
- Expected delta
- +$266/yr (+$22/mo · 15.9%)
ⓘ Screening estimate from a state-policy table — verify with the county assessor before closing.
Climate risk First Street
- Flood 1/10 Low FEMA zone X (unshaded) · 0% chance over 30 yrs
- Wildfire 1/10 Low
- Heat 7/10 Severe 7 d/yr ≥109°F today · 22 d/yr by 30 yrs out
- Wind 4/10 Moderate 19% chance of damaging wind over 30 yrs
- Air quality 2/10 Low 2 unhealthy d/yr today · 2 by 30 yrs out
Nearby sold comps map
Loading sold comps map…
Walkable amenities ~0.75 mi
Loading nearby amenities…
Taxation est. · year 1
- Rental income
- $24,282
- − Mortgage interest
- −$13,724
- − Property taxes
- −$1,670
- − Insurance
- −$1,225
- − Repairs & maintenance
- −$1,943
- − Management
- −$1,943
- − HOA
- −$240
- − Depreciation
- −$7,127
- Taxable loss
- −$3,589
- Est. tax savings @ 24.0%
- +$861
- After-tax cash flow
- $1,491/yr
For passive investors: Depreciation is non-cash, so a rental often shows a tax loss while cash-flowing — sheltering income. Rental losses are passive: they offset passive income freely, and up to $25,000/yr can offset ordinary (W-2) income if you actively participate and your MAGI is under $100k (phasing out to $0 by $150k); unused losses carry forward. On sale, claimed depreciation is recaptured at up to 25%, and gains may owe capital-gains tax (a 1031 exchange can defer both). Figures are a year-1 estimate at your 24.0% rate — not tax advice; consult a CPA.
Schools (NCES district)
- District
- Desoto County School District
- NCES district ID
- 2801320
- Math proficiency
- 48% ▼ -13.00%
- Reading proficiency
- 42% ▼ -6.00%
- Median HH income
- $59,272
- Composite
- 39.56/100
- National rank
- #3933
- State rank
- #20 of 130 in MS
Livability — Olive Branch
- Score
- 72/100
- State rank
- #29
- US rank
- #6509
Category grades
Schools grade is shown separately in the Schools card above.
Census & demographics
- Census place
- Olive Branch, MS
- County
- DeSoto County · 176,513 people
- City population
- 57,898
- Metro
- Memphis, TN-MS-AR
- Population (ZIP)
- 57,898
- Household income
- $103,092
- Rent vs Own
- Severe rent burden
- 801.0
Population outlook (DeSoto County) Hauer SSP2
- Today (2025)
- 203,338 people
- By 2030
- 217,692 · +7.1%
- By 2040
- 245,320 · +20.6%
- By 2050
- 270,133 · +32.8%
- By 2075
- 323,341 · +59.0%
- By 2100
- 348,742 · +71.5%
Race, ethnicity, and origin ACS 2023
- Neighborhood character
- Diverse neighborhood (Simpson 0.57)
- Race & ethnicity
- White 57% Black 32% Hispanic / Latino 5% Two or more races 5% Asian 2%
- Hispanic origin (detail)
- Mexican 4%
- Common ancestry
- Slovak 2% Lithuanian 1% Romanian 1%
- Foreign-born
- 4% · Canada, Vietnam, China
- Languages at home
- 93% English-only · Spanish 4% Vietnamese 1% Arabic 1%
Political lean MEDSL · DeSoto
- 2024 margin
- Strong R (+24.1) · D 36.7% · R 60.8% · Other 2.5%
- 2008→2024 swing
- +14.2pp toward D · 2008: -38.2pp · 2024: -24.1pp
- All cycles
- 2024: R+24.1 2020: R+23.9 2016: R+34.8 2012: R+33.5 2008: R+38.2
Not yet ingested
- Civics
- —
Market trends
- HPI YoY
- ▼ -66.27%
- Current HPI
- 187.2114
- Rent YoY
- ▼ -0.34%
- Metro
- Memphis, TN-MS-AR
- State GDP YoY
- —
- F500 in state
- 0
Price history
+92.8% since first listed18 events — show timeline
- 2026-05-13 Listing Removed — MLSU
- 2026-05-11 Price Changed $235,000 MLSU
- 2026-04-04 Listed $250,000 MLSU
- 2013-11-14 Sold (Public Records) — Public Records
- 2013-11-08 Sold (MLS) — MLSU
- 2013-08-15 Listed $110,000 MLSU
- 2012-06-12 Sold (Public Records) — Public Records
- 2011-06-07 Listing Removed — MLSU
- 2011-04-13 Listed $129,900 MLSU
- 2010-08-07 Listing Removed — MLSU
- 2010-07-01 Listed $139,000 MLSU
- 2009-08-28 Listing Removed — MLSU
- 2009-07-21 Listed $143,900 MLSU
- 2007-07-31 Sold (Public Records) — Public Records
- 2007-07-30 Sold (MLS) — MLSU
- 2007-06-04 Listed $142,900 MLSU
- 2002-09-27 Sold (MLS) — MLSU
- 2002-06-13 Listed $121,900 MLSU
Property tax history
+3.8%/yrLatest (2025): $1,670 · +13.6% YoY. Source: county tax records.
Cash-flow waterfall
monthlySold comps — $/sqft
last 12 mo · ≤1 miLoading sold comps…