10945 NE Cedar Pine Dr NE · Indianapolis city (balance), IN
Flood risk 1/10 · Minimal
- FEMA flood zone
- X (unshaded)
- Chance of flooding over 30 yrs
- 0.0%
- Est. flood insurance / yr
- $507 – $1,088
Fire risk 1/10 · Minimal
- Est. fire insurance / yr
- $717 – $1,331
Heat risk 3/10 · Minor
- Hot days now (above 100°F)
- 7 days/yr
- Hot days in 30 yrs
- 18 days/yr
Wind risk 2/10 · Minimal
- Chance of severe wind over 30 yrs
- 1.0%
Air-quality risk 3/10 · Minor
- Unhealthy air days now
- 3 days/yr
- Unhealthy air days in 30 yrs
- 4 days/yr
Risk factors via First Street. Map © Google.
Why this score? — see what drove the B grade
The composite is a weighted blend of 9 inputs, each scored 0–100. Each bar is that input's sub-score; the figure is the points it added to the 100-point composite (weight × sub-score).
- Cash flow +28.8/30.0
- ARV discount +15.0/15.0
- DSCR +10.0/10.0
- 1% rule +8.3/10.0
- Rent growth +3.1/5.0
- Livability +2.5/5.0
- Condition / age +2.5/5.0
- Schools +1.4/10.0
- Appreciation +0.0/10.0
$110,000
🖨 Deal sheet 📄 Offer letter ✓ Due diligence
Listing remarks MLS
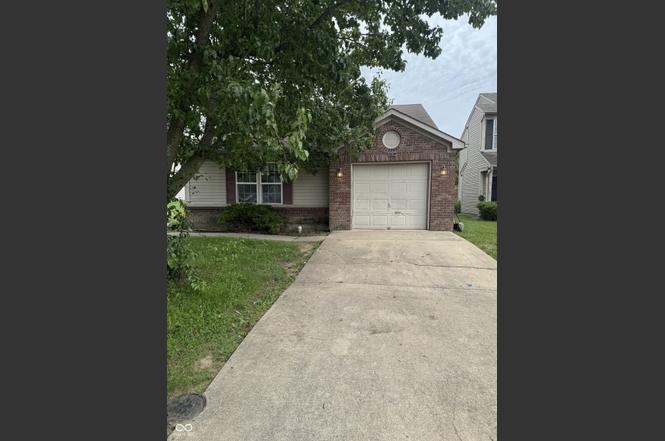
This home is an adorable two bed one bath ranch in Briarbrook Village. Home features nearly 1,000 square feet of space with an attached garage. You'll love the spacious kitchen with center island. Home also features a low-maintenance yard right next to the community playground.
Key facts
- 0.46 acre lot
- Garage
- Built 2002
Property features AI
Finance
- HOA & community: Homeowners association with an annual fee of $209
Exterior
- Parking: Attached garage (1 car)
- Utilities: Community sewer; Solid waste service available; No water source listed
- Home design: Single-family residence; One story
- Construction: Vinyl siding; Poured concrete foundation
- Exterior features: Approximately 0.46 acre lot (about 1/4–1/2 acre)
Interior
- Kitchen: No appliances included
- Bedrooms: 2 bedrooms on the main level
- Bathrooms: 1 full bathroom
- Heating & cooling: Other heating; Central air conditioning
- Interior features: Pantry
- Laundry & utility: Main-level laundry room
Neighborhood map
What this means for you Summary
Snapshot
- This is a 2-bed/1.0-bath single-family listed at $110k.
Deal economics
- At list price, monthly cash flow is $369 ($4k/yr) — positive.
- The deal already cash-flows at list — no discount required.
- Meets the 1% rule at list price ($1k rent vs $110k).
- Cap rate 10.3% vs local median 4.4% in Indianapolis city (balance) — top-decile yield for the area; either an underpriced asset or a hidden risk that comps aren't pricing in. Stress-test before assuming the spread holds.
Location & tenants
- Location reads: area grade B — affects rentability + tenant quality, not the cash-flow math above.
- Indianapolis Public Schools (urban): math 14% / reading 20% proficiency, ranked #286 of 301 in IN (top 95%) — low school quality limits family demand, transient renter base, plan for 1-2y turnover; 77% free/reduced lunch — lower-income household profile, screen leases tightly.
- Market conditions: Rents rising (+2.6%/yr); 54 active listings in the ZIP; 5 comparable units currently listed for rent nearby; rentals at typical pace (median 24d on market — plan ~3-4 weeks tenant-placement turnaround); 1,906 units permitted in Marion County in 2024 (621 in 5+ unit buildings).
Forward outlook
- Local home prices are declining (-3.0%/yr); year-one equity from $761 of loan paydown is wiped out by about $3k of value loss. Plan a longer hold.
- Marion County population projected at +18% by 2050 — long-run rental-demand tailwind backs the buy-and-hold thesis.
- At projected returns (-3.0% appreciation + 2.6% rent growth), your $31k cash investment doubles in ~9 years — after that, you're playing with house money.
Negotiation context
- Only 1 days on market — expect competitive offers; lowballing is unlikely to land.
- 5 sale attempts since 20y ago with the ask held roughly flat each time — persistent listings suggest the price (not the market) is what's stuck; bring a comps-based counter.
- Current owner paid $50k; list at $110k implies a 120% gain — meaningful room to come down on a strong offer.
Questions for the listing agent
- What does the HOA fee cover, when was the last increase, and are there any pending special assessments or reserve-fund shortfalls?
- Is there a deadline driving the sale (1031 exchange, divorce, estate, relocation)? That informs how much negotiation room exists.
- What's the average days-on-market for RENTAL listings here right now (not sales)? A rising rental-DOM trend means longer vacancies and softer asking-rent achievability than the comps imply.
- What's the recent tenant-quality profile in this submarket — average credit score on applications, eviction rate, late-payment / NSF rate, and stable-employment percentage? A property-management company in the area should have these aggregated.
- How much new for-sale + rental construction is in the pipeline within 1–3 miles? Heavy new supply typically softens prices + rents 12–24 months out; constrained supply supports both.
Investment metrics
- 1% rule
- 1.33% ✓
- Cap rate
- 10.32%
- Cash-on-cash
- 14.37%
- DSCR
- 1.64
- GRM
- 6.3
CMA / ARV
- ARV (on-the-fly)
- $183,024
- Comps found
- 4
Show comp detail 4 sales within ~0.75 mi
| Address | Dist | Beds/Ba | Sqft | Sold | Price | $/sf | Match |
|---|---|---|---|---|---|---|---|
| 10876 Bellflower Ct | 0.11mi | 2/1.0 | 984 (0%) | 12mo | $174,000 | $177 | 84 |
| 10959 Bellflower Ct | 0.08mi | 3/2.0 (+1) | 1,020 (+4%) | 2mo | $185,000 | $181 | 79 |
| 10966 Bellflower Ct | 0.11mi | 3/2.0 (+1) | 1,056 (+7%) | 8mo | $208,000 | $197 | 67 |
| 10816 Bellflower Ct | 0.16mi | 3/2.0 (+1) | 1,030 (+5%) | 15mo | $192,000 | $186 | 63 |
Match score weights: distance 35% · size 25% · config 20% · recency 20%. Top-matched comps best support the ARV.
Projected returns pro-forma
-3.0% appreciation · 2.56% rent growth · sell at horizon
- IRR
- 4.3%
- Equity multiple
- 1.16×
- Total profit
- $5,056
- Equity at exit
- $16,401
- IRR
- 13.4%
- Equity multiple
- 2.04×
- Total profit
- $32,180
- Equity at exit
- $9,511
Cash invested: $30,800 (down + closing). Projections, not guarantees.
Landlord ↔ Tenant lean methodology
- Overall (STATE)
- 90 Strongly Landlord-Friendly
- State Indiana
- 90 Strongly Landlord-Friendly · R+11
- County
- — inherits STATE
- City
- — inherits STATE
ZIP-level market 46235
- Home prices YoY
- -4.3%
- Rents YoY
- 2.6%
- Active inventory
- 54
- Price-to-rent
- 6.3×
Monthly cashflow live
- Estimated rent
- $1,460 high interval (Pro) →
- Mortgage (P&I)
- −$577
- Tax from tax record
- −$145 /mo · $1,739/yr
- Insurance
- −$46
- HOA
- −$17
- Vacancy / Maint / Mgmt
- −$307
- Net cashflow
- $369
Break-even live
UW: 25.0% down · 7.5% · 30yr · 1.5% tax · 5.0% vac · 8.0% maint · 8.0% mgmt
Financing live
Cash to close
- Down payment
- $27,500
- Closing costs
- $3,300
- Reserves months
- —
- Total cash needed
- —
Loan-product check · same deal, 3 products live
Conventional
25% down · 7.5% · 30yr
- Down + closing
- —
- Monthly P&I
- —
- Monthly cashflow
- —
- DSCR
- —
- Eligible?
- —
Personal DTI + credit; lowest rate.
DSCR
20% down · 8.5% · 30yr
- Down + closing
- —
- Monthly P&I
- —
- Monthly cashflow
- —
- DSCR
- —
- Eligible?
- —
No personal income docs; deal must DSCR.
Hard money
10% down · 12.0% · 12mo
- Down + closing
- —
- Monthly P&I
- —
- Monthly cashflow
- —
- DSCR
- —
- Eligible?
- —
Short-term bridge; refi at stabilization.
Rent comps 5 comps
| Address | Beds | Baths | Sqft | Rent | $/sqft | DOM | Units | Dist |
|---|---|---|---|---|---|---|---|---|
| 3665 Coneflower Way Indianapolis, IN | 3.0 | 2.0 | 1030 | $1,375 | $1.33 | 44d | 1 | 0.11mi |
| 3645 Wingate Ct Indianapolis, IN | 3.0 | 1.0–2.0 | 774 | $1,258 | $1.62 | 23d | 6 | 0.50mi |
| 11517 E 38th St Indianapolis, IN | 1.0–2.0 | 1.0–2.0 | 929 | $1,571 | $1.69 | 2d | 1 | 0.63mi |
| 10101 Montery Rd Indianapolis, IN | 2.0 | 1.0 | 627 | $1,439 | $2.30 | 2d | 10 | 0.99mi |
| 3962 Strathmore Dr Indianapolis, IN | 3.0 | 1.0 | 925 | $1,250 | $1.35 | 23d | 1 | 1.29mi |
HOA detail
- Monthly dues
- $17 · $204/yr
Listing history 2 events
-
2026-06-17remarks 312-char remark
-
2026-06-17$110,000 Active 1 DOM
ⓘ Source: listings_history table (triggers on properties + properties_extension) + one-shot
backfill from property_details.listing_events for pre-trigger history.
Tax reassessment forecast IN · Partial reset (capped growth)
- Current annual tax
- $1,739 · $145/mo
- Projected year-2 tax
- $1,739 · $145/mo
- Expected delta
- $0/yr ($0/mo · 0.0%)
ⓘ Screening estimate from a state-policy table — verify with the county assessor before closing.
Climate risk First Street
- Flood 1/10 Low FEMA zone X (unshaded) · 0% chance over 30 yrs
- Wildfire 1/10 Low
- Heat 3/10 Moderate 7 d/yr ≥100°F today · 18 d/yr by 30 yrs out
- Wind 2/10 Low 100% chance of damaging wind over 30 yrs
- Air quality 3/10 Moderate 3 unhealthy d/yr today · 4 by 30 yrs out
Nearby sold comps map
Loading sold comps map…
Walkable amenities ~0.75 mi
Loading nearby amenities…
Taxation est. · year 1
- Rental income
- $17,520
- − Mortgage interest
- −$6,162
- − Property taxes
- −$1,739
- − Insurance
- −$550
- − Repairs & maintenance
- −$1,402
- − Management
- −$1,402
- − HOA
- −$204
- − Depreciation
- −$3,200
- Taxable income
- $2,862
- Est. tax owed @ 24.0%
- −$687
- After-tax cash flow
- $3,738/yr
For passive investors: Depreciation is non-cash, so a rental often shows a tax loss while cash-flowing — sheltering income. Rental losses are passive: they offset passive income freely, and up to $25,000/yr can offset ordinary (W-2) income if you actively participate and your MAGI is under $100k (phasing out to $0 by $150k); unused losses carry forward. On sale, claimed depreciation is recaptured at up to 25%, and gains may owe capital-gains tax (a 1031 exchange can defer both). Figures are a year-1 estimate at your 24.0% rate — not tax advice; consult a CPA.
Schools (NCES district)
- District
- Indianapolis Public Schools
- NCES district ID
- 1804770
- Math proficiency
- 14% ▼ -7.00%
- Reading proficiency
- 20% ▼ -3.00%
- Median HH income
- $32,034
- Composite
- 13.69/100
- National rank
- #9499
- State rank
- #286 of 301 in IN
Livability — Indianapolis city (balance)
No livability data for this city. (Only ~50 U.S. cities are tracked.)
Census & demographics
- Census place
- Indianapolis city (balance), IN
- County
- Marion County · 998,460 people
- City population
- 881,119
- Metro
- Indianapolis-Carmel-Anderson, IN
- Population (ZIP)
- 36,317
- Household income
- $58,951
- Rent vs Own
- Severe rent burden
- 1901.0
Population outlook (Marion County) Hauer SSP2
- Today (2025)
- 1,025,572 people
- By 2030
- 1,065,727 · +3.9%
- By 2040
- 1,141,577 · +11.3%
- By 2050
- 1,208,920 · +17.9%
- By 2075
- 1,367,288 · +33.3%
- By 2100
- 1,438,201 · +40.2%
Race, ethnicity, and origin ACS 2023
- Neighborhood character
- Diverse neighborhood (Simpson 0.62)
- Race & ethnicity
- Black 57% White 18% Hispanic / Latino 17% Two or more races 11%
- Hispanic origin (detail)
- Mexican 11% Puerto Rican 2%
- Common ancestry
- Hispanic 3% Slovak 1% Romanian 1%
- Foreign-born
- 11% · Canada
- Languages at home
- 80% English-only · Spanish 15% French/Haitian/Cajun 4%
Political lean MEDSL · Marion
- 2024 margin
- Strong D (+27.7) · D 63.0% · R 35.3% · Other 1.7%
- 2008→2024 swing
- -0.7pp no change · 2008: 28.4pp · 2024: 27.7pp
- All cycles
- 2024: D+27.7 2020: D+29.1 2016: D+22.8 2012: D+22.2 2008: D+28.4
Not yet ingested
- Civics
- —
Market trends
- HPI YoY
- ▼ -12.41%
- Current HPI
- 275.1505
- Rent YoY
- ▲ 2.56%
- Metro
- Indianapolis-Carmel-Anderson, IN
- State GDP YoY
- ▲ 2.90%
- F500 in state
- 18
Industry mix (Fortune 500 HQ in IN)
| Industry | F500 HQs | Revenue |
|---|---|---|
| Industrial Machinery | 2 | $37B |
|
||
| Healthcare | 1 | $177B |
|
||
| Pharmaceuticals | 1 | $45B |
|
||
| Metals / Steel | 1 | $18B |
|
||
| Agriculture | 1 | $17B |
|
||
| Packaging | 1 | $12B |
|
||
Price history
+67.9% since first listed10 events — show timeline
- 2026-06-17 Listed $110,000 MIBOR as Distributed by MLS Grid
- 2012-10-23 Listing Removed — MIBOR as Distributed by MLS Grid
- 2012-10-23 Sold (MLS) $50,000 MIBOR as Distributed by MLS Grid
- 2012-07-23 Listed $49,673 MIBOR as Distributed by MLS Grid
- 2009-03-31 Listing Removed — MIBOR as Distributed by MLS Grid
- 2008-10-17 Listed $44,900 MIBOR as Distributed by MLS Grid
- 2007-06-14 Listing Removed — MIBOR as Distributed by MLS Grid
- 2007-03-14 Listed $74,999 MIBOR as Distributed by MLS Grid
- 2007-02-23 Sold (MLS) $55,450 MIBOR as Distributed by MLS Grid
- 2006-12-15 Listed $65,500 MIBOR as Distributed by MLS Grid
Property tax history
+12.3%/yrLatest (2025): $1,739 · -4.0% YoY. Source: county tax records.
Cash-flow waterfall
monthlySold comps — $/sqft
last 12 mo · ≤1 miLoading sold comps…