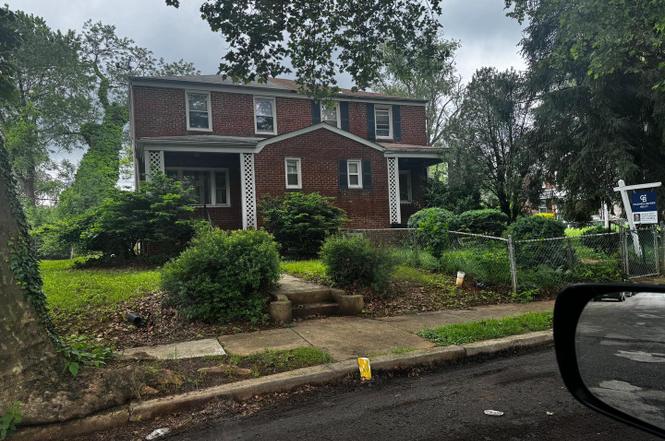
3902 Rosecrest Ave · Baltimore, MD
Flood risk 1/10 · Minimal
- FEMA flood zone
- X (unshaded)
- Chance of flooding over 30 yrs
- 0.0%
- Est. flood insurance / yr
- $473 – $860
Fire risk 1/10 · Minimal
- Est. fire insurance / yr
- $755 – $1,403
Heat risk 6/10 · Moderate
- Hot days now (above 103°F)
- 7 days/yr
- Hot days in 30 yrs
- 15 days/yr
Wind risk 5/10 · Moderate
- Chance of severe wind over 30 yrs
- 23.0%
Air-quality risk 3/10 · Minor
- Unhealthy air days now
- 2 days/yr
- Unhealthy air days in 30 yrs
- 4 days/yr
Risk factors via First Street. Map © Google.
Why this score? — see what drove the D+ grade
The composite is a weighted blend of 9 inputs, each scored 0–100. Each bar is that input's sub-score; the figure is the points it added to the 100-point composite (weight × sub-score).
- Cash flow +19.8/30.0
- DSCR +6.3/10.0
- 1% rule +6.2/10.0
- ARV discount +5.7/15.0
- Livability +3.8/5.0
- Rent growth +3.1/5.0
- Condition / age +2.5/5.0
- Schools +1.0/10.0
- Appreciation +0.0/10.0
$189,000
🖨 Deal sheet 📄 Offer letter ✓ Due diligence
Listing remarks
Fulton Bank, NA acquired this property via foreclosure. All information is provided in good faith without warranty. The property is being sold AS-IS, WHERE IS, and HOW-IS. All certifications and verifications are the buyer's sole responsibility and expense.
Key facts
- Built 1949
- Listed 56 days
Property features AI
Finance
- Other: Total below-grade area: 724 (includes finished and unfinished below-grade spaces); Above-grade finished area source: Assessor; Below-grade finished and unfinished area sources: Assessor
Exterior
- Parking: On-street parking
- Utilities: Public water; Public sewer; Natural gas hot water and heating fuel; Municipal trash not provided
- Home design: Semi-detached property; Property condition reported as below average; Fee simple ownership
- Construction: Brick construction; Block and brick/mortar foundation; Asphalt roof; Building winterized; Year built source: Assessor
- Exterior features: Not in a federal flood zone; Tidal water not present; Pets allowed with no pet restrictions; Access to bus stop within one mile and commuter lots within five miles
Interior
- Kitchen: Kitchen (appliances not specified)
- Bedrooms: Three bedrooms on the first upper level (Master Bedroom, Bedroom 2, Bedroom 3)
- Bathrooms: Two full bathrooms (one on the first upper level, one on the first lower level); One half bathroom on the main level
- Heating & cooling: Forced air heating; Electric-powered cooling (other type)
- Interior features: Not furnished; Connecting stairway to basement; Living Room; Dining Room
- Laundry & utility: Laundry hookups
Neighborhood map
What this means for you Summary
Snapshot
- This is a 3-bed/2.5-bath townhouse listed at $189k.
Deal economics
- At list price, monthly cash flow is $226 ($3k/yr) — positive.
- The deal already cash-flows at list — no discount required.
- Meets the 1% rule at list price ($2k rent vs $189k).
- Recommended offer: $183k (3.0% below list) — sets the bar for market timing.
- Cap rate 7.7% vs local median 6.0% in Baltimore — meaningfully above typical; check what's discounted (condition, days-on-market, listing class) to confirm the premium yield is real.
Location & tenants
- Location reads 76/100 on livability (#90 in MD, #3,396 nationally) — a middle-class / working-renter tenant base. Strengths: amenities A+, commute A+, housing A+; Watch: schools D, crime F.
- Baltimore City Public Schools (urban): math 7% / reading 16% proficiency, ranked #24 of 24 in MD (top 100%) — low school quality limits family demand, transient renter base, plan for 1-2y turnover; 79% free/reduced lunch — lower-income household profile, screen leases tightly.
- Market conditions: Rents rising (+2.4%/yr); 351 active listings in the ZIP; 25 comparable units currently listed for rent nearby; rentals at typical pace (median 24d on market — plan ~3-4 weeks tenant-placement turnaround); 40% of comp listings sitting > 30 days — soft ceiling on asking rent; 1,273 units permitted in Baltimore city in 2024 (1,104 in 5+ unit buildings).
- At $2,116/mo this rent would consume 49% of the median local household income ($52k/yr) (locally 3644% of renters already pay >50% of income on rent) — very limited rent-growth headroom before tenants either downsize or default.
Forward outlook
- Local home prices are declining (-3.0%/yr); year-one equity from $1k of loan paydown is wiped out by about $6k of value loss. Plan a longer hold.
- Baltimore County population projected to shrink 4% by 2050 — rents likely to lag national; underwrite the cash flow, not the appreciation.
Negotiation context
- It's been on market 56 days — a 3% lower offer ($183k) is reasonable based on typical stale-listing flexibility.
- 3 sale attempts since 5y ago; this cycle's ask has dropped $11k (5%) from the opening price — seller is motivated, your offer sets the floor, not the list.
Risks & watch-outs
- Watch-outs: built in 1949 — expect roof / HVAC / electrical / plumbing capex.
- Climate carrying-cost: moderate wind risk, 23% chance of damaging wind over 30y; extreme-heat days projected 7→15/yr by 2055 (HVAC capex compounding) — expect insurance premiums to compound above CPI over the hold.
Questions for the listing agent
- It's been on market 56 days. Have you received any prior offers? Is the seller open to a 3% concession, seller financing, or rate buy-down credit?
- Built in 1949 — when were the roof, HVAC, electrical panel, plumbing, and water heater last replaced?
- Is there a deadline driving the sale (1031 exchange, divorce, estate, relocation)? That informs how much negotiation room exists.
- Schools are D-rated, which usually means shorter tenancies and higher turnover. Who's the typical renter profile here, and what's been the actual vacancy rate?
- Crime grade is F in this area — have there been break-ins, vandalism, or insurance claims at this property in the last 3 years? What carrier currently insures it and at what premium?
- The area grade is low — what's the realistic commute time and amenity access for the typical tenant pool here? Any planned neighborhood developments (good or bad) we should know about?
- What's the average days-on-market for RENTAL listings here right now (not sales)? A rising rental-DOM trend means longer vacancies and softer asking-rent achievability than the comps imply.
- What's the recent tenant-quality profile in this submarket — average credit score on applications, eviction rate, late-payment / NSF rate, and stable-employment percentage? A property-management company in the area should have these aggregated.
- How much new for-sale + rental construction is in the pipeline within 1–3 miles? Heavy new supply typically softens prices + rents 12–24 months out; constrained supply supports both.
Investment metrics
- 1% rule
- 1.12% ✓
- Cap rate
- 7.73%
- Cash-on-cash
- 5.13%
- DSCR
- 1.23
- GRM
- 7.4
CMA / ARV
- ARV (on-the-fly)
- $181,684
- Comps found
- 12
Show comp detail 12 sales within ~0.75 mi
| Address | Dist | Beds/Ba | Sqft | Sold | Price | $/sf | Match |
|---|---|---|---|---|---|---|---|
| 3901 Mortimer Ave | 0.44mi | 3/2.0 | 1,664 (-3%) | 9mo | $151,000 | $91 | 65 |
| 5806 Rubin Ave | 0.27mi | 3/2.5 | 1,884 (+10%) | 8mo | $200,000 | $106 | 64 |
| 3601 Clarks Ln #536 | 0.47mi | 2/2.0 (-1) | 1,623 (-5%) | 1mo | $56,000 | $35 | 62 |
| 5803 Jonquil Ave | 0.39mi | 4/2.0 (+1) | 1,816 (+6%) | 6mo | $260,000 | $143 | 60 |
| 5404 Crismer Ave | 0.70mi | 3/2.0 | 1,667 (-3%) | 1mo | $239,900 | $144 | 60 |
| 6606 Park Heights Ave #701 | 0.48mi | 2/2.0 (-1) | 1,604 (-6%) | 0mo | $50,000 | $31 | 59 |
| 4002 Clarks Ln | 0.52mi | 3/1.5 | 1,600 (-7%) | 3mo | $220,000 | $138 | 58 |
| 3312 Ludgate Rd | 0.54mi | 3/2.5 | 1,906 (+11%) | 3mo | $155,000 | $81 | 53 |
| 6317 Park Heights Ave #404 | 0.38mi | 2/2.0 (-1) | 1,510 (-12%) | 4mo | $105,000 | $70 | 52 |
| 6317 Park Heights Ave Unit T9 | 0.38mi | 2/2.0 (-1) | 1,466 (-14%) | 7mo | $120,000 | $82 | 45 |
| 5410 Narcissus Ave | 0.73mi | 4/2.5 (+1) | 1,860 (+8%) | 3mo | $260,000 | $140 | 44 |
| 5422 Narcissus Ave | 0.72mi | 4/3.5 (+1) | 1,872 (+9%) | 4mo | $254,000 | $136 | 39 |
Match score weights: distance 35% · size 25% · config 20% · recency 20%. Top-matched comps best support the ARV.
Projected returns pro-forma
-3.0% appreciation · 2.41% rent growth · sell at horizon
- IRR
- -9.0%
- Equity multiple
- 0.67×
- Total profit
- $-17,348
- Equity at exit
- $28,181
- IRR
- -0.3%
- Equity multiple
- 0.98×
- Total profit
- $-1,138
- Equity at exit
- $16,341
Cash invested: $52,920 (down + closing). Projections, not guarantees.
Landlord ↔ Tenant lean methodology
- Overall (CITY)
- 12 Strongly Tenant-Friendly
- State Maryland
- 27 Tenant-Leaning · D+14
- County
- — inherits STATE
- City Baltimore
- 12 Strongly Tenant-Friendly · D+58
ZIP-level market 21215
- Rents YoY
- 2.4%
- Active inventory
- 351
- Price-to-rent
- 7.4×
Monthly cashflow live
- Estimated rent
- $2,116 high interval (Pro) →
- Mortgage (P&I)
- −$991
- Tax from tax record
- −$376 /mo · $4,509/yr
- Insurance
- −$79
- HOA
- −$0
- Vacancy / Maint / Mgmt
- −$444
- Net cashflow
- $226
Break-even live
UW: 25.0% down · 7.5% · 30yr · 1.5% tax · 5.0% vac · 8.0% maint · 8.0% mgmt
Financing live
Cash to close
- Down payment
- $47,250
- Closing costs
- $5,670
- Reserves months
- —
- Total cash needed
- —
Loan-product check · same deal, 3 products live
Conventional
25% down · 7.5% · 30yr
- Down + closing
- —
- Monthly P&I
- —
- Monthly cashflow
- —
- DSCR
- —
- Eligible?
- —
Personal DTI + credit; lowest rate.
DSCR
20% down · 8.5% · 30yr
- Down + closing
- —
- Monthly P&I
- —
- Monthly cashflow
- —
- DSCR
- —
- Eligible?
- —
No personal income docs; deal must DSCR.
Hard money
10% down · 12.0% · 12mo
- Down + closing
- —
- Monthly P&I
- —
- Monthly cashflow
- —
- DSCR
- —
- Eligible?
- —
Short-term bridge; refi at stabilization.
Rent comps 25 comps
| Address | Beds | Baths | Sqft | Rent | $/sqft | DOM | Units | Dist |
|---|---|---|---|---|---|---|---|---|
| 3709 Fords Ln Baltimore, MD | 4.0 | 3.5 | 2248 | $3,200 | $1.42 | 20d | 1 | 0.23mi |
| 5807 Gist Ave Baltimore, MD | 2.0 | 1.5 | 2100 | $1,395 | $0.66 | 23d | 1 | 0.36mi |
| 3912 Mortimer Ave Baltimore, MD | 3.0 | 2.0 | 1204 | $2,723 | $2.26 | 43d | 1 | 0.40mi |
| 3809 Clarks Ln Unit 301 Baltimore, MD | 2.0 | 2.0 | 1057 | $1,600 | $1.51 | 23d | 1 | 0.47mi |
| 3505 Clarks Ln Unit D2 Baltimore, MD | 3.0 | 2.0 | 1750 | $2,500 | $1.43 | 43d | 1 | 0.56mi |
| 6317 Pearce Ave Baltimore, MD | 2.0 | 2.0 | 1140 | $1,600 | $1.40 | 43d | 1 | 0.57mi |
| 3607 Labyrinth Rd Baltimore, MD | 1.0–3.0 | 1.0–2.0 | 925 | $2,100 | $2.27 | 19d | 5 | 0.63mi |
| 6609 Eberle Dr Baltimore, MD | 1.0–3.0 | 1.0–2.0 | 1011 | $1,787 | $1.77 | 1d | 25 | 0.80mi |
| 2900 Taney Rd Apt 1A Baltimore, MD | 2.0 | 2.0 | 1200 | $1,600 | $1.33 | 23d | 1 | 0.82mi |
| 5340 Maple Ave Baltimore, MD | 2.0 | 1.0 | 1200 | $1,950 | $1.62 | 43d | 1 | 0.97mi |
| 6936 Blanche Rd Baltimore, MD | 3.0 | 1.5 | 1410 | $1,800 | $1.28 | 43d | 1 | 1.02mi |
| 3700 Seven Mile Ln Pikesville, MD | 1.0–2.0 | 1.0–2.0 | 1063 | $1,723 | $1.62 | 1d | 13 | 1.13mi |
| 5000 Litchfield Ave #1 Baltimore, MD | 2.0 | 1.0 | 1100 | $1,100 | $1.00 | 43d | 1 | 1.16mi |
| 7220 Park Heights Ave Pikesville, MD | 2.0 | 2.0 | 1050 | $1,565 | $1.49 | 2d | 2 | 1.17mi |
| 7008 Deerfield Rd Pikesville, MD | 3.0 | 1.5 | 1664 | $2,300 | $1.38 | 43d | 1 | 1.19mi |
| 3807 Bowers Ave Gwynn Oak, MD | 3.0 | 1.5 | 1152 | $2,200 | $1.91 | 43d | 1 | 1.25mi |
| 6310 Greenspring Ave Baltimore, MD | 2.0–3.0 | 1.5–2.0 | 1080 | $1,940 | $1.80 | 3d | 6 | 1.26mi |
| 3109 Northbrook Rd Pikesville, MD | 4.0 | 2.5 | 1957 | $3,200 | $1.64 | 10d | 1 | 1.26mi |
| 5801 Western Run Dr Baltimore, MD | 3.0 | 1.0–2.0 | 835 | $1,979 | $2.37 | 2d | 7 | 1.27mi |
| 7307 Park Heights Ave Pikesville, MD | 2.0 | 2.0–2.5 | 1251 | $2,506 | $2.00 | 1d | 5 | 1.28mi |
| 4010 Fernhill Ave Unit 2 Baltimore, MD | 2.0 | 1.0 | 1100 | $1,500 | $1.36 | 43d | 1 | 1.29mi |
| 4828 Beaufort Ave Baltimore, MD | 2.0 | 2.5 | 1200 | $1,850 | $1.54 | 23d | 1 | 1.34mi |
| 5115 Pembridge Ave Baltimore, MD | 3.0 | 2.0 | 1088 | $2,150 | $1.98 | 43d | 1 | 1.40mi |
| 3784 Columbus Dr Baltimore, MD | 4.0 | 2.0 | 1250 | $2,200 | $1.76 | 23d | 1 | 1.45mi |
| 19 Warren Park Dr Pikesville, MD | 3.0 | 1.0–2.0 | 903 | $1,700 | $1.88 | 3d | 10 | 1.47mi |
Listing history 12 events
-
2026-06-19status $189,000 Pending 56 DOM
-
2026-05-01historical Active Under Contract
-
2026-04-23price $189,000
-
2026-03-06$199,900 Active
-
2021-11-16price $100,000
-
2021-10-30status Pending
-
2021-10-30historical
-
2021-10-29status Active
-
2021-10-24status Pending
-
2021-10-23$135,000 Active
-
2020-05-05soldstatus $185,000
-
2004-05-06soldstatus $60,000
ⓘ Source: listings_history table (triggers on properties + properties_extension) + one-shot
backfill from property_details.listing_events for pre-trigger history.
Tax reassessment forecast MD · Partial reset (capped growth)
- Current annual tax
- $4,509 · $376/mo
- Projected year-2 tax
- $4,509 · $376/mo
- Expected delta
- $0/yr ($0/mo · 0.0%)
ⓘ Screening estimate from a state-policy table — verify with the county assessor before closing.
Climate risk First Street
- Flood 1/10 Low FEMA zone X (unshaded) · 0% chance over 30 yrs
- Wildfire 1/10 Low
- Heat 6/10 Major 7 d/yr ≥103°F today · 15 d/yr by 30 yrs out
- Wind 5/10 Major 23% chance of damaging wind over 30 yrs
- Air quality 3/10 Moderate 2 unhealthy d/yr today · 4 by 30 yrs out
Nearby sold comps map
Loading sold comps map…
Walkable amenities ~0.75 mi
Loading nearby amenities…
Taxation est. · year 1
- Rental income
- $25,395
- − Mortgage interest
- −$10,587
- − Property taxes
- −$4,509
- − Insurance
- −$945
- − Repairs & maintenance
- −$2,032
- − Management
- −$2,032
- − Depreciation
- −$5,498
- Taxable loss
- −$207
- Est. tax savings @ 24.0%
- +$50
- After-tax cash flow
- $2,765/yr
For passive investors: Depreciation is non-cash, so a rental often shows a tax loss while cash-flowing — sheltering income. Rental losses are passive: they offset passive income freely, and up to $25,000/yr can offset ordinary (W-2) income if you actively participate and your MAGI is under $100k (phasing out to $0 by $150k); unused losses carry forward. On sale, claimed depreciation is recaptured at up to 25%, and gains may owe capital-gains tax (a 1031 exchange can defer both). Figures are a year-1 estimate at your 24.0% rate — not tax advice; consult a CPA.
Schools (NCES district)
- District
- Baltimore City Public Schools
- NCES district ID
- 2400090
- Math proficiency
- 7% ▼ -9.00%
- Reading proficiency
- 16% ▼ -5.00%
- Median HH income
- $42,108
- Composite
- 10.08/100
- National rank
- #9805
- State rank
- #24 of 24 in MD
Livability — Baltimore
- Score
- 76/100
- State rank
- #90
- US rank
- #3396
Category grades
Schools grade is shown separately in the Schools card above.
Census & demographics
- Census place
- Baltimore, MD
- County
- Baltimore City · 558,601 people
- City population
- 588,727
- Metro
- Baltimore-Columbia-Towson, MD
- Population (ZIP)
- 52,229
- Household income
- $51,587
- Rent vs Own
- Severe rent burden
- 3644.0
Population outlook (Baltimore County) Hauer SSP2
- Today (2025)
- 624,249 people
- By 2030
- 621,541 · -0.4%
- By 2040
- 609,756 · -2.3%
- By 2050
- 597,249 · -4.3%
- By 2075
- 552,236 · -11.5%
- By 2100
- 513,934 · -17.7%
Race, ethnicity, and origin ACS 2023
- Neighborhood character
- Predominantly Black (73%)
- Race & ethnicity
- Black 73% White 17% Hispanic / Latino 5% Two or more races 4% Asian 1%
- Common ancestry
- Scotch-Irish 2% Romanian 2% Italian 1%
- Foreign-born
- 9% · Canada, South Korea
- Languages at home
- 91% English-only · Spanish 4% French/Haitian/Cajun 1% Other Indo-European 1%
Political lean MEDSL · Baltimore
- 2024 margin
- Solid D (+73.0) · D 85.2% · R 12.2% · Other 2.6%
- 2008→2024 swing
- -2.5pp toward R · 2008: 75.5pp · 2024: 73.0pp
- All cycles
- 2024: D+73.0 2020: D+76.6 2016: D+74.6 2012: D+76.4 2008: D+75.5
Not yet ingested
- Civics
- —
Market trends
- HPI YoY
- ▼ -318.58%
- Current HPI
- 291.4926
- Rent YoY
- ▲ 2.41%
- Metro
- Baltimore-Columbia-Towson, MD
- State GDP YoY
- ▲ 2.97%
- F500 in state
- 12
Industry mix (Fortune 500 HQ in MD)
| Industry | F500 HQs | Revenue |
|---|---|---|
| Aerospace / Defense | 1 | $71B |
|
||
| Utilities | 1 | $25B |
|
||
| Hotels | 1 | $24B |
|
||
| Consumer Goods | 1 | $7B |
|
||
| Real Estate | 1 | $6B |
|
||
| Chemicals | 1 | $2B |
|
||
Price history
+215.0% since first listed11 events — show timeline
- 2026-05-01 Contingent — BRIGHT MLS
- 2026-04-23 Price Changed $189,000 BRIGHT MLS
- 2026-03-06 Listed $199,900 BRIGHT MLS
- 2021-11-16 Price Changed $100,000 BRIGHT MLS
- 2021-10-30 Pending — BRIGHT MLS
- 2021-10-30 Listing Removed — BRIGHT MLS
- 2021-10-29 Relisted — BRIGHT MLS
- 2021-10-24 Pending — BRIGHT MLS
- 2021-10-23 Listed $135,000 BRIGHT MLS
- 2020-05-05 Sold (Public Records) $185,000 Public Records
- 2004-05-06 Sold (Public Records) $60,000 Public Records
Property tax history
+1.7%/yrLatest (2025): $4,509 · +28.2% YoY. Source: county tax records.
Cash-flow waterfall
monthlySold comps — $/sqft
last 12 mo · ≤1 miLoading sold comps…