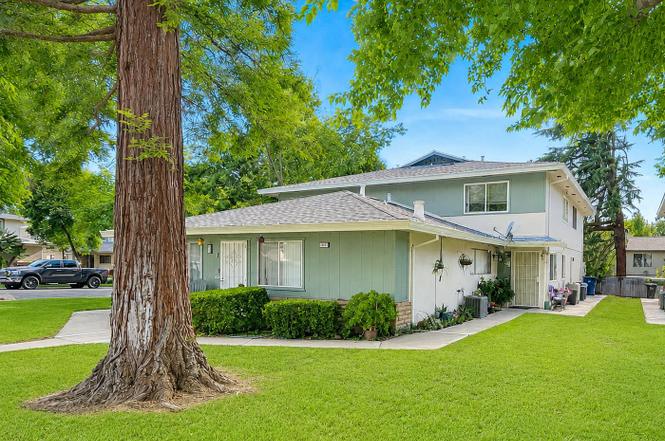
6225 Cavan Dr #3 · Citrus Heights, CA
Flood risk 1/10 · Minimal
- FEMA flood zone
- X (unshaded)
- Chance of flooding over 30 yrs
- 0.0%
- Est. flood insurance / yr
- $507 – $1,088
Fire risk 1/10 · Minimal
- Est. fire insurance / yr
- $659 – $1,223
Heat risk 7/10 · Major
- Hot days now (above 102°F)
- 7 days/yr
- Hot days in 30 yrs
- 16 days/yr
Wind risk 1/10 · Minimal
- Chance of severe wind over 30 yrs
- —
Air-quality risk 10/10 · Severe
- Unhealthy air days now
- 34 days/yr
- Unhealthy air days in 30 yrs
- 36 days/yr
Risk factors via First Street. Map © Google.
Why this score? — see what drove the D grade
The composite is a weighted blend of 9 inputs, each scored 0–100. Each bar is that input's sub-score; the figure is the points it added to the 100-point composite (weight × sub-score).
- Cash flow +13.1/30.0
- ARV discount +7.5/15.0
- 1% rule +5.0/10.0
- Schools +4.4/10.0
- DSCR +3.9/10.0
- Rent growth +3.0/5.0
- Livability +3.0/5.0
- Condition / age +2.5/5.0
- Appreciation +0.0/10.0
$177,500
🖨 Deal sheet (PDF) 📄 Offer letter ✓ Due diligence
Listing remarks
Welcome to Greenback Estates, where comfort, convenience, and affordability come together. This well-maintained 2-bedroom, 1-bathroom condominium offers 840 square feet of functional living space designed for easy, low-maintenance living. The main level features a spacious living and dining area that flows seamlessly into the kitchen, creating an inviting setting for everyday living, relaxing, or entertaining guests. Upstairs, you'll find two generously sized bedrooms and a full bathroom, including a flexible second bedroom ideal for guests, a home office, workout room, or hobby space. The HOA delivers exceptional value maintaining the community pool, beautifully maintained grounds and comm
Key facts
- Community pool
- $335 HOA
- Garage
Tags
Property features AI
Finance
- HOA & community: Mandatory homeowners association; Monthly HOA fee (includes exterior maintenance and pool); Community amenities include pool and coin laundry; see remarks for additional details
Exterior
- Parking: Attached rear-facing 1-car garage; Sidewalk/curb/gutter along driveway
- Utilities: Public water; Public sewer; Natural gas connected; Cable available; Electric service (other); Irrigation supplied by public district
- Home design: Attached condominium; 2-story layout; Built in 1971; Composition roof
- Construction: Attached construction
- Exterior features: Low-maintenance landscaping with front landscaping and miscellaneous plantings; Automatic sprinkler system (front); Built-in private pool within a fenced common facility
Interior
- Kitchen: Gas cooktop; Built-in gas oven; Dishwasher; Disposal; Microwave; Breakfast area; Pantry closet; Tile countertops; Dining bar / dining-family combo
- Bedrooms: 2 bedrooms; Primary bedroom with walk-in closet
- Flooring: Carpet; Tile
- Bathrooms: 1 full bathroom with tile and tub/shower combo
- Heating & cooling: Central heating; Central air conditioning
- Interior features: Front porch; Pets allowed — dogs and cats permitted; See remarks for laundry details
- Laundry & utility: Indoor laundry (see remarks)
Neighborhood map
What this means for you Summary
Snapshot
- This is a 2-bed/1.0-bath condo listed at $178k.
Deal economics
- At list price, monthly cash flow is $-7 ($-81/yr) — negative.
- To cash-flow at today's rent, offer at most $176k (0.7% below list).
- To meet the 1% rule (rent ≥ 1% of price), the offer needs to be $177k (0.0% below list).
- Recommended offer: $176k (0.7% below list) — sets the bar for cash-flow.
- Cap rate 6.2% vs local median 3.4% in Citrus Heights — top-decile yield for the area; either an underpriced asset or a hidden risk that comps aren't pricing in. Stress-test before assuming the spread holds.
Location & tenants
- Location reads 60/100 on livability (#614 in CA) — a middle-class / working-renter tenant base. Strengths: housing A+; Watch: crime D-, amenities F, commute F.
- San Juan Unified (suburban): math 40% / reading 62% proficiency, ranked #138 of 517 in CA (top 27%) — acceptable for families but not a draw, mixed tenant base, ~2y average lease.
- Zoned schools: Orangevale Open K-8 (572 students, 22% FRL); Sylvan Middle (647 students, 71% FRL); El Camino Fundamental High (math 34% / reading 62%, grade D, #378 of 1,170 statewide, top 32%, 1,246 students, 50% FRL) — zoned schools at 48% FRL track the district average.
- Market conditions: Rents rising (+1.9%/yr); 219 active listings in the ZIP; 32 comparable units currently listed for rent nearby; rentals at typical pace (median 18d on market — plan ~3-4 weeks tenant-placement turnaround); solid renter incomes; 6,825 units permitted in Sacramento County in 2024 (1,752 in 5+ unit buildings).
Forward outlook
- Local home prices are declining (-3.0%/yr); year-one equity from $1k of loan paydown is wiped out by about $5k of value loss. Plan a longer hold.
- Sacramento County population projected at +17% by 2050 — long-run rental-demand tailwind backs the buy-and-hold thesis.
Negotiation context
- Only 6 days on market — expect competitive offers; lowballing is unlikely to land.
- Current owner paid $56k; list at $178k implies a 217% gain — meaningful room to come down on a strong offer.
Risks & watch-outs
- Climate carrying-cost: extreme-heat days projected 7→16/yr by 2055 (HVAC capex compounding) — expect insurance premiums to compound above CPI over the hold.
Questions for the listing agent
- What do current leases actually rent for vs. the listed asking? Can we see a recent rent roll and the last 12 months of T-12 income?
- Built in 1971 — when were the roof, HVAC, electrical panel, plumbing, and water heater last replaced?
- What does the HOA fee cover, when was the last increase, and are there any pending special assessments or reserve-fund shortfalls?
- Any open or pending special assessments — roof, HVAC, plumbing, elevator, façade? What's the per-unit balance and payoff schedule, and is the seller paying it off at close or rolling it to the buyer?
- Is there a deadline driving the sale (1031 exchange, divorce, estate, relocation)? That informs how much negotiation room exists.
- Schools are D-rated, which usually means shorter tenancies and higher turnover. Who's the typical renter profile here, and what's been the actual vacancy rate?
- Crime grade is D in this area — have there been break-ins, vandalism, or insurance claims at this property in the last 3 years? What carrier currently insures it and at what premium?
- The area grade is low — what's the realistic commute time and amenity access for the typical tenant pool here? Any planned neighborhood developments (good or bad) we should know about?
- What's the average days-on-market for RENTAL listings here right now (not sales)? A rising rental-DOM trend means longer vacancies and softer asking-rent achievability than the comps imply.
- What's the recent tenant-quality profile in this submarket — average credit score on applications, eviction rate, late-payment / NSF rate, and stable-employment percentage? A property-management company in the area should have these aggregated.
- How much new apartment / multifamily construction is in the pipeline within 1–3 miles? Heavy new supply (>2% of stock underway) typically softens rents 12–24 months out; light construction supports rent growth.
Investment metrics
- 1% rule
- 1.00% ✗
- Cap rate
- 6.25%
- Cash-on-cash
- -0.16%
- DSCR
- 0.99
- GRM
- 8.3
CMA / ARV
No comps found within radius.
Projected returns pro-forma
-3.0% appreciation · 1.9% rent growth · sell at horizon
- IRR
- -17.9%
- Equity multiple
- 0.38×
- Total profit
- $-30,999
- Equity at exit
- $26,466
- IRR
- -12.5%
- Equity multiple
- 0.30×
- Total profit
- $-34,784
- Equity at exit
- $15,347
Cash invested: $49,700 (down + closing). Projections, not guarantees.
Landlord ↔ Tenant lean methodology
- Overall (STATE)
- 18 Strongly Tenant-Friendly
- State California
- 18 Strongly Tenant-Friendly · D+13
- County
- — inherits STATE
- City
- — inherits STATE
ZIP-level market 95621
- Rents YoY
- 1.9%
- Active inventory
- 219
- Price-to-rent
- 8.3×
Monthly cashflow live
- Estimated rent
- $1,775 high interval (Pro) →
- Mortgage (P&I)
- −$931
- Tax from tax record
- −$69 /mo · $830/yr
- Insurance
- −$74
- HOA
- −$335
- Vacancy / Maint / Mgmt
- −$373
- Net cashflow
- $-7
Break-even live
Sensitivity live
| Price | -10% $94 | -5% $43 | +0% $-7 | +5% $-57 | +10% $-107 |
|---|---|---|---|---|---|
| Rent | -10% $-147 | -5% $-77 | +0% $-7 | +5% $63 | +10% $133 |
| Rate | -1.0pp $83 | -0.5pp $38 | base $-7 | +0.5pp $-53 | +1.0pp $-100 |
UW: 25.0% down · 7.5% · 30yr · 1.5% tax · 5.0% vac · 8.0% maint · 8.0% mgmt
Financing live
Cash to close
- Down payment
- $44,375
- Closing costs
- $5,325
- Reserves months
- —
- Total cash needed
- —
Loan-product check · same deal, 3 products live
Conventional
25% down · 7.5% · 30yr
- Down + closing
- —
- Monthly P&I
- —
- Monthly cashflow
- —
- DSCR
- —
- Eligible?
- —
Personal DTI + credit; lowest rate.
DSCR
20% down · 8.5% · 30yr
- Down + closing
- —
- Monthly P&I
- —
- Monthly cashflow
- —
- DSCR
- —
- Eligible?
- —
No personal income docs; deal must DSCR.
Hard money
10% down · 12.0% · 12mo
- Down + closing
- —
- Monthly P&I
- —
- Monthly cashflow
- —
- DSCR
- —
- Eligible?
- —
Short-term bridge; refi at stabilization.
Rent comps 32 comps
| Address | Beds | Baths | Sqft | Rent | $/sqft | DOM | Units | Dist |
|---|---|---|---|---|---|---|---|---|
| 6245 Longford Dr #3 Citrus Heights, CA | 2.0 | 1.0 | 840 | $1,395 | $1.66 | 25d | 1 | 0.09mi |
| 6228 Longford Dr #3 Citrus Heights, CA | 2.0 | 1.0 | 840 | $1,595 | $1.90 | 19d | 1 | 0.12mi |
| 6533 Greenback Ln #3 Citrus Heights, CA | 2.0 | 1.0 | 840 | $1,800 | $2.14 | 25d | 1 | 0.24mi |
| 6544 Auburn Blvd Citrus Heights, CA | 2.0 | 2.0 | 800 | $1,850 | $2.31 | 25d | 1 | 0.27mi |
| 6011 Shadow Ln Citrus Heights, CA | 1.0–2.0 | 1.0–2.0 | 779 | $2,348 | $3.01 | 3d | 15 | 0.41mi |
| 6546 Auburn Blvd Citrus Heights, CA | 2.0 | 1.0 | 624 | $1,853 | $2.97 | 5d | 10 | 0.44mi |
| 5844 Garden Park Ct Unit RV 5853-D Carmichael, CA | 2.0 | 1.0 | 915 | $1,525 | $1.67 | 18d | 1 | 0.68mi |
| 5844 Garden Park Ct Unit RV 5877-B Carmichael, CA | 2.0 | 1.0 | 915 | $1,575 | $1.72 | 18d | 1 | 0.68mi |
| 5979 Devecchi Ave Citrus Heights, CA | 1.0–2.0 | 1.0–2.0 | 775 | $1,871 | $2.41 | 3d | 15 | 0.75mi |
| 7024 San Altos Cir Citrus Heights, CA | 2.0 | 2.0 | 1120 | $2,800 | $2.50 | 45d | 1 | 0.83mi |
| 5718 Manzanita Ave Carmichael, CA | 2.0 | 1.0 | 980 | $2,000 | $2.04 | 45d | 1 | 0.83mi |
| 6430 Verner Ave Sacramento, CA | 1.0–2.0 | 1.0–2.0 | 705 | $2,295 | $3.25 | 25d | 1 | 0.93mi |
| 6172 Peoria Dr Citrus Heights, CA | 2.0 | 1.0 | 917 | $1,695 | $1.85 | 5d | 1 | 0.98mi |
| 6225 Wildomar Way Carmichael, CA | 3.0 | 1.0 | 1040 | $3,000 | $2.88 | 45d | 1 | 1.00mi |
| 6111 Shupe Dr Unit 53 Citrus Heights, CA | 1.0 | 1.0 | 667 | $1,600 | $2.40 | 23d | 1 | 1.09mi |
| 6111 Shupe Dr Unit 15 Citrus Heights, CA | 1.0 | 1.0 | 667 | $1,575 | $2.36 | 19d | 1 | 1.09mi |
| 6111 Shupe Dr Unit 44 Citrus Heights, CA | 1.0 | 1.0 | 667 | $1,600 | $2.40 | 45d | 1 | 1.09mi |
| 5922 Petaluma Ct Sacramento, CA | 2.0 | 2.0 | 1048 | $2,075 | $1.98 | 3d | 1 | 1.09mi |
| 5840 Garfield Ave Sacramento, CA | 2.0 | 1.0 | 850 | $1,545 | $1.82 | 3d | 2 | 1.18mi |
| 5587 Keoncrest Cir Unit 2 Sacramento, CA | 2.0 | 1.5 | 900 | $2,000 | $2.22 | 3d | 1 | 1.21mi |
| 6004 Rutland Dr Unit 128 Carmichael, CA | 2.0 | 1.0 | 900 | $1,495 | $1.66 | 5d | 1 | 1.23mi |
| 5501 Keoncrest Cir Unit 1 Sacramento, CA | 2.0 | 1.0 | 750 | $1,300 | $1.73 | 3d | 1 | 1.24mi |
| 5417 Olympic Way Sacramento, CA | 2.0 | 1.0 | 920 | $1,795 | $1.95 | 16d | 1 | 1.24mi |
| 5402 Mona Way Sacramento, CA | 2.0 | 1.0 | 863 | $1,750 | $2.03 | 23d | 1 | 1.26mi |
| 5308 Winfield Way #2 Sacramento, CA | 3.0 | 1.5 | 1105 | $2,100 | $1.90 | 45d | 1 | 1.39mi |
| 5300 Winfield Way #2 Sacramento, CA | 3.0 | 1.5 | 1105 | $2,100 | $1.90 | 25d | 1 | 1.41mi |
| 7323 Chivalry Way Citrus Heights, CA | 2.0 | 2.0 | 1121 | $2,095 | $1.87 | 12d | 1 | 1.42mi |
| 6635 Sylvan Rd Citrus Heights, CA | 1.0–2.0 | 1.0–2.0 | 865 | $2,120 | $2.45 | 9d | 8 | 1.43mi |
| 7061 Madison Ave Fair Oaks, CA | 2.0 | 2.0 | 940 | $1,750 | $1.86 | 14d | 2 | 1.43mi |
| 5233 Columbine Way Carmichael, CA | 3.0 | 2.0 | 1008 | $2,375 | $2.36 | 5d | 1 | 1.46mi |
| 7311 Huntington Square Ln Citrus Heights, CA | 2.0 | 1.0 | 975 | $1,955 | $2.01 | 3d | 5 | 1.46mi |
| 5244 Hackberry Ln Sacramento, CA | 2.0 | 1.0 | 712 | $1,712 | $2.41 | 45d | 1 | 1.47mi |
HOA detail condo
- Monthly dues
- $335 · $4,020/yr
- Likely covers
- landscapingpool
- Assessments
- None detected in remarks — confirm with the listing agent.
Listing history 5 events
-
2026-06-21days on market $177,500 Active 6 DOM
-
2026-06-18days on market $177,500 Active 3 DOM
-
2026-06-17days on market $177,500 Active 2 DOM
-
2026-06-16remarks 699-char remark
-
2026-06-16$177,500 Active 1 DOM
ⓘ Source: listings_history table (triggers on properties + properties_extension) + one-shot
backfill from property_details.listing_events for pre-trigger history.
Tax reassessment forecast CA · Resets to sale price
- Current annual tax
- $830 · $69/mo
- Projected year-2 tax
- $1,349 · $112/mo
- Expected delta
- +$519/yr (+$43/mo · 62.6%)
ⓘ Screening estimate from a state-policy table — verify with the county assessor before closing.
Climate risk First Street
- Flood 1/10 Low FEMA zone X (unshaded) · 0% chance over 30 yrs
- Wildfire 1/10 Low
- Heat 7/10 Severe 7 d/yr ≥102°F today · 16 d/yr by 30 yrs out
- Wind 1/10 Low
- Air quality 10/10 Extreme 34 unhealthy d/yr today · 36 by 30 yrs out
Nearby sold comps map
Loading sold comps map…
Walkable amenities ~0.75 mi
Loading nearby amenities…
Taxation est. · year 1
- Rental income
- $21,298
- − Mortgage interest
- −$9,943
- − Property taxes
- −$830
- − Insurance
- −$888
- − Repairs & maintenance
- −$1,704
- − Management
- −$1,704
- − HOA
- −$4,020
- − Depreciation
- −$5,164
- Taxable loss
- −$2,953
- Est. tax savings @ 24.0%
- +$709
- After-tax cash flow
- $627/yr
For passive investors: Depreciation is non-cash, so a rental often shows a tax loss while cash-flowing — sheltering income. Rental losses are passive: they offset passive income freely, and up to $25,000/yr can offset ordinary (W-2) income if you actively participate and your MAGI is under $100k (phasing out to $0 by $150k); unused losses carry forward. On sale, claimed depreciation is recaptured at up to 25%, and gains may owe capital-gains tax (a 1031 exchange can defer both). Figures are a year-1 estimate at your 24.0% rate — not tax advice; consult a CPA.
Schools (NCES district)
- District
- San Juan Unified
- NCES district ID
- 0634620
- Math proficiency
- 40% ▲ 3.00%
- Reading proficiency
- 62% ▲ 16.00%
- Median HH income
- $55,655
- Composite
- 44.07/100
- National rank
- #2878
- State rank
- #138 of 517 in CA
Livability — Citrus Heights
- Score
- 60/100
- State rank
- #614
- US rank
- #19580
Category grades
Schools grade is shown separately in the Schools card above.
Census & demographics
- Census place
- Citrus Heights, CA
- County
- Sacramento County · 1,539,646 people
- City population
- 89,370
- Metro
- Sacramento-Roseville-Folsom, CA
- Population (ZIP)
- 42,442
- Household income
- $80,901
- Rent vs Own
- Severe rent burden
- 1854.0
Population outlook (Sacramento County) Hauer SSP2
- Today (2025)
- 1,660,763 people
- By 2030
- 1,732,990 · +4.3%
- By 2040
- 1,855,755 · +11.7%
- By 2050
- 1,941,335 · +16.9%
- By 2075
- 2,046,162 · +23.2%
- By 2100
- 1,961,444 · +18.1%
Race, ethnicity, and origin ACS 2023
- Neighborhood character
- Predominantly White (66%)
- Race & ethnicity
- White 66% Hispanic / Latino 19% Two or more races 11% Asian 6% Black 2%
- Hispanic origin (detail)
- Mexican 16%
- Common ancestry
- Subsaharan African 3% Lithuanian 3% Scotch-Irish 2%
- Foreign-born
- 15% · Canada, Vietnam
- Languages at home
- 78% English-only · Spanish 10% Russian/Polish/Slavic 6% Other Indo-European 3%
Political lean MEDSL · Sacramento
- 2024 margin
- D (+19.7) · D 58.1% · R 38.4% · Other 3.5%
- 2008→2024 swing
- +0.7pp no change · 2008: 19.0pp · 2024: 19.7pp
- All cycles
- 2024: D+19.7 2020: D+25.3 2016: D+23.7 2012: D+16.3 2008: D+19.0
Not yet ingested
- Civics
- —
Market trends
- HPI YoY
- ▼ -408.14%
- Current HPI
- 351.9333
- Rent YoY
- ▲ 1.90%
- Metro
- Sacramento-Roseville-Folsom, CA
- State GDP YoY
- ▲ 3.21%
- F500 in state
- 116
Industry mix (Fortune 500 HQ in CA)
| Industry | F500 HQs | Revenue |
|---|---|---|
| Technology | 27 | $1,492B |
|
||
| Financial Services | 3 | $174B |
|
||
| Retail | 3 | $44B |
|
||
| Insurance | 3 | $26B |
|
||
| Media / Entertainment | 2 | $115B |
|
||
| Pharmaceuticals / Biotech | 2 | $62B |
|
||
Price history
+67.2% since first listed4 events — show timeline
- 2012-07-27 Sold (Public Records) $56,000 Public Records
- 1981-07-02 Sold (Public Records) $8,000 Public Records
- 1981-06-09 Sold (Public Records) $8,000 Public Records
- 1979-06-12 Sold (Public Records) $33,500 Public Records
Property tax history
+0.4%/yrLatest (2025): $830 · +0.9% YoY. Source: county tax records.
Cash-flow waterfall
monthlySold comps — $/sqft
last 12 mo · ≤1 miLoading sold comps…