 Multi-family
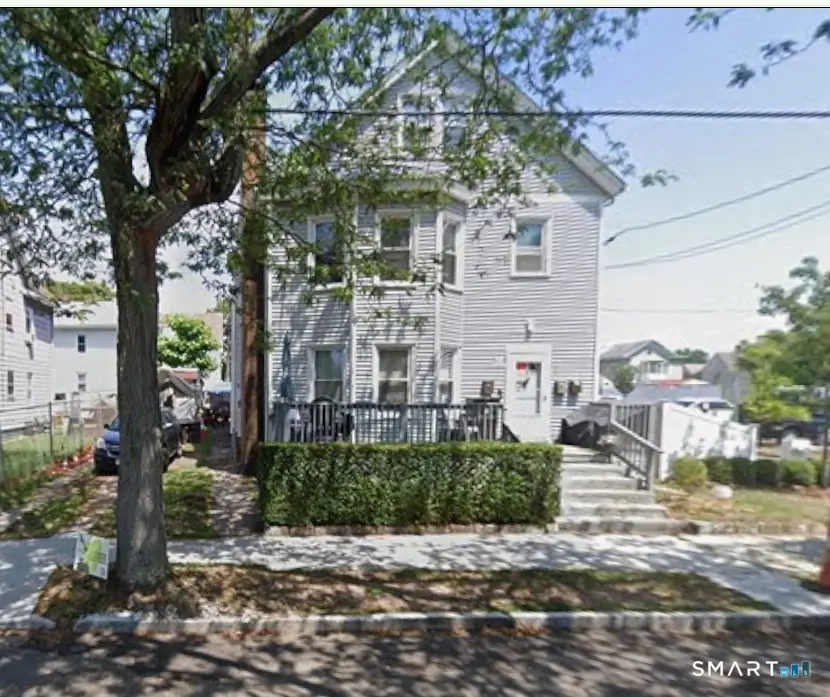
121 Pine St · New Haven, CT
Flood risk 1/10 · Minimal
- FEMA flood zone
- X (unshaded)
- Chance of flooding over 30 yrs
- 0.0%
- Est. flood insurance / yr
- $473 – $860
Fire risk 3/10 · Minor
- Est. fire insurance / yr
- $829 – $1,539
Heat risk 7/10 · Major
- Hot days now (above 99°F)
- 7 days/yr
- Hot days in 30 yrs
- 16 days/yr
Wind risk 6/10 · Moderate
- Chance of severe wind over 30 yrs
- 56.0%
Air-quality risk 5/10 · Moderate
- Unhealthy air days now
- 6 days/yr
- Unhealthy air days in 30 yrs
- 8 days/yr
Risk factors via First Street. Map © Google.
Why this score? — see what drove the D+ grade
The composite is a weighted blend of 9 inputs, each scored 0–100. Each bar is that input's sub-score; the figure is the points it added to the 100-point composite (weight × sub-score).
- Cash flow +16.3/30.0
- ARV discount +7.8/15.0
- DSCR +5.1/10.0
- 1% rule +4.7/10.0
- Livability +4.0/5.0
- Rent growth +3.5/5.0
- Condition / age +2.5/5.0
- Schools +1.5/10.0
- Appreciation +0.0/10.0
$485,000
🖨 Deal sheet (PDF) 📄 Offer letter ✓ Due diligence
Multi-family units
County records classify this as Multi-Family (2-4 Unit). Listing-text estimate: 1 unit. estimate disagrees with records
Listing remarks
Highly sought at neighborhood. Great location for community involvement, close to retail, public transportation, worship. .great opportunity for sweat equity and ownership or investment. Each unit has their own hot water heaters, furnaces and electricity.
Key facts
- 4,356 sq ft lot
- Built 1900
- Listed 10 days
Property features AI
Finance
- Other: Listed as Multi-Family For Sale; Total of 3 units
- Financial info: Assessed value listed
Exterior
- Utilities: Public water connected; Public sewer connected; 80-gallon hot water tank
- Home design: Multi-family property (3-family)
- Construction: Frame construction; Concrete foundation; Built prior to or by public records (living area recorded)
- Exterior features: Vinyl siding; Shingle roof
Interior
- Bedrooms: Six bedrooms
- Bathrooms: Three full bathrooms
- Heating & cooling: Hot water heating; Gas fuel (street)
- Interior features: Full basement; Two fireplaces; 14 total rooms
Neighborhood map
What this means for you Summary
Snapshot
- This is a 6-bed/3.0-bath multifamily listed at $485k.
Deal economics
- At list price, monthly cash flow is $267 ($3k/yr) — positive.
- The deal already cash-flows at list — no discount required.
- To meet the 1% rule (rent ≥ 1% of price), the offer needs to be $471k (2.8% below list).
- Recommended offer: $471k (2.8% below list) — sets the bar for 1% rule.
- Cap rate 7.0% vs local median 4.8% in New Haven — top-decile yield for the area; either an underpriced asset or a hidden risk that comps aren't pricing in. Stress-test before assuming the spread holds.
Location & tenants
- Location reads 79/100 on livability (#31 in CT, #2,190 nationally) — a middle-class / working-renter tenant base. Strengths: amenities A+, commute A+, health & safety A+; Watch: employment D, crime F.
- New Haven School District (urban): math 12% / reading 25% proficiency, ranked #147 of 153 in CT (top 96%) — low school quality limits family demand, transient renter base, plan for 1-2y turnover; 66% free/reduced lunch — lower-income household profile, screen leases tightly.
- Zoned schools: Betsy Ross Arts Magnet School (math 12% / reading 27%, grade F, #161 of 175 statewide, top 93%, 327 students, 70% FRL) — zoned schools at 70% FRL track the district average.
- Market conditions: Rents rising fast (+4.1%/yr); 102 active listings in the ZIP; 1 comparable units currently listed for rent nearby; 1,059 units permitted in South Central Connecticut Planning Region in 2024 (779 in 5+ unit buildings).
- At $4,712/mo this rent would consume 117% of the median local household income ($48k/yr) (locally 2664% of renters already pay >50% of income on rent) — very limited rent-growth headroom before tenants either downsize or default.
Forward outlook
- Local home prices are declining (-3.0%/yr); year-one equity from $3k of loan paydown is wiped out by about $15k of value loss. Plan a longer hold.
Negotiation context
- Only 10 days on market — expect competitive offers; lowballing is unlikely to land.
- Current owner paid $100k; list at $485k implies a 385% gain — meaningful room to come down on a strong offer.
Risks & watch-outs
- Watch-outs: built in 1900 — expect roof / HVAC / electrical / plumbing capex.
- Climate carrying-cost: major wind risk, 56% chance of damaging wind over 30y; extreme-heat days projected 7→16/yr by 2055 (HVAC capex compounding) — expect insurance premiums to compound above CPI over the hold.
Questions for the listing agent
- Built in 1900 — when were the roof, HVAC, electrical panel, plumbing, and water heater last replaced?
- Is there a deadline driving the sale (1031 exchange, divorce, estate, relocation)? That informs how much negotiation room exists.
- Schools are D-rated, which usually means shorter tenancies and higher turnover. Who's the typical renter profile here, and what's been the actual vacancy rate?
- Crime grade is F in this area — have there been break-ins, vandalism, or insurance claims at this property in the last 3 years? What carrier currently insures it and at what premium?
- The area grade is low — what's the realistic commute time and amenity access for the typical tenant pool here? Any planned neighborhood developments (good or bad) we should know about?
- What's the average days-on-market for RENTAL listings here right now (not sales)? A rising rental-DOM trend means longer vacancies and softer asking-rent achievability than the comps imply.
- What's the recent tenant-quality profile in this submarket — average credit score on applications, eviction rate, late-payment / NSF rate, and stable-employment percentage? A property-management company in the area should have these aggregated.
- How much new apartment / multifamily construction is in the pipeline within 1–3 miles? Heavy new supply (>2% of stock underway) typically softens rents 12–24 months out; light construction supports rent growth.
Investment metrics
- 1% rule
- 0.97% ✗
- Cap rate
- 6.95%
- Cash-on-cash
- 2.36%
- DSCR
- 1.11
- GRM
- 8.6
CMA / ARV
- ARV (on-the-fly)
- $487,751
- Comps found
- 12
Show comp detail 12 sales within ~0.75 mi
| Address | Dist | Beds/Ba | Sqft | Sold | Price | $/sf | Match |
|---|---|---|---|---|---|---|---|
| 122 Atwater St | 0.10mi | 6/3.0 | 3,407 (-3%) | 9mo | $430,000 | $126 | 83 |
| 181 Lombard St | 0.25mi | 6/3.0 | 3,222 (-8%) | 1mo | $462,500 | $144 | 74 |
| 544 Ferry St | 0.21mi | 6/2.0 | 3,355 (-4%) | 12mo | $540,000 | $161 | 69 |
| 36 Shelter St | 0.38mi | 7/3.0 (+1) | 3,161 (-10%) | 5mo | $440,000 | $139 | 57 |
| 483 Quinnipiac Ave | 0.70mi | 6/3.0 | 3,546 (+1%) | 13mo | $540,000 | $152 | 55 |
| 222 Dover St | 0.35mi | 6/3.0 | 3,108 (-11%) | 12mo | $294,800 | $95 | 54 |
| 800 Quinnipiac Ave | 0.60mi | 7/3.0 (+1) | 3,126 (-11%) | 0mo | $725,000 | $232 | 48 |
| 1380 State St | 0.59mi | 7/3.0 (+1) | 3,101 (-12%) | 1mo | $415,000 | $134 | 48 |
| 60 Chatham St | 0.29mi | 5/3.0 (-1) | 3,053 (-13%) | 16mo | $444,000 | $145 | 46 |
| 248 Lexington Ave | 0.71mi | 6/3.0 | 3,303 (-6%) | 18mo | $450,000 | $136 | 42 |
| 252 James St | 0.53mi | 7/3.0 (+1) | 3,071 (-12%) | 18mo | $365,000 | $119 | 35 |
| 26 Clifton St | 0.59mi | 6/5.0 | 3,888 (+11%) | 19mo | $495,000 | $127 | 31 |
Match score weights: distance 35% · size 25% · config 20% · recency 20%. Top-matched comps best support the ARV.
Projected returns pro-forma
-3.0% appreciation · 4.12% rent growth · sell at horizon
- IRR
- -11.2%
- Equity multiple
- 0.59×
- Total profit
- $-56,055
- Equity at exit
- $72,315
- IRR
- -0.4%
- Equity multiple
- 0.97×
- Total profit
- $-3,793
- Equity at exit
- $41,934
Cash invested: $135,800 (down + closing). Projections, not guarantees.
Landlord ↔ Tenant lean methodology
- Overall (STATE)
- 27 Tenant-Leaning
- State Connecticut
- 27 Tenant-Leaning · D+7
- County
- — inherits STATE
- City
- — inherits STATE
ZIP-level market 06513
- Home prices YoY
- -7.8%
- Rents YoY
- 4.1%
- Active inventory
- 102
- Price-to-rent
- 17.2×
Monthly cashflow live
- Estimated rent
- $4,712 high interval (Pro) →
- Mortgage (P&I)
- −$2,543
- Tax from tax record
- −$710 /mo · $8,515/yr
- Insurance
- −$202
- HOA
- −$0
- Vacancy / Maint / Mgmt
- −$990
- Net cashflow
- $267
Break-even live
Sensitivity live
| Price | -10% $542 | -5% $405 | +0% $267 | +5% $130 | +10% $-7 |
|---|---|---|---|---|---|
| Rent | -10% $-105 | -5% $81 | +0% $267 | +5% $454 | +10% $640 |
| Rate | -1.0pp $512 | -0.5pp $391 | base $267 | +0.5pp $142 | +1.0pp $14 |
2-unit breakdown (identical units grouped — click to expand)
| Units | Beds | Baths | Est. rent |
|---|---|---|---|
| 2× units | 2 | 1 | $4,712 |
| #1 | 2 | 1 | $2,356 |
| #2 | 2 | 1 | $2,356 |
| Total (2 units) | $4,712 | ||
UW: 25.0% down · 7.5% · 30yr · 1.5% tax · 5.0% vac · 8.0% maint · 8.0% mgmt
Financing live
Cash to close
- Down payment
- $121,250
- Closing costs
- $14,550
- Reserves months
- —
- Total cash needed
- —
Loan-product check · same deal, 3 products live
Conventional
25% down · 7.5% · 30yr
- Down + closing
- —
- Monthly P&I
- —
- Monthly cashflow
- —
- DSCR
- —
- Eligible?
- —
Personal DTI + credit; lowest rate.
DSCR
20% down · 8.5% · 30yr
- Down + closing
- —
- Monthly P&I
- —
- Monthly cashflow
- —
- DSCR
- —
- Eligible?
- —
No personal income docs; deal must DSCR.
Hard money
10% down · 12.0% · 12mo
- Down + closing
- —
- Monthly P&I
- —
- Monthly cashflow
- —
- DSCR
- —
- Eligible?
- —
Short-term bridge; refi at stabilization.
Rent comps 1 comps
| Address | Beds | Baths | Sqft | Rent | $/sqft | DOM | Units | Dist |
|---|---|---|---|---|---|---|---|---|
| 30 Trumbull St New Haven, CT | 5.0 | 4.0 | 2668 | $5,000 | $1.87 | 5d | 1 | 1.30mi |
Listing history 3 events
-
2026-04-17status Under Contract
-
2026-04-07$485,000 Active
-
1998-09-04soldstatus $100,000
ⓘ Source: listings_history table (triggers on properties + properties_extension) + one-shot
backfill from property_details.listing_events for pre-trigger history.
Tax reassessment forecast CT · Partial reset (capped growth)
- Current annual tax
- $8,515 · $710/mo
- Projected year-2 tax
- $9,447 · $787/mo
- Expected delta
- +$932/yr (+$78/mo · 10.9%)
ⓘ Screening estimate from a state-policy table — verify with the county assessor before closing.
Climate risk First Street
- Flood 1/10 Low FEMA zone X (unshaded) · 0% chance over 30 yrs
- Wildfire 3/10 Moderate
- Heat 7/10 Severe 7 d/yr ≥99°F today · 16 d/yr by 30 yrs out
- Wind 6/10 Major 56% chance of damaging wind over 30 yrs
- Air quality 5/10 Major 6 unhealthy d/yr today · 8 by 30 yrs out
Nearby sold comps map
Loading sold comps map…
Walkable amenities ~0.75 mi
Loading nearby amenities…
Taxation est. · year 1
- Rental income
- $56,544
- − Mortgage interest
- −$27,168
- − Property taxes
- −$8,515
- − Insurance
- −$2,425
- − Repairs & maintenance
- −$4,524
- − Management
- −$4,524
- − Depreciation
- −$14,109
- Taxable loss
- −$4,720
- Est. tax savings @ 24.0%
- +$1,133
- After-tax cash flow
- $4,342/yr
For passive investors: Depreciation is non-cash, so a rental often shows a tax loss while cash-flowing — sheltering income. Rental losses are passive: they offset passive income freely, and up to $25,000/yr can offset ordinary (W-2) income if you actively participate and your MAGI is under $100k (phasing out to $0 by $150k); unused losses carry forward. On sale, claimed depreciation is recaptured at up to 25%, and gains may owe capital-gains tax (a 1031 exchange can defer both). Figures are a year-1 estimate at your 24.0% rate — not tax advice; consult a CPA.
Schools (NCES district)
- District
- New Haven School District
- NCES district ID
- 0902790
- Math proficiency
- 12% ▼ -10.00%
- Reading proficiency
- 25% ▼ -10.00%
- Median HH income
- $38,058
- Composite
- 15.48/100
- National rank
- #9308
- State rank
- #147 of 153 in CT
Livability — New Haven
- Score
- 79/100
- State rank
- #31
- US rank
- #2190
Category grades
Schools grade is shown separately in the Schools card above.
Census & demographics
- Census place
- New Haven, CT
- County
- New Haven County · 688,236 people
- City population
- 132,813
- Metro
- New Haven-Milford, CT
- Population (ZIP)
- 38,888
- Household income
- $48,500
- Rent vs Own
- Severe rent burden
- 2664.0
Population outlook (South Central Connecticut County) Hauer SSP2
- By 2040
- 608,362
Race, ethnicity, and origin ACS 2023
- Neighborhood character
- Diverse neighborhood (Simpson 0.66)
- Race & ethnicity
- Hispanic / Latino 47% White 26% Black 22% Two or more races 12% Asian 1%
- Hispanic origin (detail)
- Mexican 7% Puerto Rican 25% Dominican 2%
- Common ancestry
- Romanian 2% Lithuanian 1% Slovak 1%
- Foreign-born
- 17% · Canada, Jamaica, South Korea
- Languages at home
- 56% English-only · Spanish 39% Other Indo-European 1% Russian/Polish/Slavic 1%
Political lean MEDSL · South Central Connecticut
- 2024 margin
- Strong D (+20.1) · D 59.0% · R 38.9% · Other 2.1%
- All cycles
- 2024: D+20.1
Not yet ingested
- Civics
- —
Market trends
- HPI YoY
- ▼ -30.87%
- Current HPI
- 364.006
- Rent YoY
- ▲ 4.12%
- Metro
- New Haven-Milford, CT
- State GDP YoY
- ▲ 1.06%
- F500 in state
- 38
Industry mix (Fortune 500 HQ in CT)
| Industry | F500 HQs | Revenue |
|---|---|---|
| Industrial Machinery | 4 | $38B |
|
||
| Insurance | 3 | $71B |
|
||
| Financial Services | 2 | $25B |
|
||
| Transportation / Logistics | 2 | $18B |
|
||
| Healthcare | 1 | $247B |
|
||
| Telecommunications | 1 | $55B |
|
||
Price history
+385.0% since first listed3 events — show timeline
- 2026-04-17 Pending — Smart MLS
- 2026-04-07 Listed $485,000 Smart MLS
- 1998-09-04 Sold (Public Records) $100,000 Public Records
Property tax history
+4.9%/yrLatest (2023): $8,515 · -6.4% YoY. Source: county tax records.
Cash-flow waterfall
monthlySold comps — $/sqft
last 12 mo · ≤1 miLoading sold comps…