1630 Highway 178 W · Midway, AR
Flood risk No data
- FEMA flood zone
- —
- Chance of flooding over 30 yrs
- —
- Est. flood insurance / yr
- —
Fire risk No data
- Est. fire insurance / yr
- —
Heat risk No data
- Hot days now (above threshold)
- —
- Hot days in 30 yrs
- —
Wind risk No data
- Chance of severe wind over 30 yrs
- —
Air-quality risk No data
- Unhealthy air days now
- —
- Unhealthy air days in 30 yrs
- —
Risk factors via First Street. Map © Google.
Why this score? — see what drove the C grade
The composite is a weighted blend of 9 inputs, each scored 0–100. Each bar is that input's sub-score; the figure is the points it added to the 100-point composite (weight × sub-score).
- Cash flow +15.1/30.0
- ARV discount +15.0/15.0
- Appreciation +6.9/10.0
- DSCR +4.6/10.0
- 1% rule +4.2/10.0
- Schools +3.7/10.0
- Livability +3.3/5.0
- Rent growth +2.5/5.0
- Condition / age +2.5/5.0
$94,500
🖨 Deal sheet 📄 Offer letter ✓ Due diligence
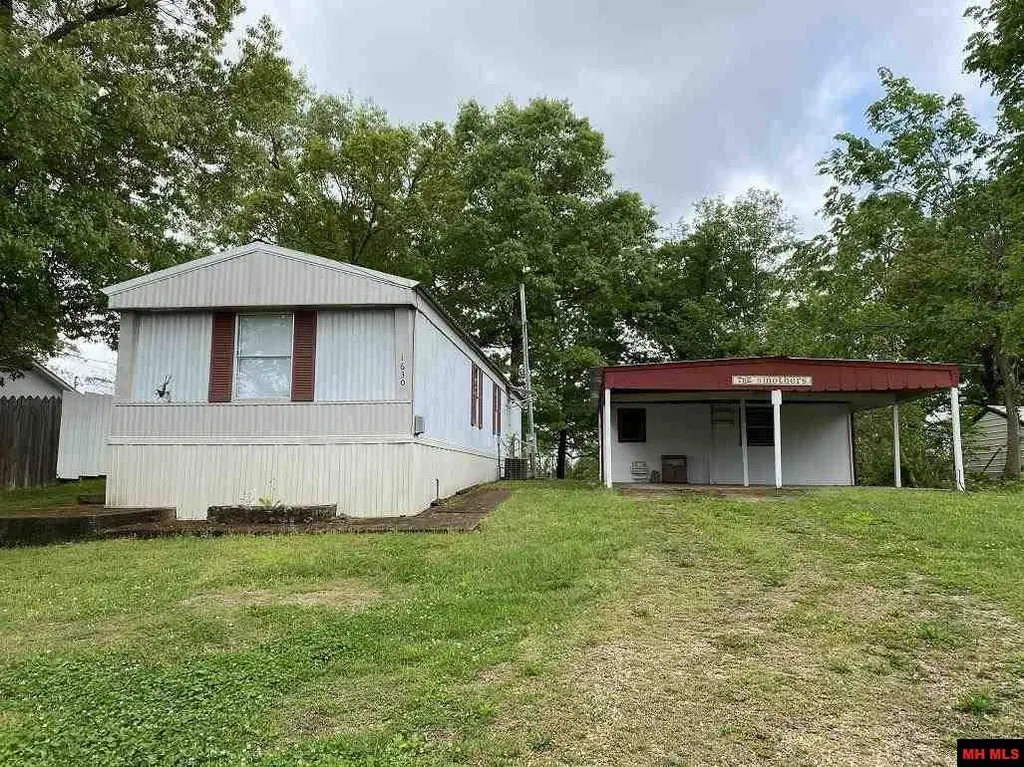
Listing remarks MLS
Very clean 2 bedroom/2 bath mobile home with small detached 2 car carport and workshop. Very large level back yard, new flooring throughout. All appliances remain and some furniture will convey with accepted offer.
Key facts
- Central heat
- Boat landing
- Rural water
Tags
Neighborhood map
What this means for you Summary
Snapshot
- This is a 2-bed/2.0-bath manufactured listed at $94k.
Deal economics
- At list price, monthly cash flow is $31 ($376/yr) — positive.
- The deal already cash-flows at list — no discount required.
- To meet the 1% rule (rent ≥ 1% of price), the offer needs to be $87k (8.3% below list).
- Recommended offer: $87k (8.3% below list) — sets the bar for 1% rule.
- Cap rate 6.7% vs local median 2.5% in Midway — top-decile yield for the area; either an underpriced asset or a hidden risk that comps aren't pricing in. Stress-test before assuming the spread holds.
Location & tenants
- Location reads 66/100 on livability (#139 in AR) — a middle-class / working-renter tenant base. Strengths: cost of living A+, housing A+, crime A-; Watch: schools F, amenities F, commute F.
- Mountain Home School District (town): math 45% / reading 45% proficiency, ranked #40 of 238 in AR (top 17%) — families likely to look elsewhere, expect single-tenant / working-renter base with shorter leases.
- Market conditions: 17 active listings in the ZIP; 47 units permitted in Baxter County in 2024 (0 in 5+ unit buildings).
Forward outlook
- In year one you build about $4k of equity ($653 loan paydown + $4k appreciation (3.9% local appreciation)).
- Baxter County population projected to shrink 9% by 2050 — rents likely to lag national; underwrite the cash flow, not the appreciation.
- At projected returns (3.9% appreciation + 3.0% rent growth), your $26k cash investment doubles in ~5 years — after that, you're playing with house money.
- By year 8, paydown + projected appreciation supports a ~$32k cash-out refi (75% LTV) — recoverable capital for the next deal without selling this one.
Negotiation context
- Only 1 days on market — expect competitive offers; lowballing is unlikely to land.
- 2 sale attempts since 7y ago; this cycle's ask is 89% above the opening price — seller raised mid-cycle; expect resistance to lowballs.
- Current owner paid $46k; list at $94k implies a 105% gain — meaningful room to come down on a strong offer.
Questions for the listing agent
- Is there a deadline driving the sale (1031 exchange, divorce, estate, relocation)? That informs how much negotiation room exists.
- Schools are F-rated, which usually means shorter tenancies and higher turnover. Who's the typical renter profile here, and what's been the actual vacancy rate?
- What's the average days-on-market for RENTAL listings here right now (not sales)? A rising rental-DOM trend means longer vacancies and softer asking-rent achievability than the comps imply.
- What's the recent tenant-quality profile in this submarket — average credit score on applications, eviction rate, late-payment / NSF rate, and stable-employment percentage? A property-management company in the area should have these aggregated.
- How much new for-sale + rental construction is in the pipeline within 1–3 miles? Heavy new supply typically softens prices + rents 12–24 months out; constrained supply supports both.
Investment metrics
- 1% rule
- 0.92% ✗
- Cap rate
- 6.69%
- Cash-on-cash
- 1.42%
- DSCR
- 1.06
- GRM
- 9.1
CMA / ARV
- ARV (on-the-fly)
- $114,688
- Comps found
- 2
Show comp detail 2 sales within ~0.75 mi
| Address | Dist | Beds/Ba | Sqft | Sold | Price | $/sf | Match |
|---|---|---|---|---|---|---|---|
| 49 Tafel Ln | 0.67mi | 2/2.0 | 896 (0%) | 17mo | $115,000 | $128 | 54 |
| 2131 Highway 178 Hwy | 0.48mi | 2/1.0 | 784 (-12%) | 3mo | $12,000 | $15 | 50 |
Match score weights: distance 35% · size 25% · config 20% · recency 20%. Top-matched comps best support the ARV.
Projected returns pro-forma
3.88% appreciation · 3.0% rent growth · sell at horizon
- IRR
- 11.2%
- Equity multiple
- 1.68×
- Total profit
- $17,888
- Equity at exit
- $47,272
- IRR
- 12.9%
- Equity multiple
- 3.10×
- Total profit
- $55,561
- Equity at exit
- $76,811
Cash invested: $26,460 (down + closing). Projections, not guarantees.
Landlord ↔ Tenant lean methodology
- Overall (STATE)
- 92 Strongly Landlord-Friendly
- State Arkansas
- 92 Strongly Landlord-Friendly · R+14
- County
- — inherits STATE
- City
- — inherits STATE
ZIP-level market 72651
- Home prices YoY
- 1.7%
- Active inventory
- 17
- Price-to-rent
- 9.1×
Monthly cashflow live
- Estimated rent
- $866 medium interval (Pro) →
- Mortgage (P&I)
- −$496
- Tax est. 1.5%
- −$118 /mo · $1,418/yr
- Insurance
- −$39
- HOA
- −$0
- Vacancy / Maint / Mgmt
- −$182
- Net cashflow
- $31
Break-even live
UW: 25.0% down · 7.5% · 30yr · 1.5% tax · 5.0% vac · 8.0% maint · 8.0% mgmt
Financing live
Cash to close
- Down payment
- $23,625
- Closing costs
- $2,835
- Reserves months
- —
- Total cash needed
- —
Loan-product check · same deal, 3 products live
Conventional
25% down · 7.5% · 30yr
- Down + closing
- —
- Monthly P&I
- —
- Monthly cashflow
- —
- DSCR
- —
- Eligible?
- —
Personal DTI + credit; lowest rate.
DSCR
20% down · 8.5% · 30yr
- Down + closing
- —
- Monthly P&I
- —
- Monthly cashflow
- —
- DSCR
- —
- Eligible?
- —
No personal income docs; deal must DSCR.
Hard money
10% down · 12.0% · 12mo
- Down + closing
- —
- Monthly P&I
- —
- Monthly cashflow
- —
- DSCR
- —
- Eligible?
- —
Short-term bridge; refi at stabilization.
Listing history 8 events
-
2021-05-27soldstatus $46,000 214-char remark
Show marketing remark (214 chars)
Very clean 2 bedroom/2 bath mobile home with small detached 2 car carport and workshop. Very large level back yard, new flooring throughout. All appliances remain and some furniture will convey with accepted offer.
-
2021-05-27soldstatus $46,000
Show marketing remark (214 chars)
Very clean 2 bedroom/2 bath mobile home with small detached 2 car carport and workshop. Very large level back yard, new flooring throughout. All appliances remain and some furniture will convey with accepted offer.
-
2021-05-08$49,900 214-char remark
Show marketing remark (214 chars)
Very clean 2 bedroom/2 bath mobile home with small detached 2 car carport and workshop. Very large level back yard, new flooring throughout. All appliances remain and some furniture will convey with accepted offer.
-
2019-04-29soldstatus $40,000 207-char remark
Show marketing remark (207 chars)
NICE 2 BR 2 BA MOBILE WITH 0.57 ACRES M/L. 2 CAR CARPORT WITH ATTACHED WORKSHOP AREA. LARGE BACKYARD. GREAT STARTER HOME OR VACATION PROPERTY. MINUTES FROM BULL SHOALS LAKE AND JUST OUTSIDE OF MOUNTAIN HOME.
-
2019-04-29soldstatus $40,000
Show marketing remark (207 chars)
NICE 2 BR 2 BA MOBILE WITH 0.57 ACRES M/L. 2 CAR CARPORT WITH ATTACHED WORKSHOP AREA. LARGE BACKYARD. GREAT STARTER HOME OR VACATION PROPERTY. MINUTES FROM BULL SHOALS LAKE AND JUST OUTSIDE OF MOUNTAIN HOME.
-
2019-04-01$45,900 207-char remark
Show marketing remark (207 chars)
NICE 2 BR 2 BA MOBILE WITH 0.57 ACRES M/L. 2 CAR CARPORT WITH ATTACHED WORKSHOP AREA. LARGE BACKYARD. GREAT STARTER HOME OR VACATION PROPERTY. MINUTES FROM BULL SHOALS LAKE AND JUST OUTSIDE OF MOUNTAIN HOME.
-
2009-06-25soldstatus $46,000
-
2002-02-01soldstatus $36,000
ⓘ Source: listings_history table (triggers on properties + properties_extension) + one-shot
backfill from property_details.listing_events for pre-trigger history.
Nearby sold comps map
Loading sold comps map…
Walkable amenities ~0.75 mi
Loading nearby amenities…
Taxation est. · year 1
- Rental income
- $10,396
- − Mortgage interest
- −$5,293
- − Property taxes
- −$1,418
- − Insurance
- −$472
- − Repairs & maintenance
- −$832
- − Management
- −$832
- − Depreciation
- −$2,749
- Taxable loss
- −$1,200
- Est. tax savings @ 24.0%
- +$288
- After-tax cash flow
- $664/yr
For passive investors: Depreciation is non-cash, so a rental often shows a tax loss while cash-flowing — sheltering income. Rental losses are passive: they offset passive income freely, and up to $25,000/yr can offset ordinary (W-2) income if you actively participate and your MAGI is under $100k (phasing out to $0 by $150k); unused losses carry forward. On sale, claimed depreciation is recaptured at up to 25%, and gains may owe capital-gains tax (a 1031 exchange can defer both). Figures are a year-1 estimate at your 24.0% rate — not tax advice; consult a CPA.
Schools (NCES district)
- District
- Mountain Home School District
- NCES district ID
- 0500043
- Math proficiency
- 45% ▼ -8.00%
- Reading proficiency
- 45% ▼ -4.00%
- Median HH income
- $36,966
- Composite
- 37.4/100
- National rank
- #4424
- State rank
- #40 of 238 in AR
Livability — Midway
- Score
- 66/100
- State rank
- #139
- US rank
- #12379
Category grades
Schools grade is shown separately in the Schools card above.
Census & demographics
- Census place
- Midway, AR
- City population
- 1,422
- Population (ZIP)
- 1,422
Population outlook (Baxter County) Hauer SSP2
- Today (2025)
- 39,886 people
- By 2030
- 39,226 · -1.7%
- By 2040
- 37,810 · -5.2%
- By 2050
- 36,287 · -9.0%
- By 2075
- 32,965 · -17.4%
- By 2100
- 28,002 · -29.8%
Race, ethnicity, and origin ACS 2023
- Neighborhood character
- Predominantly White (90%)
- Race & ethnicity
- White 90% Asian 5% Two or more races 5%
- Common ancestry
- Serbian 4% Lithuanian 2% Romanian 1%
- Foreign-born
- 2% · South Korea
- Languages at home
- 97% English-only · Korean 2% German/W. Germanic 1%
Political lean MEDSL · Baxter
- 2024 margin
- Solid R (+56.9) · D 20.7% · R 77.6% · Other 1.7%
- 2008→2024 swing
- -25.3pp toward R · 2008: -31.6pp · 2024: -56.9pp
- All cycles
- 2024: R+56.9 2020: R+53.3 2016: R+53.6 2012: R+44.0 2008: R+31.6
Not yet ingested
- Civics
- —
Market trends
- HPI YoY
- ▲ 3.88%
- Current HPI
- 232.2963
- Rent YoY
- —
- Metro
- —
- State GDP YoY
- ▲ 3.80%
- F500 in state
- 10
Industry mix (Fortune 500 HQ in AR)
| Industry | F500 HQs | Revenue |
|---|---|---|
| Retail | 1 | $681B |
|
||
| Food / Agriculture | 1 | $53B |
|
||
| Retail / Energy | 1 | $22B |
|
||
| Transportation / Logistics | 1 | $12B |
|
||
| Energy | 1 | $4B |
|
||
Price history
+27.8% since first listed8 events — show timeline
- 2021-05-27 Sold (Public Records) $46,000 Public Records
- 2021-05-27 Sold (MLS) $46,000 MHMLS
- 2021-05-08 Listed $49,900 MHMLS
- 2019-04-29 Sold (Public Records) $40,000 Public Records
- 2019-04-29 Sold (MLS) $40,000 MHMLS
- 2019-04-01 Listed $45,900 MHMLS
- 2009-06-25 Sold (Public Records) $46,000 Public Records
- 2002-02-01 Sold (Public Records) $36,000 Public Records
Property tax history
-17.3%/yrLatest (2025): $19 · +33.3% YoY. Source: county tax records.
Cash-flow waterfall
monthlySold comps — $/sqft
last 12 mo · ≤1 miLoading sold comps…