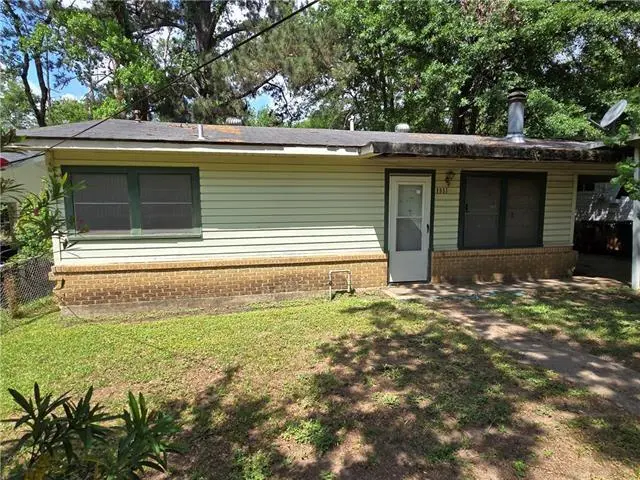
1311 Jeannie St · Pineville, LA
Flood risk 9/10 · Severe
- FEMA flood zone
- X
- Chance of flooding over 30 yrs
- 0.99%
- Est. flood insurance / yr
- $507 – $1,088
Fire risk 1/10 · Minimal
- Est. fire insurance / yr
- $1,269 – $2,357
Heat risk 8/10 · Major
- Hot days now (above 111°F)
- 7 days/yr
- Hot days in 30 yrs
- 19 days/yr
Wind risk 8/10 · Major
- Chance of severe wind over 30 yrs
- 98.0%
Air-quality risk 1/10 · Minimal
- Unhealthy air days now
- 0 days/yr
- Unhealthy air days in 30 yrs
- 0 days/yr
Risk factors via First Street. Map © Google.
Why this score? — see what drove the B grade
The composite is a weighted blend of 9 inputs, each scored 0–100. Each bar is that input's sub-score; the figure is the points it added to the 100-point composite (weight × sub-score).
- Cash flow +30.0/30.0
- ARV discount +12.6/15.0
- DSCR +10.0/10.0
- 1% rule +9.4/10.0
- Livability +3.7/5.0
- Schools +3.1/10.0
- Rent growth +2.5/5.0
- Condition / age +2.5/5.0
- Appreciation +0.0/10.0
$62,000
🖨 Deal sheet (PDF) 📄 Offer letter ✓ Due diligence
Listing remarks
Come make your dreams come true. This 2 bedroom 1 bath home would make a great renovation home, rental or flip home. Home is close to 28 east with all shopping. Call for your showing.
Key facts
- 8,712 sq ft lot
- Parking
- Built 1950
Property features AI
Finance
- Other: Directions: Hwy 28 to Palmetto to Cherry to Jeannie; home on left (bounding streets: Palmetto and expressway); 15 photos available
Exterior
- Parking: Carport
- Home design: Single-family residence
- Construction: Vinyl siding and brick exterior; Composition roof
- Exterior features: Workshop on the property; Acreage
Interior
- Kitchen: Kitchen (general)
- Bedrooms: Two bedrooms
- Bathrooms: One full bathroom
- Heating & cooling: Has heating (other type); No central cooling
- Interior features: Living room; Kitchen; Bedroom 1; Bedroom 2; Fireplace (other type)
Neighborhood map
What this means for you Summary
Snapshot
- This is a 2-bed/1.0-bath single-family listed at $62k.
Deal economics
- At list price, monthly cash flow is $218 ($3k/yr) — positive.
- The deal already cash-flows at list — no discount required.
- Meets the 1% rule at list price ($891 rent vs $62k).
- Recommended offer: $60k (3.0% below list) — sets the bar for market timing.
- Cap rate 11.8% vs local median 4.2% in Pineville — top-decile yield for the area; either an underpriced asset or a hidden risk that comps aren't pricing in. Stress-test before assuming the spread holds.
Location & tenants
- Location reads 73/100 on livability (#38 in LA) — a middle-class / working-renter tenant base. Strengths: cost of living A+, housing A+, health & safety A+; Watch: employment C-, crime D-, amenities F.
- Rapides Parish (urban): math 29% / reading 44% proficiency, ranked #31 of 98 in LA (top 32%) — families likely to look elsewhere, expect single-tenant / working-renter base with shorter leases; 64% free/reduced lunch — lower-income household profile, screen leases tightly.
- Market conditions: 239 active listings in the ZIP; 1 comparable units currently listed for rent nearby; 239 units permitted in Rapides Parish in 2024 (0 in 5+ unit buildings).
- This rent is only 18% of the median local income ($61k/yr) — well below the 30% rent-burden line; pricing power to push rent on renewal without tenant pushback.
Forward outlook
- Local home prices are declining (-3.0%/yr); year-one equity from $429 of loan paydown is wiped out by about $2k of value loss. Plan a longer hold.
- Rapides County population projected to shrink 6% by 2050 — rents likely to lag national; underwrite the cash flow, not the appreciation.
- At projected returns (-3.0% appreciation + 3.0% rent growth), your $17k cash investment doubles in ~8 years — after that, you're playing with house money.
Negotiation context
- It's been on market 35 days — a 3% lower offer ($60k) is reasonable based on typical stale-listing flexibility.
Risks & watch-outs
- Watch-outs: flood insurance adds $66/mo; built in 1950 — expect roof / HVAC / electrical / plumbing capex.
- Climate carrying-cost: severe flood risk; severe wind risk, 98% chance of damaging wind over 30y; extreme-heat days projected 7→19/yr by 2055 (HVAC capex compounding) — expect insurance premiums to compound above CPI over the hold.
Questions for the listing agent
- It's been on market 35 days. Have you received any prior offers? Is the seller open to a 3% concession, seller financing, or rate buy-down credit?
- Built in 1950 — when were the roof, HVAC, electrical panel, plumbing, and water heater last replaced?
- What's the actual annual flood-insurance premium (NFIP or private), and is the property in a SFHA with mandatory coverage?
- Is there a deadline driving the sale (1031 exchange, divorce, estate, relocation)? That informs how much negotiation room exists.
- Schools are B-rated — typically a magnet for longer-tenancy family renters. What's the average tenant stay here, and is there a school-zone premium baked into asking?
- Crime grade is D in this area — have there been break-ins, vandalism, or insurance claims at this property in the last 3 years? What carrier currently insures it and at what premium?
- What's the average days-on-market for RENTAL listings here right now (not sales)? A rising rental-DOM trend means longer vacancies and softer asking-rent achievability than the comps imply.
- What's the recent tenant-quality profile in this submarket — average credit score on applications, eviction rate, late-payment / NSF rate, and stable-employment percentage? A property-management company in the area should have these aggregated.
- How much new for-sale + rental construction is in the pipeline within 1–3 miles? Heavy new supply typically softens prices + rents 12–24 months out; constrained supply supports both.
Investment metrics
- 1% rule
- 1.44% ✓
- Cap rate
- 11.80%
- Cash-on-cash
- 19.65%
- DSCR
- 1.87
- GRM
- 5.8
CMA / ARV
- ARV (median comp)
- $70,000
- List price
- $62,000
- Delta
- -11.43%
- Verdict
- UNDERPRICED
- Comps
- 3 within 1.0 mi
Show comp detail 1 sale within ~0.75 mi
| Address | Dist | Beds/Ba | Sqft | Sold | Price | $/sf | Match |
|---|---|---|---|---|---|---|---|
| 20 Purser St | 0.52mi | 2/1.0 | 804 (+0%) | 3mo | $100,000 | $124 | 73 |
Match score weights: distance 35% · size 25% · config 20% · recency 20%. Top-matched comps best support the ARV.
Projected returns pro-forma
-3.0% appreciation · 3.0% rent growth · sell at horizon
- IRR
- 5.7%
- Equity multiple
- 1.22×
- Total profit
- $3,879
- Equity at exit
- $9,244
- IRR
- 15.2%
- Equity multiple
- 2.24×
- Total profit
- $21,445
- Equity at exit
- $5,361
Cash invested: $17,360 (down + closing). Projections, not guarantees.
Landlord ↔ Tenant lean methodology
- Overall (STATE)
- 90 Strongly Landlord-Friendly
- State Louisiana
- 90 Strongly Landlord-Friendly · R+12
- County
- — inherits STATE
- City
- — inherits STATE
ZIP-level market 71360
- Home prices YoY
- -26.9%
- Active inventory
- 239
- Price-to-rent
- 5.8×
Monthly cashflow live
- Estimated rent
- $891 medium interval (Pro) →
- Mortgage (P&I)
- −$325
- Tax from tax record
- −$69 /mo · $826/yr
- Insurance
- −$26
- Flood insurance flood zone
- −$66 /mo · $798/yr
- HOA
- −$0
- Vacancy / Maint / Mgmt
- −$187
- Net cashflow
- $218
Break-even live
Sensitivity live
| Price | -10% $253 | -5% $235 | +0% $218 | +5% $200 | +10% $183 |
|---|---|---|---|---|---|
| Rent | -10% $147 | -5% $183 | +0% $218 | +5% $253 | +10% $288 |
| Rate | -1.0pp $249 | -0.5pp $234 | base $218 | +0.5pp $202 | +1.0pp $185 |
UW: 25.0% down · 7.5% · 30yr · 1.5% tax · 5.0% vac · 8.0% maint · 8.0% mgmt
Financing live
Cash to close
- Down payment
- $15,500
- Closing costs
- $1,860
- Reserves months
- —
- Total cash needed
- —
Loan-product check · same deal, 3 products live
Conventional
25% down · 7.5% · 30yr
- Down + closing
- —
- Monthly P&I
- —
- Monthly cashflow
- —
- DSCR
- —
- Eligible?
- —
Personal DTI + credit; lowest rate.
DSCR
20% down · 8.5% · 30yr
- Down + closing
- —
- Monthly P&I
- —
- Monthly cashflow
- —
- DSCR
- —
- Eligible?
- —
No personal income docs; deal must DSCR.
Hard money
10% down · 12.0% · 12mo
- Down + closing
- —
- Monthly P&I
- —
- Monthly cashflow
- —
- DSCR
- —
- Eligible?
- —
Short-term bridge; refi at stabilization.
Rent comps 1 comps
| Address | Beds | Baths | Sqft | Rent | $/sqft | DOM | Units | Dist |
|---|---|---|---|---|---|---|---|---|
| 424 Forest St Pineville, LA | 2.0 | 1.0 | 800 | $750 | $0.94 | 44d | 1 | 0.61mi |
Listing history 18 events
-
2026-06-19days on market $62,000 Active 35 DOM
-
2026-06-18days on market $62,000 Active 34 DOM
-
2026-06-17days on market $62,000 Active 33 DOM
-
2026-06-16days on market $62,000 Active 32 DOM
-
2026-06-15days on market $62,000 Active 31 DOM
-
2026-06-14days on market $62,000 Active 29 DOM
-
2026-06-13days on market $62,000 Active 28 DOM
-
2026-06-10days on market $62,000 Active 26 DOM
-
2026-06-09days on market $62,000 Active 25 DOM
-
2026-06-08days on market $62,000 Active 24 DOM
-
2026-06-07days on market $62,000 Active 23 DOM
-
2026-06-03pricedays on market $62,000 Active 19 DOM
-
2026-06-02days on market $67,000 Active 18 DOM
-
2026-06-01days on market $67,000 Active 17 DOM
-
2026-05-31days on market $67,000 Active 16 DOM
-
2026-05-30days on market $67,000 Active 15 DOM
-
2026-05-14$67,000 Active 183-char remark
-
2019-02-19soldstatus $130,000
ⓘ Source: listings_history table (triggers on properties + properties_extension) + one-shot
backfill from property_details.listing_events for pre-trigger history.
Tax reassessment forecast LA · Resets to sale price
- Current annual tax
- $826 · $69/mo
- Projected year-2 tax
- $826 · $69/mo
- Expected delta
- $0/yr ($0/mo · 0.0%)
ⓘ Screening estimate from a state-policy table — verify with the county assessor before closing.
Climate risk First Street
- Flood 9/10 Extreme FEMA zone X · 99% chance over 30 yrs
- Wildfire 1/10 Low
- Heat 8/10 Severe 7 d/yr ≥111°F today · 19 d/yr by 30 yrs out
- Wind 8/10 Severe 98% chance of damaging wind over 30 yrs
- Air quality 1/10 Low 0 unhealthy d/yr today · 0 by 30 yrs out
Nearby sold comps map
Loading sold comps map…
Walkable amenities ~0.75 mi
Loading nearby amenities…
Taxation est. · year 1
- Rental income
- $10,696
- − Mortgage interest
- −$3,473
- − Property taxes
- −$826
- − Insurance
- −$1,108
- − Repairs & maintenance
- −$856
- − Management
- −$856
- − Depreciation
- −$1,804
- Taxable income
- $1,774
- Est. tax owed @ 24.0%
- −$426
- After-tax cash flow
- $2,189/yr
For passive investors: Depreciation is non-cash, so a rental often shows a tax loss while cash-flowing — sheltering income. Rental losses are passive: they offset passive income freely, and up to $25,000/yr can offset ordinary (W-2) income if you actively participate and your MAGI is under $100k (phasing out to $0 by $150k); unused losses carry forward. On sale, claimed depreciation is recaptured at up to 25%, and gains may owe capital-gains tax (a 1031 exchange can defer both). Figures are a year-1 estimate at your 24.0% rate — not tax advice; consult a CPA.
Schools (NCES district)
- District
- Rapides Parish
- NCES district ID
- 2201290
- Math proficiency
- 29% ▼ -34.00%
- Reading proficiency
- 44% ▼ -29.00%
- Median HH income
- $41,057
- Composite
- 30.68/100
- National rank
- #6179
- State rank
- #31 of 98 in LA
Livability — Pineville
- Score
- 73/100
- State rank
- #38
- US rank
- #5613
Category grades
Schools grade is shown separately in the Schools card above.
Census & demographics
- Census place
- Pineville, LA
- County
- Rapides Parish · 59,791 people
- City population
- 34,653
- Metro
- Alexandria, LA
- Population (ZIP)
- 34,653
- Household income
- $60,527
- Rent vs Own
- Severe rent burden
- 960.0
Population outlook (Rapides County) Hauer SSP2
- Today (2025)
- 133,047 people
- By 2030
- 132,333 · -0.5%
- By 2040
- 129,355 · -2.8%
- By 2050
- 124,535 · -6.4%
- By 2075
- 110,338 · -17.1%
- By 2100
- 88,641 · -33.4%
Race, ethnicity, and origin ACS 2023
- Neighborhood character
- Predominantly White (71%)
- Race & ethnicity
- White 71% Black 19% Two or more races 6% Hispanic / Latino 3%
- Common ancestry
- Lithuanian 7% Serbian 1% Slovak 1%
- Foreign-born
- 2% · China
- Languages at home
- 96% English-only · Spanish 3%
Political lean MEDSL · Rapides
- 2024 margin
- Solid R (+36.8) · D 31.0% · R 67.7% · Other 1.3%
- 2008→2024 swing
- -8.1pp toward R · 2008: -28.7pp · 2024: -36.8pp
- All cycles
- 2024: R+36.8 2020: R+32.1 2016: R+32.5 2012: R+29.6 2008: R+28.7
Not yet ingested
- Civics
- —
Market trends
- HPI YoY
- ▼ -74.92%
- Current HPI
- 203.0411
- Rent YoY
- —
- Metro
- Alexandria, LA
- State GDP YoY
- ▲ 3.29%
- F500 in state
- 10
Industry mix (Fortune 500 HQ in LA)
| Industry | F500 HQs | Revenue |
|---|---|---|
| Telecommunications | 2 | $23B |
|
||
| Utilities | 1 | $12B |
|
||
| Wholesale / Distribution | 1 | $5B |
|
||
| Advertising | 1 | $2B |
|
||
Price history
-52.3% since first listed3 events — show timeline
- 2026-06-03 Price Changed $62,000 AcadianaMLS
- 2026-05-14 Listed $67,000 AcadianaMLS
- 2019-02-19 Sold (Public Records) $130,000 Public Records
Property tax history
+1.3%/yrLatest (2025): $826 · +13.9% YoY. Source: county tax records.
Cash-flow waterfall
monthlySold comps — $/sqft
last 12 mo · ≤1 miLoading sold comps…