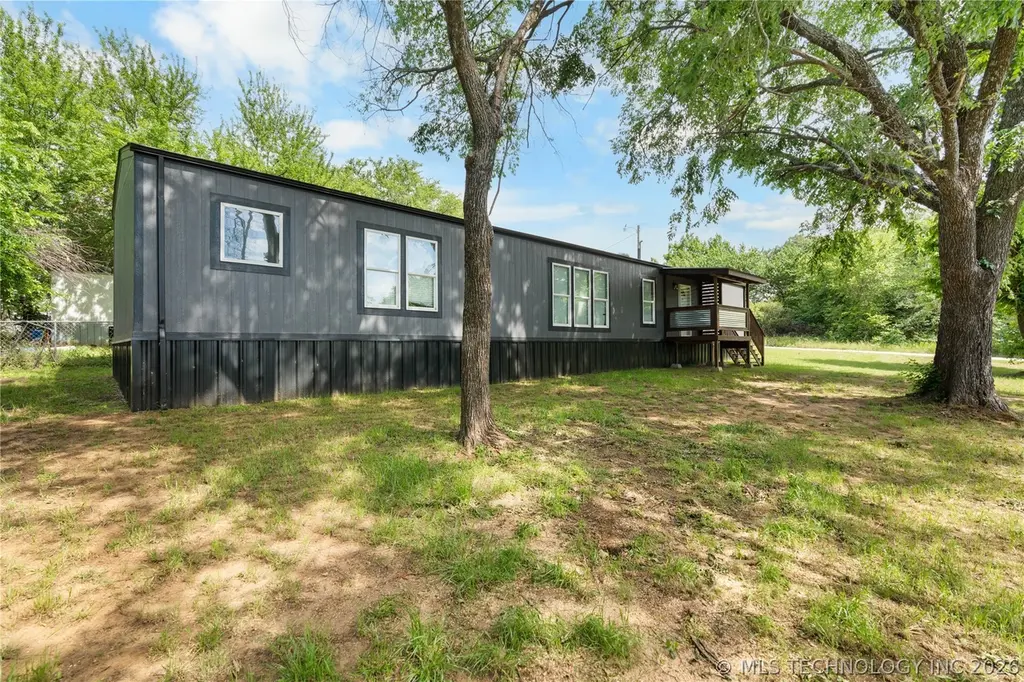
2109 Hawk · McBride, OK
Flood risk 1/10 · Minimal
- FEMA flood zone
- X
- Chance of flooding over 30 yrs
- 0.0%
- Est. flood insurance / yr
- $507 – $1,088
Fire risk 4/10 · Minor
- Est. fire insurance / yr
- $2,463 – $4,575
Heat risk 6/10 · Moderate
- Hot days now (above 109°F)
- 7 days/yr
- Hot days in 30 yrs
- 21 days/yr
Wind risk 4/10 · Minor
- Chance of severe wind over 30 yrs
- 16.0%
Air-quality risk 3/10 · Minor
- Unhealthy air days now
- 2 days/yr
- Unhealthy air days in 30 yrs
- 3 days/yr
Risk factors via First Street. Map © Google.
Why this score? — see what drove the B+ grade
The composite is a weighted blend of 9 inputs, each scored 0–100. Each bar is that input's sub-score; the figure is the points it added to the 100-point composite (weight × sub-score).
- Cash flow +30.0/30.0
- 1% rule +10.0/10.0
- DSCR +10.0/10.0
- Appreciation +10.0/10.0
- ARV discount +7.5/15.0
- Rent growth +2.5/5.0
- Schools +2.5/10.0
- Livability +2.5/5.0
- Condition / age +2.5/5.0
$140,000
🖨 Deal sheet 📄 Offer letter ✓ Due diligence
Listing remarks
Less than 5 miles from beautiful Lake Texoma, this recently updated single-wide offers the perfect blend of comfort, style, and convenience! Step inside to an open-concept layout featuring spacious living areas, modern finishes, rich wood cabinetry, and an oversized kitchen island perfect for entertaining. The home has been thoughtfully refreshed with updated flooring, fixtures, and a warm contemporary feel throughout. Outside, enjoy the custom wooden front porch, the perfect spot to relax and take in the peaceful surroundings. Recent exterior improvements include fresh exterior paint, a new roof, and new gutters, giving this home added curb appeal and peace of mind. Mature trees and plenty
Key facts
- Updated flooring
- Open-concept layout
- 5,955 sq ft lot
Tags
Property features AI
Finance
- HOA & community: Gutters noted as a community feature
Exterior
- Security: No safety shelter
- Utilities: Rural water; Lagoon sewer
- Home design: Single wide manufactured home; 1 story; Faces west; Tie-down foundation
- Construction: HardiPlank-type siding; Manufactured construction; Metal roof
- Exterior features: Covered patio/porch; Deck; Porch; Rain gutters; Privacy fencing; Mature trees on lot
Interior
- Kitchen: Dishwasher; Oven; Range; Stove; Refrigerator; Electric oven/range connections
- Flooring: Carpet; Wood veneer
- Bathrooms: 2 full bathrooms
- Heating & cooling: Central heating (electric); Central air conditioning
- Interior features: Laminate countertops; Ceiling fan(s); Insulated vinyl windows; Other interior features
- Laundry & utility: Electric dryer hookup
Neighborhood map
What this means for you Summary
Snapshot
- This is a 3-bed/2.0-bath other listed at $140k.
Deal economics
- At list price, monthly cash flow is $851 ($10k/yr) — positive.
- The deal already cash-flows at list — no discount required.
- Meets the 1% rule at list price ($2k rent vs $140k).
- Recommended offer: $136k (3.0% below list) — sets the bar for market timing.
Location & tenants
- Location reads: area grade B — affects rentability + tenant quality, not the cash-flow math above.
- Kingston (rural): math 27% / reading 32% proficiency, ranked #70 of 270 in OK (top 26%) — low school quality limits family demand, transient renter base, plan for 1-2y turnover; 76% free/reduced lunch — lower-income household profile, screen leases tightly.
- Market conditions: 435 active listings in the ZIP; 42 units permitted in Marshall County in 2024 (0 in 5+ unit buildings).
Forward outlook
- In year one you build about $15k of equity ($968 loan paydown + $14k appreciation (10.0% local appreciation)).
- Marshall County population projected at +22% by 2050 — long-run rental-demand tailwind backs the buy-and-hold thesis.
- At projected returns (10.0% appreciation + 3.0% rent growth), your $39k cash investment doubles in ~2 years — after that, you're playing with house money.
- By year 3, paydown + projected appreciation supports a ~$38k cash-out refi (75% LTV) — recoverable capital for the next deal without selling this one.
Negotiation context
- It's been on market 39 days — a 3% lower offer ($136k) is reasonable based on typical stale-listing flexibility.
- 4 sale attempts with the ask held roughly flat each time — persistent listings suggest the price (not the market) is what's stuck; bring a comps-based counter.
- Current owner paid $15k; list at $140k implies a 833% gain — meaningful room to come down on a strong offer.
Risks & watch-outs
- Climate carrying-cost: extreme-heat days projected 7→21/yr by 2055 (HVAC capex compounding) — expect insurance premiums to compound above CPI over the hold.
Questions for the listing agent
- It's been on market 39 days. Have you received any prior offers? Is the seller open to a 3% concession, seller financing, or rate buy-down credit?
- Is there a deadline driving the sale (1031 exchange, divorce, estate, relocation)? That informs how much negotiation room exists.
- What's the average days-on-market for RENTAL listings here right now (not sales)? A rising rental-DOM trend means longer vacancies and softer asking-rent achievability than the comps imply.
- What's the recent tenant-quality profile in this submarket — average credit score on applications, eviction rate, late-payment / NSF rate, and stable-employment percentage? A property-management company in the area should have these aggregated.
- How much new for-sale + rental construction is in the pipeline within 1–3 miles? Heavy new supply typically softens prices + rents 12–24 months out; constrained supply supports both.
Investment metrics
- 1% rule
- 1.64% ✓
- Cap rate
- 13.59%
- Cash-on-cash
- 26.05%
- DSCR
- 2.16
- GRM
- 5.1
CMA / ARV
No comps found within radius.
Projected returns pro-forma
10.0% appreciation · 3.0% rent growth · sell at horizon
- IRR
- 43.9%
- Equity multiple
- 4.33×
- Total profit
- $130,474
- Equity at exit
- $126,123
- IRR
- 38.0%
- Equity multiple
- 9.72×
- Total profit
- $341,677
- Equity at exit
- $271,989
Cash invested: $39,200 (down + closing). Projections, not guarantees.
Landlord ↔ Tenant lean methodology
- Overall (STATE)
- 83 Strongly Landlord-Friendly
- State Oklahoma
- 83 Strongly Landlord-Friendly · R+20
- County
- — inherits STATE
- City
- — inherits STATE
ZIP-level market 73439
- Home prices YoY
- 12.3%
- Active inventory
- 435
- Price-to-rent
- 5.1×
Monthly cashflow live
- Estimated rent
- $2,302 medium interval (Pro) →
- Mortgage (P&I)
- −$734
- Tax est. 1.5%
- −$175 /mo · $2,100/yr
- Insurance
- −$58
- HOA
- −$0
- Vacancy / Maint / Mgmt
- −$483
- Net cashflow
- $851
Break-even live
UW: 25.0% down · 7.5% · 30yr · 1.5% tax · 5.0% vac · 8.0% maint · 8.0% mgmt
Financing live
Cash to close
- Down payment
- $35,000
- Closing costs
- $4,200
- Reserves months
- —
- Total cash needed
- —
Loan-product check · same deal, 3 products live
Conventional
25% down · 7.5% · 30yr
- Down + closing
- —
- Monthly P&I
- —
- Monthly cashflow
- —
- DSCR
- —
- Eligible?
- —
Personal DTI + credit; lowest rate.
DSCR
20% down · 8.5% · 30yr
- Down + closing
- —
- Monthly P&I
- —
- Monthly cashflow
- —
- DSCR
- —
- Eligible?
- —
No personal income docs; deal must DSCR.
Hard money
10% down · 12.0% · 12mo
- Down + closing
- —
- Monthly P&I
- —
- Monthly cashflow
- —
- DSCR
- —
- Eligible?
- —
Short-term bridge; refi at stabilization.
Listing history 30 events
-
2026-06-19days on market $140,000 Active 39 DOM
-
2026-06-18days on market $140,000 Active 38 DOM
-
2026-06-17days on market $140,000 Active 37 DOM
-
2026-06-16days on market $140,000 Active 36 DOM
-
2026-06-15days on market $140,000 Active 35 DOM
-
2026-06-14days on market $140,000 Active 33 DOM
-
2026-06-13days on market $140,000 Active 32 DOM
-
2026-06-10days on market $140,000 Active 30 DOM
-
2026-06-09days on market $140,000 Active 29 DOM
-
2026-06-08days on market $140,000 Active 28 DOM
-
2026-06-07days on market $140,000 Active 27 DOM
-
2026-06-05days on market $140,000 Active 24 DOM
-
2026-06-02days on market $140,000 Active 22 DOM
-
2026-06-01days on market $140,000 Active 21 DOM
-
2026-05-31days on market $140,000 Active 20 DOM
-
2026-05-30days on market $140,000 Active 19 DOM
-
2026-05-11$140,000 Active
-
2026-04-26historical
-
2026-03-10price $153,999
-
2026-02-20price $154,999
-
2026-02-07price $155,999
-
2026-01-30price $156,999
-
2026-01-23price $157,999
-
2026-01-16$158,999 Active
-
2026-01-15historical
-
2025-12-16price $159,999
-
2025-11-27$164,999 Active
-
2025-07-30soldstatus $15,000 Closed
-
2025-07-24status Pending
-
2025-07-01$20,000 Active
ⓘ Source: listings_history table (triggers on properties + properties_extension) + one-shot
backfill from property_details.listing_events for pre-trigger history.
Climate risk First Street
- Flood 1/10 Low FEMA zone X · 0% chance over 30 yrs
- Wildfire 4/10 Moderate
- Heat 6/10 Major 7 d/yr ≥109°F today · 21 d/yr by 30 yrs out
- Wind 4/10 Moderate 16% chance of damaging wind over 30 yrs
- Air quality 3/10 Moderate 2 unhealthy d/yr today · 3 by 30 yrs out
Nearby sold comps map
Loading sold comps map…
Walkable amenities ~0.75 mi
Loading nearby amenities…
Taxation est. · year 1
- Rental income
- $27,621
- − Mortgage interest
- −$7,842
- − Property taxes
- −$2,100
- − Insurance
- −$700
- − Repairs & maintenance
- −$2,210
- − Management
- −$2,210
- − Depreciation
- −$4,073
- Taxable income
- $8,486
- Est. tax owed @ 24.0%
- −$2,037
- After-tax cash flow
- $8,173/yr
For passive investors: Depreciation is non-cash, so a rental often shows a tax loss while cash-flowing — sheltering income. Rental losses are passive: they offset passive income freely, and up to $25,000/yr can offset ordinary (W-2) income if you actively participate and your MAGI is under $100k (phasing out to $0 by $150k); unused losses carry forward. On sale, claimed depreciation is recaptured at up to 25%, and gains may owe capital-gains tax (a 1031 exchange can defer both). Figures are a year-1 estimate at your 24.0% rate — not tax advice; consult a CPA.
Schools (NCES district)
- District
- Kingston
- NCES district ID
- 4016590
- Math proficiency
- 27% ▼ -7.00%
- Reading proficiency
- 32% ▼ -7.00%
- Median HH income
- $40,655
- Composite
- 24.88/100
- National rank
- #7585
- State rank
- #70 of 270 in OK
Livability — McBride
No livability data for this city. (Only ~50 U.S. cities are tracked.)
Census & demographics
- Population (ZIP)
- 7,011
Population outlook (Marshall County) Hauer SSP2
- Today (2025)
- 17,405 people
- By 2030
- 18,038 · +3.6%
- By 2040
- 19,513 · +12.1%
- By 2050
- 21,283 · +22.3%
- By 2075
- 27,884 · +60.2%
- By 2100
- 35,435 · +103.6%
Race, ethnicity, and origin ACS 2023
- Neighborhood character
- Predominantly White (75%)
- Race & ethnicity
- White 75% Two or more races 16% Native American 5% Hispanic / Latino 4%
- Common ancestry
- Lithuanian 3% Italian 2% Serbian 1%
- Foreign-born
- 1% · Canada
- Languages at home
- 97% English-only · Spanish 3%
Political lean MEDSL · Marshall
- 2024 margin
- Solid R (+63.4) · D 17.7% · R 81.2% · Other 1.1%
- 2008→2024 swing
- -24.6pp toward R · 2008: -38.8pp · 2024: -63.4pp
- All cycles
- 2024: R+63.4 2020: R+62.5 2016: R+56.6 2012: R+45.7 2008: R+38.8
Not yet ingested
- Civics
- —
Market trends
- HPI YoY
- ▲ 26.96%
- Current HPI
- 246.2253
- Rent YoY
- —
- Metro
- —
- State GDP YoY
- ▲ 1.55%
- F500 in state
- 6
Industry mix (Fortune 500 HQ in OK)
| Industry | F500 HQs | Revenue |
|---|---|---|
| Energy | 3 | $48B |
|
||
Price history
+600.0% since first listed14 events — show timeline
- 2026-05-11 Listed $140,000 MLS Technology, Inc.
- 2026-04-26 Listing Removed — MLS Technology, Inc.
- 2026-03-10 Price Changed $153,999 MLS Technology, Inc.
- 2026-02-20 Price Changed $154,999 MLS Technology, Inc.
- 2026-02-07 Price Changed $155,999 MLS Technology, Inc.
- 2026-01-30 Price Changed $156,999 MLS Technology, Inc.
- 2026-01-23 Price Changed $157,999 MLS Technology, Inc.
- 2026-01-16 Listed $158,999 MLS Technology, Inc.
- 2026-01-15 Listing Removed — MLS Technology, Inc.
- 2025-12-16 Price Changed $159,999 MLS Technology, Inc.
- 2025-11-27 Listed $164,999 MLS Technology, Inc.
- 2025-07-30 Sold (MLS) $15,000 MLS Technology, Inc.
- 2025-07-24 Pending — MLS Technology, Inc.
- 2025-07-01 Listed $20,000 MLS Technology, Inc.
Property tax history
+4.6%/yrLatest (2025): $28 · +7.7% YoY. Source: county tax records.
Cash-flow waterfall
monthlySold comps — $/sqft
last 12 mo · ≤1 miLoading sold comps…