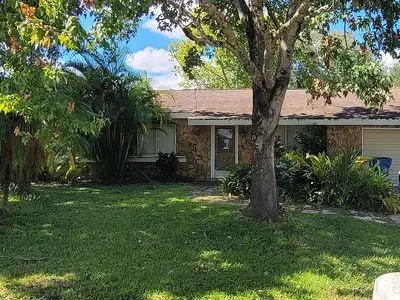
398 Riley Ave NE · Palm Bay, FL
Flood risk 1/10 · Minimal
- FEMA flood zone
- X (unshaded)
- Chance of flooding over 30 yrs
- 0.0%
- Est. flood insurance / yr
- $507 – $1,088
Fire risk 1/10 · Minimal
- Est. fire insurance / yr
- $947 – $1,759
Heat risk 9/10 · Severe
- Hot days now (above 106°F)
- 6 days/yr
- Hot days in 30 yrs
- 19 days/yr
Wind risk 10/10 · Severe
- Chance of severe wind over 30 yrs
- 99.0%
Air-quality risk 1/10 · Minimal
- Unhealthy air days now
- 0 days/yr
- Unhealthy air days in 30 yrs
- 0 days/yr
Risk factors via First Street. Map © Google.
Why this score? — see what drove the D- grade
The composite is a weighted blend of 9 inputs, each scored 0–100. Each bar is that input's sub-score; the figure is the points it added to the 100-point composite (weight × sub-score).
- Cash flow +9.2/30.0
- ARV discount +7.5/15.0
- Schools +4.7/10.0
- Livability +3.6/5.0
- 1% rule +2.7/10.0
- Rent growth +2.7/5.0
- DSCR +2.6/10.0
- Condition / age +2.5/5.0
- Appreciation +0.0/10.0
$240,000
🖨 Deal sheet 📄 Offer letter ✓ Due diligence
Listing remarks
Great location with easy access to I95, Palm Bay Hospital, dining, shopping, and major employers. Large lot with fenced rear yard with ample room for Boat or RV, or shed! Large French doors open to screened patio to lush back yard. Gorgeous luxury vinyl plank flooring in two bedrooms, tile in third bedroom, and wood veneer flooring throughout. AC and hot water heater relatively new with FP& amp; L bill of less than $100/month! New microwave and nice oak kitchen cabinets. New electrical panel. Brand new roof with peel-n-stick!!! Garage door opener with two remotes. Recent appraisal, 4-point inspection, and wind mitigation survey means low insurance costs. Currently rented until June 2
Key facts
- Screened patio
- Brand new roof
- Easy access to i95
Tags
Neighborhood map
What this means for you Summary
Snapshot
- This is a 2-bed/2.0-bath single-family listed at $240k.
Deal economics
- At list price, monthly cash flow is $-179 ($-2k/yr) — negative.
- To cash-flow at today's rent, offer at most $208k (13.2% below list).
- To meet the 1% rule (rent ≥ 1% of price), the offer needs to be $184k (23.2% below list).
- Recommended offer: $184k (23.2% below list) — sets the bar for 1% rule.
Location & tenants
- Location reads 72/100 on livability (#366 in FL) — a middle-class / working-renter tenant base. Strengths: cost of living A+, housing A+; Watch: schools C-, employment D+, amenities F.
- Brevard (suburban): math 53% / reading 57% proficiency, ranked #19 of 73 in FL (top 26%) — acceptable for families but not a draw, mixed tenant base, ~2y average lease.
- Market conditions: Rents flat; 739 active listings in the ZIP; 40 comparable units currently listed for rent nearby; rentals at typical pace (median 24d on market — plan ~3-4 weeks tenant-placement turnaround); solid renter incomes; 4,602 units permitted in Brevard County in 2024 (702 in 5+ unit buildings).
Forward outlook
- Local home prices are declining (-3.0%/yr); year-one equity from $2k of loan paydown is wiped out by about $7k of value loss. Plan a longer hold.
- Brevard County population projected at +15% by 2050 — modest demand growth; plan on rents tracking national, not racing it.
Negotiation context
- It's been on market 37 days — a 3% lower offer ($233k) is reasonable based on typical stale-listing flexibility.
- Current owner paid $100k; list at $240k implies a 140% gain — meaningful room to come down on a strong offer.
Risks & watch-outs
- Climate carrying-cost: severe wind risk, 99% chance of damaging wind over 30y; extreme-heat days projected 6→19/yr by 2055 (HVAC capex compounding) — expect insurance premiums to compound above CPI over the hold.
Questions for the listing agent
- What do current leases actually rent for vs. the listed asking? Can we see a recent rent roll and the last 12 months of T-12 income?
- It's been on market 37 days. Have you received any prior offers? Is the seller open to a 23% concession, seller financing, or rate buy-down credit?
- Is there a deadline driving the sale (1031 exchange, divorce, estate, relocation)? That informs how much negotiation room exists.
- The area grade is low — what's the realistic commute time and amenity access for the typical tenant pool here? Any planned neighborhood developments (good or bad) we should know about?
- What's the average days-on-market for RENTAL listings here right now (not sales)? A rising rental-DOM trend means longer vacancies and softer asking-rent achievability than the comps imply.
- What's the recent tenant-quality profile in this submarket — average credit score on applications, eviction rate, late-payment / NSF rate, and stable-employment percentage? A property-management company in the area should have these aggregated.
- How much new for-sale + rental construction is in the pipeline within 1–3 miles? Heavy new supply typically softens prices + rents 12–24 months out; constrained supply supports both.
Investment metrics
- 1% rule
- 0.77% ✗
- Cap rate
- 5.40%
- Cash-on-cash
- -3.20%
- DSCR
- 0.86
- GRM
- 10.9
CMA / ARV
No comps found within radius.
Projected returns pro-forma
-3.0% appreciation · 0.93% rent growth · sell at horizon
- IRR
- -23.9%
- Equity multiple
- 0.20×
- Total profit
- $-54,034
- Equity at exit
- $35,785
- IRR
- -25.9%
- Equity multiple
- -0.14×
- Total profit
- $-76,474
- Equity at exit
- $20,751
Cash invested: $67,200 (down + closing). Projections, not guarantees.
Landlord ↔ Tenant lean methodology
- Overall (STATE)
- 87 Strongly Landlord-Friendly
- State Florida
- 87 Strongly Landlord-Friendly · R+3
- County
- — inherits STATE
- City
- — inherits STATE
ZIP-level market 32907
- Home prices YoY
- -10.1%
- Rents YoY
- 0.9%
- Active inventory
- 739
- Price-to-rent
- 10.9×
Monthly cashflow live
- Estimated rent
- $1,842 high interval (Pro) →
- Mortgage (P&I)
- −$1,259
- Tax from tax record
- −$276 /mo · $3,310/yr
- Insurance
- −$100
- HOA
- −$0
- Vacancy / Maint / Mgmt
- −$387
- Net cashflow
- $-179
Break-even live
UW: 25.0% down · 7.5% · 30yr · 1.5% tax · 5.0% vac · 8.0% maint · 8.0% mgmt
Financing live
Cash to close
- Down payment
- $60,000
- Closing costs
- $7,200
- Reserves months
- —
- Total cash needed
- —
Loan-product check · same deal, 3 products live
Conventional
25% down · 7.5% · 30yr
- Down + closing
- —
- Monthly P&I
- —
- Monthly cashflow
- —
- DSCR
- —
- Eligible?
- —
Personal DTI + credit; lowest rate.
DSCR
20% down · 8.5% · 30yr
- Down + closing
- —
- Monthly P&I
- —
- Monthly cashflow
- —
- DSCR
- —
- Eligible?
- —
No personal income docs; deal must DSCR.
Hard money
10% down · 12.0% · 12mo
- Down + closing
- —
- Monthly P&I
- —
- Monthly cashflow
- —
- DSCR
- —
- Eligible?
- —
Short-term bridge; refi at stabilization.
Rent comps 40 comps
| Address | Beds | Baths | Sqft | Rent | $/sqft | DOM | Units | Dist |
|---|---|---|---|---|---|---|---|---|
| 453 Ralwood Ln NE Palm Bay, FL | 3.0 | 2.0 | 1160 | $1,900 | $1.64 | 23d | 1 | 0.29mi |
| 1391 Nolan St NE Palm Bay, FL | 3.0 | 2.0 | 1176 | $1,830 | $1.56 | 19d | 1 | 0.36mi |
| 1555 Omega St NE Palm Bay, FL | 2.0 | 2.0 | 1176 | $1,795 | $1.53 | 23d | 1 | 0.40mi |
| 194 Holiday Park Blvd NE Palm Bay, FL | 3.0 | 2.0 | 1404 | $1,695 | $1.21 | 23d | 1 | 0.45mi |
| 1706 Apache St NE Palm Bay, FL | 3.0 | 2.0 | 1395 | $1,800 | $1.29 | 23d | 1 | 0.46mi |
| 331 Holiday Park Blvd NE Palm Bay, FL | 2.0 | 2.0 | 920 | $1,350 | $1.47 | 23d | 1 | 0.86mi |
| 1625 Par St NE Unit 1205 Palm Bay, FL | 3.0 | 2.0 | 1208 | $2,300 | $1.90 | 23d | 1 | 0.94mi |
| 1625 Par St NE Unit 1203 Palm Bay, FL | 3.0 | 2.0 | 1208 | $2,075 | $1.72 | 23d | 1 | 0.94mi |
| 1635 Par St NE Unit 2103 Palm Bay, FL | 2.0 | 2.0 | 1025 | $2,100 | $2.05 | 23d | 1 | 0.95mi |
| 1635 Par St NE Unit 2203 Palm Bay, FL | 3.0 | 2.0 | 1208 | $2,300 | $1.90 | 23d | 1 | 0.95mi |
| 2181 Agora Cir SE Unit 206 Palm Bay, FL | 2.0 | 1.0 | 850 | $1,395 | $1.64 | 23d | 1 | 0.96mi |
| 1605 Par St NE Unit 3204 Palm Bay, FL | 3.0 | 2.0 | 1208 | $2,000 | $1.66 | 23d | 1 | 0.97mi |
| 1605 Par St NE Unit 3202 Palm Bay, FL | 3.0 | 2.0 | 1208 | $2,300 | $1.90 | 23d | 1 | 0.97mi |
| 1605 Par St NE Unit 3102 Palm Bay, FL | 2.0 | 2.0 | 1025 | $2,100 | $2.05 | 23d | 1 | 0.97mi |
| 1687 Avery Rd NE Palm Bay, FL | 2.0 | 2.0 | 876 | $1,800 | $2.05 | 23d | 1 | 0.98mi |
| 1625 Par St NE Unit 1104 Palm Bay, FL | 2.0 | 2.0 | 1025 | $2,100 | $2.05 | 23d | 1 | 1.00mi |
| 1625 Par St NE Unit 1107 Palm Bay, FL | 2.0 | 2.0 | 1025 | $1,875 | $1.83 | 23d | 1 | 1.00mi |
| 1625 Par St NE Unit 1206 Palm Bay, FL | 3.0 | 2.0 | 1208 | $2,050 | $1.70 | 23d | 1 | 1.00mi |
| 1625 Par St NE Unit 1207 Palm Bay, FL | 3.0 | 2.0 | 1208 | $2,025 | $1.68 | 23d | 1 | 1.00mi |
| 2041 Agora Cir SE Unit 2041-3 Palm Bay, FL | 2.0 | 1.5 | 1025 | $1,450 | $1.41 | 19d | 1 | 1.09mi |
| 1656 Sunny Brook Ln NE Unit L102 Palm Bay, FL | 3.0 | 2.0 | 914 | $1,690 | $1.85 | 21d | 1 | 1.11mi |
| 1907 Cleveland St NE Palm Bay, FL | 3.0 | 2.0 | 1320 | $1,985 | $1.50 | 23d | 1 | 1.14mi |
| 205 Valor Dr SE Palm Bay, FL | 1.0–2.0 | 1.0–2.0 | 901 | $1,937 | $2.15 | 14d | 17 | 1.16mi |
| 1984 Agora Cir SE #104 Palm Bay, FL | 2.0 | 2.0 | 784 | $1,440 | $1.84 | 14d | 1 | 1.16mi |
| 1870 Agora Cir SE #202 Palm Bay, FL | 2.0 | 1.0 | 875 | $1,375 | $1.57 | 23d | 1 | 1.18mi |
| 1608 Sunny Brook Ln Palm Bay, FL | 1.0–3.0 | 1.0–2.0 | 1040 | $1,412 | $1.36 | 23d | 6 | 1.19mi |
| 1884 Agora Cir SE Unit 203 Palm Bay, FL | 2.0 | 1.0 | 875 | $1,375 | $1.57 | 23d | 1 | 1.22mi |
| 3513 Tree Ridge Ln NE Palm Bay, FL | 2.0 | 2.5 | 1170 | $2,000 | $1.71 | 23d | 1 | 1.26mi |
| 1625 Sunny Brook Ln NE Unit G103 Palm Bay, FL | 3.0 | 2.0 | 914 | $1,700 | $1.86 | 23d | 1 | 1.28mi |
| 1641 Sunny Brook Ln NE Palm Bay, FL | 2.0 | 2.0 | 862 | $1,500 | $1.74 | 14d | 3 | 1.28mi |
| 1649 Sunny Brook Ln NE Palm Bay, FL | 1.0–2.0 | 1.0–2.0 | 760 | $1,950 | $2.57 | 14d | 2 | 1.28mi |
| 1601 Sunny Brook Ln NE Unit D101 Palm Bay, FL | 2.0 | 2.0 | 846 | $1,550 | $1.83 | 23d | 1 | 1.28mi |
| 3814 Tree Ridge Ln NE Palm Bay, FL | 2.0 | 2.5 | 1170 | $1,500 | $1.28 | 23d | 1 | 1.30mi |
| 1895 Convair St SE Unit 2202 Palm Bay, FL | 2.0 | 1.0 | 950 | $1,300 | $1.37 | 23d | 1 | 1.34mi |
| 2100 Forest Knoll Dr NE #202 Palm Bay, FL | 2.0 | 2.0 | 1069 | $1,600 | $1.50 | 14d | 1 | 1.35mi |
| 84 San Filippo Dr SE Palm Bay, FL | 1.0–3.0 | 1.0–2.0 | 1052 | $1,702 | $1.62 | 14d | 30 | 1.35mi |
| 440 Mercury Ave SE Apt E Palm Bay, FL | 2.0 | 1.0 | 900 | $1,250 | $1.39 | 21d | 1 | 1.36mi |
| 2130 Forest Knoll Dr NE #202 Palm Bay, FL | 2.0 | 2.0 | 1069 | $1,450 | $1.36 | 23d | 1 | 1.37mi |
| 1123 Tree Ridge Ln NE Palm Bay, FL | 2.0 | 1.0 | 870 | $1,350 | $1.55 | 23d | 1 | 1.39mi |
| 2235 Macedo Rd NE Palm Bay, FL | 2.0 | 2.0 | 1260 | $1,500 | $1.19 | 23d | 1 | 1.41mi |
Listing history 20 events
-
2026-06-18days on market $240,000 Active 37 DOM
-
2026-06-17days on market $240,000 Active 36 DOM
-
2026-06-16days on market $240,000 Active 35 DOM
-
2026-06-15days on market $240,000 Active 34 DOM
-
2026-06-14days on market $240,000 Active 32 DOM
-
2026-06-10days on market $240,000 Active 29 DOM
-
2026-06-08days on market $240,000 Active 27 DOM
-
2026-06-07days on market $240,000 Active 26 DOM
-
2026-06-05days on market $240,000 Active 23 DOM
-
2026-06-03days on market $240,000 Active 22 DOM
-
2026-06-02days on market $240,000 Active 21 DOM
-
2026-06-01days on market $240,000 Active 20 DOM
-
2026-05-31days on market $240,000 Active 19 DOM
-
2026-05-12$240,000 Active
-
2025-11-13soldstatus $100,000
-
2003-07-03soldstatus $84,000
-
1996-07-05soldstatus $64,000
-
1992-04-01soldstatus $53,200
-
1989-01-01soldstatus $47,900
-
1980-08-01soldstatus $49,900
ⓘ Source: listings_history table (triggers on properties + properties_extension) + one-shot
backfill from property_details.listing_events for pre-trigger history.
Tax reassessment forecast FL · Resets to sale price
- Current annual tax
- $3,310 · $276/mo
- Projected year-2 tax
- $3,310 · $276/mo
- Expected delta
- $0/yr ($0/mo · 0.0%)
ⓘ Screening estimate from a state-policy table — verify with the county assessor before closing.
Climate risk First Street
- Flood 1/10 Low FEMA zone X (unshaded) · 0% chance over 30 yrs
- Wildfire 1/10 Low
- Heat 9/10 Extreme 6 d/yr ≥106°F today · 19 d/yr by 30 yrs out
- Wind 10/10 Extreme 99% chance of damaging wind over 30 yrs
- Air quality 1/10 Low 0 unhealthy d/yr today · 0 by 30 yrs out
Nearby sold comps map
Loading sold comps map…
Walkable amenities ~0.75 mi
Loading nearby amenities…
Taxation est. · year 1
- Rental income
- $22,109
- − Mortgage interest
- −$13,444
- − Property taxes
- −$3,310
- − Insurance
- −$1,200
- − Repairs & maintenance
- −$1,769
- − Management
- −$1,769
- − Depreciation
- −$6,982
- Taxable loss
- −$6,364
- Est. tax savings @ 24.0%
- +$1,527
- After-tax cash flow
- $-620/yr
For passive investors: Depreciation is non-cash, so a rental often shows a tax loss while cash-flowing — sheltering income. Rental losses are passive: they offset passive income freely, and up to $25,000/yr can offset ordinary (W-2) income if you actively participate and your MAGI is under $100k (phasing out to $0 by $150k); unused losses carry forward. On sale, claimed depreciation is recaptured at up to 25%, and gains may owe capital-gains tax (a 1031 exchange can defer both). Figures are a year-1 estimate at your 24.0% rate — not tax advice; consult a CPA.
Schools (NCES district)
- District
- Brevard
- NCES district ID
- 1200150
- Math proficiency
- 53% ▼ -9.00%
- Reading proficiency
- 57% ▼ -4.00%
- Median HH income
- $49,426
- Composite
- 46.86/100
- National rank
- #2370
- State rank
- #19 of 73 in FL
Livability — Palm Bay
- Score
- 72/100
- State rank
- #366
- US rank
- #6458
Category grades
Schools grade is shown separately in the Schools card above.
Census & demographics
- Census place
- Palm Bay, FL
- County
- Brevard County · 602,871 people
- City population
- 132,211
- Metro
- Palm Bay-Melbourne-Titusville, FL
- Population (ZIP)
- 49,080
- Household income
- $75,311
- Rent vs Own
- Severe rent burden
- 702.0
Population outlook (Brevard County) Hauer SSP2
- Today (2025)
- 623,254 people
- By 2030
- 648,420 · +4.0%
- By 2040
- 690,009 · +10.7%
- By 2050
- 715,669 · +14.8%
- By 2075
- 775,744 · +24.5%
- By 2100
- 776,687 · +24.6%
Race, ethnicity, and origin ACS 2023
- Neighborhood character
- Diverse neighborhood (Simpson 0.62)
- Race & ethnicity
- White 56% Hispanic / Latino 21% Black 15% Two or more races 14% Asian 2%
- Hispanic origin (detail)
- Mexican 2% Puerto Rican 9% Cuban 2% Dominican 3%
- Common ancestry
- Romanian 2% Lithuanian 2% Hispanic 2%
- Foreign-born
- 16% · Canada, Jamaica
- Languages at home
- 77% English-only · Spanish 17% French/Haitian/Cajun 2% Other Indo-European 1%
Political lean MEDSL · Brevard
- 2024 margin
- Strong R (+20.8) · D 39.1% · R 59.9% · Other 1.0%
- 2008→2024 swing
- -10.4pp toward R · 2008: -10.4pp · 2024: -20.8pp
- All cycles
- 2024: R+20.8 2020: R+16.4 2016: R+19.8 2012: R+12.7 2008: R+10.4
Not yet ingested
- Civics
- —
Market trends
- HPI YoY
- ▼ -34.79%
- Current HPI
- 308.9719
- Rent YoY
- ▲ 0.93%
- Metro
- Palm Bay-Melbourne-Titusville, FL
- State GDP YoY
- ▲ 3.28%
- F500 in state
- 36
Industry mix (Fortune 500 HQ in FL)
| Industry | F500 HQs | Revenue |
|---|---|---|
| Industrial Technology | 2 | $29B |
|
||
| Insurance | 2 | $17B |
|
||
| Retail | 1 | $60B |
|
||
| Technology Distribution | 1 | $58B |
|
||
| Homebuilding | 1 | $35B |
|
||
| Technology Manufacturing | 1 | $35B |
|
||
Price history
+381.0% since first listed7 events — show timeline
- 2026-05-12 Listed $240,000 FSBO.com
- 2025-11-13 Sold (Public Records) $100,000 Public Records
- 2003-07-03 Sold (Public Records) $84,000 Public Records
- 1996-07-05 Sold (Public Records) $64,000 Public Records
- 1992-04-01 Sold (Public Records) $53,200 Public Records
- 1989-01-01 Sold (Public Records) $47,900 Public Records
- 1980-08-01 Sold (Public Records) $49,900 Public Records
Property tax history
+19.1%/yrLatest (2025): $3,310 · -7.4% YoY. Source: county tax records.
Cash-flow waterfall
monthlySold comps — $/sqft
last 12 mo · ≤1 miLoading sold comps…