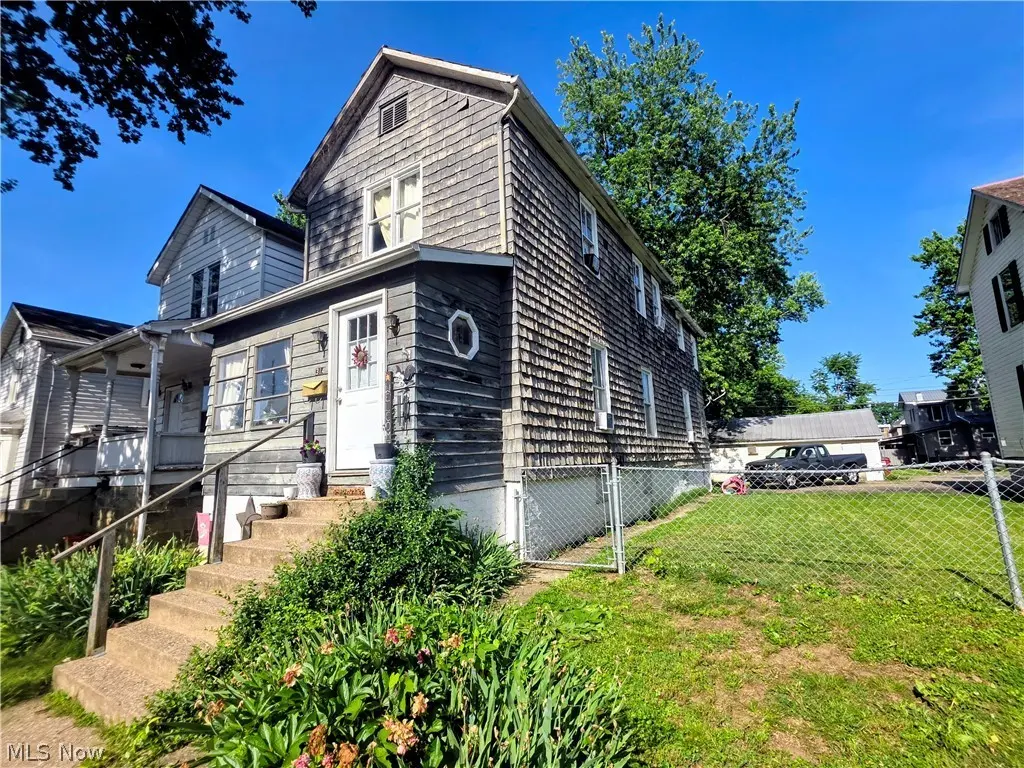
314 Harmar St · Marietta, OH
Flood risk 10/10 · Severe
- FEMA flood zone
- AE
- Chance of flooding over 30 yrs
- 0.99%
- Est. flood insurance / yr
- $2,026 – $9,024
Fire risk 1/10 · Minimal
- Est. fire insurance / yr
- $713 – $1,323
Heat risk 5/10 · Moderate
- Hot days now (above 101°F)
- 7 days/yr
- Hot days in 30 yrs
- 19 days/yr
Wind risk 2/10 · Minimal
- Chance of severe wind over 30 yrs
- 1.0%
Air-quality risk 2/10 · Minimal
- Unhealthy air days now
- 0 days/yr
- Unhealthy air days in 30 yrs
- 1 days/yr
Risk factors via First Street. Map © Google.
Why this score? — see what drove the B grade
The composite is a weighted blend of 9 inputs, each scored 0–100. Each bar is that input's sub-score; the figure is the points it added to the 100-point composite (weight × sub-score).
- Cash flow +30.0/30.0
- 1% rule +10.0/10.0
- DSCR +10.0/10.0
- ARV discount +7.5/15.0
- Livability +4.0/5.0
- Schools +3.5/10.0
- Rent growth +2.5/5.0
- Condition / age +2.5/5.0
- Appreciation +0.0/10.0
$85,000
🖨 Deal sheet 📄 Offer letter ✓ Due diligence
Listing remarks MLS
Fixer upper. Was garage in back but made into workshop/storage. Be a great rental.
Key facts
- Alley access
- Tenant occupied
- Generous lot
Tags
Property features AI
Exterior
- Parking: Detached garage (1 car)
- Utilities: Public water; Public sewer
- Home design: 2-story wood-sided home; Slate roof
- Construction: Wood siding construction; Slate roof
- Exterior features: Chain link fencing; Alley access
Interior
- Bedrooms: Total rooms: 6; Has basement (dirt floor, unfinished)
- Bathrooms: 1 full bathroom
- Heating & cooling: Forced air heating (gas); Window unit cooling
- Interior features: Decorative fireplace (1)
- Laundry & utility: Main level laundry
Neighborhood map
What this means for you Summary
Snapshot
- This is a 3-bed/1.0-bath single-family listed at $85k.
Deal economics
- At list price, monthly cash flow is $411 ($5k/yr) — positive.
- The deal already cash-flows at list — no discount required.
- Meets the 1% rule at list price ($2k rent vs $85k).
- Cap rate 18.6% vs local median 6.3% in Marietta — top-decile yield for the area; either an underpriced asset or a hidden risk that comps aren't pricing in. Stress-test before assuming the spread holds.
Location & tenants
- Location reads 80/100 on livability (#127 in OH, #1,845 nationally) — a professional / high-income tenant draw. Strengths: cost of living A+, housing A+, health & safety A+; Watch: commute F, employment D-.
- Marietta City (town): math 35% / reading 49% proficiency, ranked #534 of 656 in OH (top 81%) — families likely to look elsewhere, expect single-tenant / working-renter base with shorter leases.
- Market conditions: 118 active listings in the ZIP; 2 comparable units currently listed for rent nearby; 3 units permitted in Washington County in 2024 (0 in 5+ unit buildings).
- This rent runs 35% of the median local income ($60k/yr) — at the standard rent-burdened threshold; future hikes will face affordability resistance.
Forward outlook
- Local home prices are declining (-3.0%/yr); year-one equity from $588 of loan paydown is wiped out by about $3k of value loss. Plan a longer hold.
- Washington County population projected at -12% by 2050 — secular population decline; favor cash flow + early exit over multi-decade hold.
- At projected returns (-3.0% appreciation + 3.0% rent growth), your $24k cash investment doubles in ~6 years — after that, you're playing with house money.
Negotiation context
- Only 1 days on market — expect competitive offers; lowballing is unlikely to land.
- 2 sale attempts since 10y ago with the ask held roughly flat each time — persistent listings suggest the price (not the market) is what's stuck; bring a comps-based counter.
- Current owner paid $11k; list at $85k implies a 673% gain — meaningful room to come down on a strong offer.
Risks & watch-outs
- Watch-outs: flood insurance adds $460/mo; built in 1936 — expect roof / HVAC / electrical / plumbing capex.
- Climate carrying-cost: in FEMA flood zone AE (mandatory federal flood insurance); extreme-heat days projected 7→19/yr by 2055 (HVAC capex compounding) — expect insurance premiums to compound above CPI over the hold.
Questions for the listing agent
- Built in 1936 — when were the roof, HVAC, electrical panel, plumbing, and water heater last replaced?
- What's the actual annual flood-insurance premium (NFIP or private), and is the property in a SFHA with mandatory coverage?
- Is there a deadline driving the sale (1031 exchange, divorce, estate, relocation)? That informs how much negotiation room exists.
- Schools are B-rated — typically a magnet for longer-tenancy family renters. What's the average tenant stay here, and is there a school-zone premium baked into asking?
- What's the average days-on-market for RENTAL listings here right now (not sales)? A rising rental-DOM trend means longer vacancies and softer asking-rent achievability than the comps imply.
- What's the recent tenant-quality profile in this submarket — average credit score on applications, eviction rate, late-payment / NSF rate, and stable-employment percentage? A property-management company in the area should have these aggregated.
- How much new for-sale + rental construction is in the pipeline within 1–3 miles? Heavy new supply typically softens prices + rents 12–24 months out; constrained supply supports both.
Investment metrics
- 1% rule
- 2.09% ✓
- Cap rate
- 18.60%
- Cash-on-cash
- 43.95%
- DSCR
- 2.96
- GRM
- 4.0
CMA / ARV
- ARV (on-the-fly)
- $199,716
- Comps found
- 12
Show comp detail 12 sales within ~0.75 mi
| Address | Dist | Beds/Ba | Sqft | Sold | Price | $/sf | Match |
|---|---|---|---|---|---|---|---|
| 309 Harmar St | 0.04mi | 3/2.0 | 1,632 (+8%) | 6mo | $26,070 | $16 | 77 |
| 111 High St | 0.37mi | 2/1.0 (-1) | 1,440 (-5%) | 9mo | $132,500 | $92 | 62 |
| 217 Coventry Rd | 0.59mi | 3/1.0 | 1,456 (-4%) | 6mo | $169,000 | $116 | 61 |
| 107 Victory Pl | 0.34mi | 4/1.0 (+1) | 1,418 (-6%) | 18mo | $230,000 | $162 | 53 |
| 104 Pearl St | 0.36mi | 3/2.0 | 1,398 (-8%) | 17mo | $46,000 | $33 | 52 |
| 101 Dye Cir | 0.56mi | 3/2.0 | 1,416 (-6%) | 12mo | $225,000 | $159 | 49 |
| 212 Coventry Rd | 0.63mi | 3/2.5 | 1,404 (-7%) | 12mo | $265,000 | $189 | 43 |
| 623 Front St | 0.63mi | 4/2.5 (+1) | 1,400 (-8%) | 10mo | $185,151 | $132 | 39 |
| 106 Cheyenne Rd | 0.73mi | 3/1.5 | 1,323 (-13%) | 5mo | $232,000 | $175 | 38 |
| 625 Front St | 0.64mi | 3/2.5 | 1,700 (+12%) | 8mo | $169,900 | $100 | 37 |
| 204 Coventry Rd | 0.66mi | 4/3.0 (+1) | 1,352 (-11%) | 5mo | $232,000 | $172 | 34 |
| 205 Coventry Rd | 0.63mi | 4/1.5 (+1) | 1,680 (+11%) | 20mo | $219,000 | $130 | 29 |
Match score weights: distance 35% · size 25% · config 20% · recency 20%. Top-matched comps best support the ARV.
Projected returns pro-forma
-3.0% appreciation · 3.0% rent growth · sell at horizon
- IRR
- 13.3%
- Equity multiple
- 1.53×
- Total profit
- $12,700
- Equity at exit
- $12,674
- IRR
- 22.3%
- Equity multiple
- 2.93×
- Total profit
- $45,917
- Equity at exit
- $7,349
Cash invested: $23,800 (down + closing). Projections, not guarantees.
Landlord ↔ Tenant lean methodology
- Overall (STATE)
- 73 Landlord-Friendly
- State Ohio
- 73 Landlord-Friendly · R+6
- County
- — inherits STATE
- City
- — inherits STATE
ZIP-level market 45750
- Home prices YoY
- -32.4%
- Active inventory
- 118
- Price-to-rent
- 4.0×
Monthly cashflow live
- Estimated rent
- $1,779 medium interval (Pro) →
- Mortgage (P&I)
- −$446
- Tax from tax record
- −$53 /mo · $631/yr
- Insurance
- −$35
- Flood insurance flood zone
- −$460 /mo · $5,525/yr
- HOA
- −$0
- Vacancy / Maint / Mgmt
- −$374
- Net cashflow
- $411
Break-even live
UW: 25.0% down · 7.5% · 30yr · 1.5% tax · 5.0% vac · 8.0% maint · 8.0% mgmt
Financing live
Cash to close
- Down payment
- $21,250
- Closing costs
- $2,550
- Reserves months
- —
- Total cash needed
- —
Loan-product check · same deal, 3 products live
Conventional
25% down · 7.5% · 30yr
- Down + closing
- —
- Monthly P&I
- —
- Monthly cashflow
- —
- DSCR
- —
- Eligible?
- —
Personal DTI + credit; lowest rate.
DSCR
20% down · 8.5% · 30yr
- Down + closing
- —
- Monthly P&I
- —
- Monthly cashflow
- —
- DSCR
- —
- Eligible?
- —
No personal income docs; deal must DSCR.
Hard money
10% down · 12.0% · 12mo
- Down + closing
- —
- Monthly P&I
- —
- Monthly cashflow
- —
- DSCR
- —
- Eligible?
- —
Short-term bridge; refi at stabilization.
Rent comps 2 comps
| Address | Beds | Baths | Sqft | Rent | $/sqft | DOM | Units | Dist |
|---|---|---|---|---|---|---|---|---|
| 621 Virginia St #5 Marietta, OH | 3.0 | 2.0 | 1240 | $1,695 | $1.37 | 43d | 1 | 0.59mi |
| 803 3rd St Marietta, OH | 3.0 | 2.0 | 1659 | $2,000 | $1.21 | 43d | 1 | 0.92mi |
Listing history 3 events
-
2026-06-03status $85,000 Pending 1 DOM
-
2026-06-03remarks 685-char remark
-
2026-06-03$85,000 Active 1 DOM
ⓘ Source: listings_history table (triggers on properties + properties_extension) + one-shot
backfill from property_details.listing_events for pre-trigger history.
Tax reassessment forecast OH · Partial reset (capped growth)
- Current annual tax
- $631 · $53/mo
- Projected year-2 tax
- $978 · $82/mo
- Expected delta
- +$348/yr (+$29/mo · 55.1%)
ⓘ Screening estimate from a state-policy table — verify with the county assessor before closing.
Climate risk First Street
- Flood 10/10 Extreme FEMA zone AE · 99% chance over 30 yrs
- Wildfire 1/10 Low
- Heat 5/10 Major 7 d/yr ≥101°F today · 19 d/yr by 30 yrs out
- Wind 2/10 Low 100% chance of damaging wind over 30 yrs
- Air quality 2/10 Low 0 unhealthy d/yr today · 1 by 30 yrs out
Nearby sold comps map
Loading sold comps map…
Walkable amenities ~0.75 mi
Loading nearby amenities…
Taxation est. · year 1
- Rental income
- $21,349
- − Mortgage interest
- −$4,761
- − Property taxes
- −$631
- − Insurance
- −$5,950
- − Repairs & maintenance
- −$1,708
- − Management
- −$1,708
- − Depreciation
- −$2,473
- Taxable income
- $4,118
- Est. tax owed @ 24.0%
- −$988
- After-tax cash flow
- $3,947/yr
For passive investors: Depreciation is non-cash, so a rental often shows a tax loss while cash-flowing — sheltering income. Rental losses are passive: they offset passive income freely, and up to $25,000/yr can offset ordinary (W-2) income if you actively participate and your MAGI is under $100k (phasing out to $0 by $150k); unused losses carry forward. On sale, claimed depreciation is recaptured at up to 25%, and gains may owe capital-gains tax (a 1031 exchange can defer both). Figures are a year-1 estimate at your 24.0% rate — not tax advice; consult a CPA.
Schools (NCES district)
- District
- Marietta City
- NCES district ID
- 3910019
- Math proficiency
- 35% ▼ -20.00%
- Reading proficiency
- 49% ▼ -12.00%
- Median HH income
- $39,366
- Composite
- 35.08/100
- National rank
- #5025
- State rank
- #534 of 656 in OH
Livability — Marietta
- Score
- 80/100
- State rank
- #127
- US rank
- #1845
Category grades
Schools grade is shown separately in the Schools card above.
Census & demographics
- Census place
- Marietta, OH
- County
- Washington County · 26,420 people
- City population
- 26,420
- Metro
- Marietta, OH
- Population (ZIP)
- 26,420
- Household income
- $60,229
- Rent vs Own
- Severe rent burden
- 727.0
Population outlook (Washington County) Hauer SSP2
- Today (2025)
- 59,640 people
- By 2030
- 58,315 · -2.2%
- By 2040
- 55,186 · -7.5%
- By 2050
- 52,246 · -12.4%
- By 2075
- 45,893 · -23.0%
- By 2100
- 38,128 · -36.1%
Race, ethnicity, and origin ACS 2023
- Neighborhood character
- Predominantly White (94%)
- Race & ethnicity
- White 94% Two or more races 2% Asian 1% Black 1% Hispanic / Latino 1%
- Common ancestry
- Italian 2% Slovak 2% Romanian 2%
- Foreign-born
- 2% · Canada
- Languages at home
- 97% English-only · Tagalog/Filipino 1% Other Indo-European 1%
Political lean MEDSL · Washington
- 2024 margin
- Solid R (+43.8) · D 27.7% · R 71.5%
- 2008→2024 swing
- +40.2pp toward D · 2008: -83.9pp · 2024: -43.8pp
- All cycles
- 2024: R+43.8 2020: R+40.8 2016: R+41.6 2012: R+19.4 2008: R+83.9
Not yet ingested
- Civics
- —
Market trends
- HPI YoY
- ▼ -95.06%
- Current HPI
- 198.6235
- Rent YoY
- —
- Metro
- Marietta, OH
- State GDP YoY
- ▲ 1.98%
- F500 in state
- 48
Industry mix (Fortune 500 HQ in OH)
| Industry | F500 HQs | Revenue |
|---|---|---|
| Insurance | 3 | $145B |
|
||
| Industrial Machinery | 3 | $49B |
|
||
| Financial Services | 3 | $24B |
|
||
| Consumer Goods | 2 | $93B |
|
||
| Aerospace / Defense | 2 | $47B |
|
||
| Utilities | 2 | $33B |
|
||
Price history
+415.2% since first listed3 events — show timeline
- 2026-06-02 Listed $85,000 MLSNOW
- 2017-02-01 Sold (MLS) $11,000 MLSNOW
- 2016-08-28 Listed $16,500 MLSNOW
Property tax history
+4.8%/yrLatest (2025): $631 · +1.7% YoY. Source: county tax records.
Cash-flow waterfall
monthlySold comps — $/sqft
last 12 mo · ≤1 miLoading sold comps…