 🏷️ Likely Rental
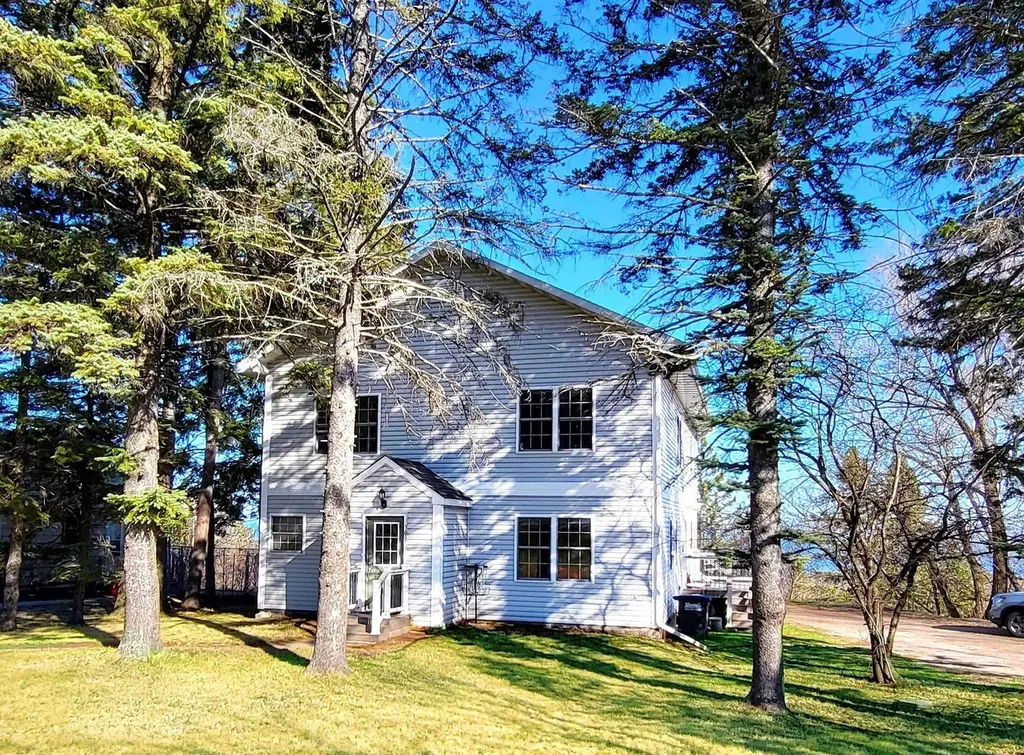
908 E Skyline Pkwy · Duluth, MN
Flood risk 1/10 · Minimal
- FEMA flood zone
- X
- Chance of flooding over 30 yrs
- 0.0%
- Est. flood insurance / yr
- $473 – $860
Fire risk 1/10 · Minimal
- Est. fire insurance / yr
- $888 – $1,650
Heat risk 1/10 · Minimal
- Hot days now (above 91°F)
- 7 days/yr
- Hot days in 30 yrs
- 12 days/yr
Wind risk 1/10 · Minimal
- Chance of severe wind over 30 yrs
- —
Air-quality risk 2/10 · Minimal
- Unhealthy air days now
- 0 days/yr
- Unhealthy air days in 30 yrs
- 1 days/yr
Risk factors via First Street. Map © Google.
Why this score? — see what drove the D+ grade
The composite is a weighted blend of 9 inputs, each scored 0–100. Each bar is that input's sub-score; the figure is the points it added to the 100-point composite (weight × sub-score).
- Cash flow +15.0/30.0
- ARV discount +7.5/15.0
- 1% rule +5.0/10.0
- DSCR +5.0/10.0
- Schools +4.2/10.0
- Livability +4.1/5.0
- Rent growth +3.6/5.0
- Condition / age +2.5/5.0
- Appreciation +0.0/10.0
$2,100
🖨 Deal sheet 📄 Offer letter ✓ Due diligence
Multi-family units
County records classify this as Multi-Family (2-4 Unit). Listing-text estimate: 1 unit. estimate disagrees with records
Listing remarks MLS
This is an upper unit with 2 bedrooms, den, 1 bath and an open kitchen/living room with off-street parking for 2 vehicles. There is no smoking, no pets. 1 year lease.
Key facts
- 0.36 acre lot
- Built 1910
- Listed 276 days
Neighborhood map
What this means for you Summary
Snapshot
- This is a 4-bed/3.0-bath multifamily listed at $2k.
Deal economics
- At list price, monthly cash flow is $2k ($22k/yr) — positive.
- The deal already cash-flows at list — no discount required.
- Meets the 1% rule at list price ($2k rent vs $2k).
- Recommended offer: $2k (12.0% below list) — sets the bar for market timing.
- Cap rate 1036.0% vs local median 4.9% in Duluth — top-decile yield for the area; either an underpriced asset or a hidden risk that comps aren't pricing in. Stress-test before assuming the spread holds.
Location & tenants
- Location reads 82/100 on livability (#36 in MN, #1,060 nationally) — a professional / high-income tenant draw. Strengths: commute A+, cost of living A+, housing A+; Watch: amenities F.
- Duluth Public School District (urban): math 44% / reading 55% proficiency, ranked #132 of 301 in MN (top 44%) — families likely to look elsewhere, expect single-tenant / working-renter base with shorter leases.
- Market conditions: Rents rising fast (+4.3%/yr); 42 active listings in the ZIP; 1 comparable units currently listed for rent nearby; lower-income renter base — watch delinquency; 639 units permitted in St. Louis County in 2024 (338 in 5+ unit buildings).
- At $2,299/mo this rent would consume 64% of the median local household income ($43k/yr) (locally 927% of renters already pay >50% of income on rent) — very limited rent-growth headroom before tenants either downsize or default.
Forward outlook
- Local home prices are declining (-3.0%/yr); year-one equity from $15 of loan paydown is wiped out by about $63 of value loss. Plan a longer hold.
- At projected returns (-3.0% appreciation + 4.3% rent growth), your $588 cash investment doubles in ~1 year — after that, you're playing with house money.
Negotiation context
- It's been on market 277 days — a 12% lower offer ($2k) is reasonable based on typical stale-listing flexibility.
- 8 sale attempts since 15y ago; this cycle's ask has dropped $3k (62%) from the opening price — seller is motivated, your offer sets the floor, not the list.
Risks & watch-outs
- Watch-outs: built in 1910 — expect roof / HVAC / electrical / plumbing capex.
Questions for the listing agent
- It's been on market 277 days. Have you received any prior offers? Is the seller open to a 12% concession, seller financing, or rate buy-down credit?
- Built in 1910 — when were the roof, HVAC, electrical panel, plumbing, and water heater last replaced?
- Why hasn't it sold? Are there any deal-killer items the seller is aware of (foundation, flood, title, zoning, code violations)?
- Is there a deadline driving the sale (1031 exchange, divorce, estate, relocation)? That informs how much negotiation room exists.
- Schools are B-rated — typically a magnet for longer-tenancy family renters. What's the average tenant stay here, and is there a school-zone premium baked into asking?
- The area grade is low — what's the realistic commute time and amenity access for the typical tenant pool here? Any planned neighborhood developments (good or bad) we should know about?
- What's the average days-on-market for RENTAL listings here right now (not sales)? A rising rental-DOM trend means longer vacancies and softer asking-rent achievability than the comps imply.
- What's the recent tenant-quality profile in this submarket — average credit score on applications, eviction rate, late-payment / NSF rate, and stable-employment percentage? A property-management company in the area should have these aggregated.
- How much new apartment / multifamily construction is in the pipeline within 1–3 miles? Heavy new supply (>2% of stock underway) typically softens rents 12–24 months out; light construction supports rent growth.
Investment metrics
- 1% rule
- 109.50% ✓
- Cap rate
- 1036.04%
- Cash-on-cash
- 3677.68%
- DSCR
- 164.64
- GRM
- 0.1
CMA / ARV
- ARV (median comp)
- $194,857
- List price
- $2,100
- Delta
- -98.92%
- Verdict
- UNDERPRICED
- Comps
- 19 within 1.0 mi
Show comp detail 4 sales within ~0.75 mi
| Address | Dist | Beds/Ba | Sqft | Sold | Price | $/sf | Match |
|---|---|---|---|---|---|---|---|
| 1023 E 5th St | 0.57mi | 5/3.0 (+1) | 3,091 (+0%) | 1mo | $350,000 | $113 | 67 |
| 602 E 7th St | 0.52mi | 4/4.0 | 3,000 (-3%) | 10mo | $305,000 | $102 | 59 |
| 1319 E 6th St | 0.62mi | 4/3.0 | 2,782 (-10%) | 1mo | $360,000 | $129 | 54 |
| 614 N 6th Ave Ave E | 0.54mi | 5/3.0 (+1) | 3,537 (+14%) | 21mo | $325,000 | $92 | 28 |
Match score weights: distance 35% · size 25% · config 20% · recency 20%. Top-matched comps best support the ARV.
Projected returns pro-forma
-3.0% appreciation · 4.34% rent growth · sell at horizon
- IRR
- —
- Equity multiple
- 201.02×
- Total profit
- $117,610
- Equity at exit
- $313
- IRR
- —
- Equity multiple
- 449.29×
- Total profit
- $263,592
- Equity at exit
- $182
Cash invested: $588 (down + closing). Projections, not guarantees.
Landlord ↔ Tenant lean methodology
- Overall (STATE)
- 46 Balanced
- State Minnesota
- 46 Balanced · D+2
- County
- — inherits STATE
- City
- — inherits STATE
ZIP-level market 55805
- Home prices YoY
- -27.1%
- Rents YoY
- 4.3%
- Active inventory
- 42
- Price-to-rent
- 0.1×
Monthly cashflow live
- Estimated rent
- $2,299 medium interval (Pro) →
- Mortgage (P&I)
- −$11
- Tax est. 1.5%
- −$3 /mo · $32/yr
- Insurance
- −$1
- HOA
- −$0
- Vacancy / Maint / Mgmt
- −$483
- Net cashflow
- $1,802
Break-even live
UW: 25.0% down · 7.5% · 30yr · 1.5% tax · 5.0% vac · 8.0% maint · 8.0% mgmt
Financing live
Cash to close
- Down payment
- $525
- Closing costs
- $63
- Reserves months
- —
- Total cash needed
- —
Loan-product check · same deal, 3 products live
Conventional
25% down · 7.5% · 30yr
- Down + closing
- —
- Monthly P&I
- —
- Monthly cashflow
- —
- DSCR
- —
- Eligible?
- —
Personal DTI + credit; lowest rate.
DSCR
20% down · 8.5% · 30yr
- Down + closing
- —
- Monthly P&I
- —
- Monthly cashflow
- —
- DSCR
- —
- Eligible?
- —
No personal income docs; deal must DSCR.
Hard money
10% down · 12.0% · 12mo
- Down + closing
- —
- Monthly P&I
- —
- Monthly cashflow
- —
- DSCR
- —
- Eligible?
- —
Short-term bridge; refi at stabilization.
Rent comps 1 comps
| Address | Beds | Baths | Sqft | Rent | $/sqft | DOM | Units | Dist |
|---|---|---|---|---|---|---|---|---|
| 202 S 18th Ave E Duluth, MN | 5.0 | 2.5 | 2372 | $2,495 | $1.05 | 13d | 1 | 1.29mi |
Listing history 37 events
-
2026-06-19days on market $2,100 Active 277 DOM
-
2026-06-18days on market $2,100 Active 276 DOM
-
2026-06-17days on market $2,100 Active 275 DOM
-
2026-06-16days on market $2,100 Active 274 DOM
-
2026-06-15days on market $2,100 Active 273 DOM
-
2026-06-14days on market $2,100 Active 271 DOM
-
2026-06-13days on market $2,100 Active 270 DOM
-
2026-06-10days on market $2,100 Active 268 DOM
-
2026-06-09days on market $2,100 Active 267 DOM
-
2026-06-08days on market $2,100 Active 266 DOM
-
2026-06-07days on market $2,100 Active 265 DOM
-
2026-06-05days on market $2,100 Active 262 DOM
-
2026-06-03days on market $2,100 Active 261 DOM
-
2026-06-02days on market $2,100 Active 260 DOM
-
2026-06-01days on market $2,100 Active 259 DOM
-
2026-05-31days on market $2,100 Active 258 DOM
-
2026-05-30days on market $2,100 Active 257 DOM
-
2026-01-05price $2,100
-
2025-10-23price $2,200 166-char remark
Show marketing remark (166 chars)
This is an upper unit with 2 bedrooms, den, 1 bath and an open kitchen/living room with off-street parking for 2 vehicles. There is no smoking, no pets. 1 year lease.
-
2025-10-01soldstatus $2,200 Closed 166-char remark
Show marketing remark (166 chars)
This is an upper unit with 2 bedrooms, den, 1 bath and an open kitchen/living room with off-street parking for 2 vehicles. There is no smoking, no pets. 1 year lease.
-
2025-09-15soldstatus $1,950,000 Closed
-
2025-09-01price $2,350 166-char remark
Show marketing remark (166 chars)
This is an upper unit with 2 bedrooms, den, 1 bath and an open kitchen/living room with off-street parking for 2 vehicles. There is no smoking, no pets. 1 year lease.
-
2025-07-28price $2,500 166-char remark
Show marketing remark (166 chars)
This is an upper unit with 2 bedrooms, den, 1 bath and an open kitchen/living room with off-street parking for 2 vehicles. There is no smoking, no pets. 1 year lease.
-
2025-07-28$5,500 Active 166-char remark
Show marketing remark (166 chars)
This is an upper unit with 2 bedrooms, den, 1 bath and an open kitchen/living room with off-street parking for 2 vehicles. There is no smoking, no pets. 1 year lease.
-
2025-07-28$1,950 Active
Show marketing remark (166 chars)
This is an upper unit with 2 bedrooms, den, 1 bath and an open kitchen/living room with off-street parking for 2 vehicles. There is no smoking, no pets. 1 year lease.
-
2025-07-28$2,350 Active
Show marketing remark (166 chars)
This is an upper unit with 2 bedrooms, den, 1 bath and an open kitchen/living room with off-street parking for 2 vehicles. There is no smoking, no pets. 1 year lease.
-
2023-09-15soldstatus $1,650 Closed
-
2020-09-12soldstatus $1,500
-
2020-05-02$1,500
-
2019-08-21soldstatus $325,000
-
2017-07-31soldstatus $1,400
-
2017-04-01soldstatus $1,600
-
2016-07-05$1,400
-
2016-07-05$1,600
-
2011-12-14$269,900
-
2011-05-02$299,900
-
2008-07-02soldstatus $95,000
ⓘ Source: listings_history table (triggers on properties + properties_extension) + one-shot
backfill from property_details.listing_events for pre-trigger history.
Climate risk First Street
- Flood 1/10 Low FEMA zone X · 0% chance over 30 yrs
- Wildfire 1/10 Low
- Heat 1/10 Low 7 d/yr ≥91°F today · 12 d/yr by 30 yrs out
- Wind 1/10 Low
- Air quality 2/10 Low 0 unhealthy d/yr today · 1 by 30 yrs out
Nearby sold comps map
Loading sold comps map…
Walkable amenities ~0.75 mi
Loading nearby amenities…
Taxation est. · year 1
- Rental income
- $27,594
- − Mortgage interest
- −$118
- − Property taxes
- −$32
- − Insurance
- −$10
- − Repairs & maintenance
- −$2,207
- − Management
- −$2,207
- − Depreciation
- −$61
- Taxable income
- $22,958
- Est. tax owed @ 24.0%
- −$5,510
- After-tax cash flow
- $16,115/yr
For passive investors: Depreciation is non-cash, so a rental often shows a tax loss while cash-flowing — sheltering income. Rental losses are passive: they offset passive income freely, and up to $25,000/yr can offset ordinary (W-2) income if you actively participate and your MAGI is under $100k (phasing out to $0 by $150k); unused losses carry forward. On sale, claimed depreciation is recaptured at up to 25%, and gains may owe capital-gains tax (a 1031 exchange can defer both). Figures are a year-1 estimate at your 24.0% rate — not tax advice; consult a CPA.
Schools (NCES district)
- District
- Duluth Public School District
- NCES district ID
- 2711040
- Math proficiency
- 44% ▼ -10.00%
- Reading proficiency
- 55% ▼ -6.00%
- Median HH income
- $45,692
- Composite
- 41.92/100
- National rank
- #3360
- State rank
- #132 of 301 in MN
Livability — Duluth
- Score
- 82/100
- State rank
- #36
- US rank
- #1060
Category grades
Schools grade is shown separately in the Schools card above.
Census & demographics
- Census place
- Duluth, MN
- County
- Saint Louis County · 115,152 people
- City population
- 71,097
- Metro
- Duluth, MN-WI
- Population (ZIP)
- 10,602
- Household income
- $43,100
- Rent vs Own
- Severe rent burden
- 927.0
Population outlook (St. Louis County) Hauer SSP2
- Today (2025)
- 202,411 people
- By 2030
- 203,234 · +0.4%
- By 2040
- 202,520 · +0.1%
- By 2050
- 200,853 · -0.8%
- By 2075
- 200,943 · -0.7%
- By 2100
- 192,058 · -5.1%
Race, ethnicity, and origin ACS 2023
- Neighborhood character
- Predominantly White (84%)
- Race & ethnicity
- White 84% Two or more races 8% Hispanic / Latino 4% Black 3% Asian 2% Native American 2%
- Common ancestry
- Portuguese 13% Romanian 4% Scottish 2%
- Foreign-born
- 2% · Canada
- Languages at home
- 96% English-only · Spanish 1% Other Indo-European 1% Other Asian/Pacific 1%
Political lean MEDSL · St. Louis
- 2024 margin
- D (+13.7) · D 55.9% · R 42.2% · Other 1.8%
- 2008→2024 swing
- -18.8pp toward R · 2008: 32.5pp · 2024: 13.7pp
- All cycles
- 2024: D+13.7 2020: D+15.6 2016: D+11.8 2012: D+29.6 2008: D+32.5
Not yet ingested
- Civics
- —
Market trends
- HPI YoY
- ▼ -92.92%
- Current HPI
- 250.3056
- Rent YoY
- ▲ 4.34%
- Metro
- Duluth, MN-WI
- State GDP YoY
- ▲ 2.41%
- F500 in state
- 34
Industry mix (Fortune 500 HQ in MN)
| Industry | F500 HQs | Revenue |
|---|---|---|
| Healthcare | 2 | $407B |
|
||
| Retail | 2 | $150B |
|
||
| Consumer Goods | 2 | $32B |
|
||
| Industrial Machinery | 2 | $6B |
|
||
| Agriculture | 1 | $40B |
|
||
| Healthcare / Medical Devices | 1 | $32B |
|
||
Price history
-97.8% since first listed20 events — show timeline
- 2026-01-05 Price Changed $2,100 LSAR
- 2025-10-23 Price Changed $2,200 LSAR
- 2025-10-01 Sold (MLS) $2,200 LSAR
- 2025-09-15 Sold (MLS) $1,950,000 LSAR
- 2025-09-01 Price Changed $2,350 LSAR
- 2025-07-28 Price Changed $2,500 LSAR
- 2025-07-28 Listed $5,500 LSAR
- 2025-07-28 Listed $1,950 LSAR
- 2025-07-28 Listed $2,350 LSAR
- 2023-09-15 Sold (MLS) $1,650 LSAR
- 2020-09-12 Sold (MLS) $1,500 LSAR
- 2020-05-02 Listed $1,500 LSAR
- 2019-08-21 Sold (Public Records) $325,000 Public Records
- 2017-07-31 Sold (MLS) $1,400 LSAR
- 2017-04-01 Sold (MLS) $1,600 LSAR
- 2016-07-05 Listed $1,600 LSAR
- 2016-07-05 Listed $1,400 LSAR
- 2011-12-14 Listed $269,900 NORTHSTARMLS as Distributed by MLS Grid
- 2011-05-02 Listed $299,900 NORTHSTARMLS as Distributed by MLS Grid
- 2008-07-02 Sold (Public Records) $95,000 Public Records
Property tax history
+4.6%/yrLatest (2025): $6,484 · +8.8% YoY. Source: county tax records.
Cash-flow waterfall
monthlySold comps — $/sqft
last 12 mo · ≤1 miLoading sold comps…