13980 Golden Star Rd #3 · Alta Sierra, CA
Flood risk 1/10 · Minimal
- FEMA flood zone
- X (unshaded)
- Chance of flooding over 30 yrs
- 0.0%
- Est. flood insurance / yr
- $507 – $1,088
Fire risk 9/10 · Severe
- Est. fire insurance / yr
- $659 – $1,223
Heat risk 5/10 · Moderate
- Hot days now (above 96°F)
- 7 days/yr
- Hot days in 30 yrs
- 17 days/yr
Wind risk 1/10 · Minimal
- Chance of severe wind over 30 yrs
- —
Air-quality risk 10/10 · Severe
- Unhealthy air days now
- 33 days/yr
- Unhealthy air days in 30 yrs
- 40 days/yr
Risk factors via First Street. Map © Google.
Why this score? — see what drove the C+ grade
The composite is a weighted blend of 9 inputs, each scored 0–100. Each bar is that input's sub-score; the figure is the points it added to the 100-point composite (weight × sub-score).
- Cash flow +30.0/30.0
- 1% rule +10.0/10.0
- DSCR +10.0/10.0
- Schools +3.8/10.0
- Condition / age +3.8/5.0
- Livability +3.0/5.0
- Rent growth +2.5/5.0
- ARV discount +0.0/15.0
- Appreciation +0.0/10.0
$90,000
🖨 Deal sheet 📄 Offer letter ✓ Due diligence
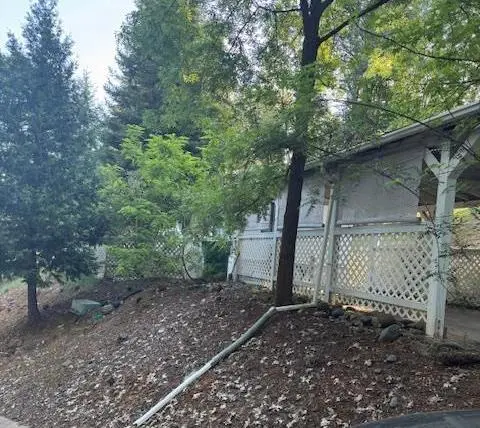
Listing remarks
Welcome home to one of the the best MHP Parks in Grass Valley. Home is a recently renovated Single Wide, with unusual privacy. Home has new roof, new laminate flooring. new paint and drywall. All age park. New owners must have park approval, before offer accepted. All age park.
Key facts
- New paint
- Recently renovated
- New roof
Tags
Property features AI
Finance
- Other: Located in Tall Pines MHP; Directions: From Grass Valley Hwy 49, right on Alison Ranch Rd. Right at stop sign, continue to follow, home on right.
- HOA & community: Mandatory association; Monthly association fee; Association amenities include pool and clubhouse; Association fee covers sewer and pool
Exterior
- Parking: Covered parking; Guest parking available; Upslope driveway/sidewalks
- Utilities: Cable available; Natural gas connected; Public water; Public sewer
- Home design: Manufactured home (detached); Updated / remodeled; Built in 1991
- Construction: Composition roof
- Exterior features: Partial fencing; Close to clubhouse; Artificial grass; Shed(s) on property
Interior
- Kitchen: Free-standing gas range; Dishwasher; Kitchen/family combo; Other countertops
- Bedrooms: 2 bedrooms; Master bedroom with closet
- Flooring: Laminate flooring
- Bathrooms: 1 full bathroom; Tub with shower over
- Heating & cooling: Central heating; Central cooling
- Interior features: Open beam ceiling; Covered deck; Dual-pane full windows; One level / single-story
- Laundry & utility: Washer/dryer hookups only; 220V outlet in laundry
Neighborhood map
What this means for you Summary
Snapshot
- This is a 2-bed/1.0-bath manufactured listed at $90k. Condition is rated good.
Deal economics
- At list price, monthly cash flow is $966 ($12k/yr) — positive.
- The deal already cash-flows at list — no discount required.
- Meets the 1% rule at list price ($2k rent vs $90k).
- Cap rate 19.2% vs local median 3.4% in Alta Sierra — top-decile yield for the area; either an underpriced asset or a hidden risk that comps aren't pricing in. Stress-test before assuming the spread holds.
Location & tenants
- Location reads 59/100 on livability (#662 in CA) — a working-class tenant base; expect higher turnover. Strengths: employment A+, housing A+; Watch: crime C-, schools D+, amenities F.
- Nevada Joint Union High (town): math 25% / reading 61% proficiency, ranked #201 of 517 in CA (top 39%) — families likely to look elsewhere, expect single-tenant / working-renter base with shorter leases.
- Market conditions: 252 active listings in the ZIP; solid renter incomes; 215 units permitted in Nevada County in 2024 (0 in 5+ unit buildings).
Forward outlook
- Local home prices are declining (-3.0%/yr); year-one equity from $622 of loan paydown is wiped out by about $3k of value loss. Plan a longer hold.
- Nevada County population projected at -14% by 2050 — secular population decline; favor cash flow + early exit over multi-decade hold.
- At projected returns (-3.0% appreciation + 3.0% rent growth), your $25k cash investment doubles in ~3 years — after that, you're playing with house money.
Negotiation context
- Only 4 days on market — expect competitive offers; lowballing is unlikely to land.
Risks & watch-outs
- Climate carrying-cost: severe wildfire risk; extreme-heat days projected 7→17/yr by 2055 (HVAC capex compounding) — expect insurance premiums to compound above CPI over the hold.
Questions for the listing agent
- Is there a deadline driving the sale (1031 exchange, divorce, estate, relocation)? That informs how much negotiation room exists.
- Schools are D-rated, which usually means shorter tenancies and higher turnover. Who's the typical renter profile here, and what's been the actual vacancy rate?
- What's the average days-on-market for RENTAL listings here right now (not sales)? A rising rental-DOM trend means longer vacancies and softer asking-rent achievability than the comps imply.
- What's the recent tenant-quality profile in this submarket — average credit score on applications, eviction rate, late-payment / NSF rate, and stable-employment percentage? A property-management company in the area should have these aggregated.
- How much new for-sale + rental construction is in the pipeline within 1–3 miles? Heavy new supply typically softens prices + rents 12–24 months out; constrained supply supports both.
Investment metrics
- 1% rule
- 2.23% ✓
- Cap rate
- 19.18%
- Cash-on-cash
- 46.01%
- DSCR
- 3.05
- GRM
- 3.7
CMA / ARV
- ARV (on-the-fly)
- $65,520
- Comps found
- 4
Show comp detail 4 sales within ~0.75 mi
| Address | Dist | Beds/Ba | Sqft | Sold | Price | $/sf | Match |
|---|---|---|---|---|---|---|---|
| 14338 State Highway 49 #71 | 0.10mi | 2/1.0 | 860 (+2%) | 14mo | $67,500 | $78 | 80 |
| 14338 State Highway 49 #19 | 0.19mi | 2/1.0 | 800 (-5%) | 5mo | $52,000 | $65 | 79 |
| 14338 State Hwy 49 #51 | 0.19mi | 2/1.0 | 800 (-5%) | 22mo | $57,000 | $71 | 65 |
| 10114 Forest Springs Dr | 0.64mi | 2/1.0 | 720 (-14%) | 19mo | $75,000 | $104 | 30 |
Match score weights: distance 35% · size 25% · config 20% · recency 20%. Top-matched comps best support the ARV.
Projected returns pro-forma
-3.0% appreciation · 3.0% rent growth · sell at horizon
- IRR
- 43.2%
- Equity multiple
- 2.86×
- Total profit
- $46,984
- Equity at exit
- $13,419
- IRR
- 49.3%
- Equity multiple
- 5.77×
- Total profit
- $120,275
- Equity at exit
- $7,782
Cash invested: $25,200 (down + closing). Projections, not guarantees.
Landlord ↔ Tenant lean methodology
- Overall (STATE)
- 18 Strongly Tenant-Friendly
- State California
- 18 Strongly Tenant-Friendly · D+13
- County
- — inherits STATE
- City
- — inherits STATE
ZIP-level market 95949
- Home prices YoY
- -34.7%
- Active inventory
- 252
- Price-to-rent
- 3.7×
Monthly cashflow live
- Estimated rent
- $2,010 medium interval (Pro) →
- Mortgage (P&I)
- −$472
- Tax est. 1.5%
- −$112 /mo · $1,350/yr
- Insurance
- −$38
- HOA
- −$0
- Vacancy / Maint / Mgmt
- −$422
- Net cashflow
- $966
Break-even live
UW: 25.0% down · 7.5% · 30yr · 1.5% tax · 5.0% vac · 8.0% maint · 8.0% mgmt
Financing live
Cash to close
- Down payment
- $22,500
- Closing costs
- $2,700
- Reserves months
- —
- Total cash needed
- —
Loan-product check · same deal, 3 products live
Conventional
25% down · 7.5% · 30yr
- Down + closing
- —
- Monthly P&I
- —
- Monthly cashflow
- —
- DSCR
- —
- Eligible?
- —
Personal DTI + credit; lowest rate.
DSCR
20% down · 8.5% · 30yr
- Down + closing
- —
- Monthly P&I
- —
- Monthly cashflow
- —
- DSCR
- —
- Eligible?
- —
No personal income docs; deal must DSCR.
Hard money
10% down · 12.0% · 12mo
- Down + closing
- —
- Monthly P&I
- —
- Monthly cashflow
- —
- DSCR
- —
- Eligible?
- —
Short-term bridge; refi at stabilization.
Listing history 13 events
-
2026-06-19days on market $90,000 Active 4 DOM
-
2026-06-18days on market $90,000 Active 3 DOM
-
2026-06-17days on market $90,000 Active 2 DOM
-
2026-06-15days on market $90,000 Active 1 DOM
-
2026-06-10days on market $90,000 Active 25 DOM
-
2026-06-09days on market $90,000 Active 24 DOM
-
2026-06-08days on market $90,000 Active 23 DOM
-
2026-06-07days on market $90,000 Active 22 DOM
-
2026-06-05days on market $90,000 Active 19 DOM
-
2026-06-03days on market $90,000 Active 18 DOM
-
2026-06-02days on market $90,000 Active 17 DOM
-
2026-06-01days on market $90,000 Active 16 DOM
-
2026-05-31days on market $90,000 Active 15 DOM
ⓘ Source: listings_history table (triggers on properties + properties_extension) + one-shot
backfill from property_details.listing_events for pre-trigger history.
Climate risk First Street
- Flood 1/10 Low FEMA zone X (unshaded) · 0% chance over 30 yrs
- Wildfire 9/10 Extreme
- Heat 5/10 Major 7 d/yr ≥96°F today · 17 d/yr by 30 yrs out
- Wind 1/10 Low
- Air quality 10/10 Extreme 33 unhealthy d/yr today · 40 by 30 yrs out
Nearby sold comps map
Loading sold comps map…
Walkable amenities ~0.75 mi
Loading nearby amenities…
Taxation est. · year 1
- Rental income
- $24,124
- − Mortgage interest
- −$5,041
- − Property taxes
- −$1,350
- − Insurance
- −$450
- − Repairs & maintenance
- −$1,930
- − Management
- −$1,930
- − Depreciation
- −$2,618
- Taxable income
- $10,805
- Est. tax owed @ 24.0%
- −$2,593
- After-tax cash flow
- $9,001/yr
For passive investors: Depreciation is non-cash, so a rental often shows a tax loss while cash-flowing — sheltering income. Rental losses are passive: they offset passive income freely, and up to $25,000/yr can offset ordinary (W-2) income if you actively participate and your MAGI is under $100k (phasing out to $0 by $150k); unused losses carry forward. On sale, claimed depreciation is recaptured at up to 25%, and gains may owe capital-gains tax (a 1031 exchange can defer both). Figures are a year-1 estimate at your 24.0% rate — not tax advice; consult a CPA.
Condition & rehab AI · 22 photos
This recently renovated single-wide manufactured home is in good condition with new roof, siding, appliances, and flooring. It offers a good investment opportunity with potential for further value enhancement through painting and landscaping.
Value-add opportunities
- Both Painting the exterior — Enhances curb appeal and resale value
- Both Landscaping improvements — Enhances curb appeal and resale value
- Resale Upgrading the kitchen appliances — Modernizes the kitchen and appeals to potential buyers
- Resale Upgrading the bathroom fixtures — Modernizes the bathroom and appeals to potential buyers
Renovation cost estimate screening
Value-add ROI direction
- Both Painting the exterior — Enhances curb appeal and resale value ↑
- Both Landscaping improvements — Enhances curb appeal and resale value ↑
- Resale Upgrading the kitchen appliances — Modernizes the kitchen and appeals to potential buyers ↑
- Resale Upgrading the bathroom fixtures — Modernizes the bathroom and appeals to potential buyers ↑
ⓘ Cost ranges are severity-bucket heuristics (US national rule-of-thumb). Get contractor quotes + a written scope before underwriting a rehab budget.
Schools (NCES district)
- District
- Nevada Joint Union High
- NCES district ID
- 0626880
- Math proficiency
- 25% ▼ -14.00%
- Reading proficiency
- 61% ▼ -7.00%
- Median HH income
- $57,336
- Composite
- 37.53/100
- National rank
- #4393
- State rank
- #201 of 517 in CA
Livability — Alta Sierra
- Score
- 59/100
- State rank
- #662
- US rank
- #20497
Category grades
Schools grade is shown separately in the Schools card above.
Census & demographics
- County
- Nevada County · 85,339 people
- Metro
- Truckee-Grass Valley, CA
- Population (ZIP)
- 20,552
- Household income
- $98,181
- Rent vs Own
- Severe rent burden
- 181.0
Population outlook (Nevada County) Hauer SSP2
- Today (2025)
- 98,490 people
- By 2030
- 97,295 · -1.2%
- By 2040
- 92,041 · -6.5%
- By 2050
- 85,164 · -13.5%
- By 2075
- 68,436 · -30.5%
- By 2100
- 49,536 · -49.7%
Race, ethnicity, and origin ACS 2023
- Neighborhood character
- Predominantly White (84%)
- Race & ethnicity
- White 84% Hispanic / Latino 8% Two or more races 8% Native American 1%
- Hispanic origin (detail)
- Mexican 6%
- Common ancestry
- Lithuanian 4% Italian 4% Slovak 2%
- Foreign-born
- 4% · Canada
- Languages at home
- 94% English-only · Spanish 3% Other Indo-European 1%
Political lean MEDSL · Nevada
- 2024 margin
- D (+12.2) · D 54.4% · R 42.1% · Other 3.5%
- 2008→2024 swing
- +6.9pp toward D · 2008: 5.3pp · 2024: 12.2pp
- All cycles
- 2024: D+12.2 2020: D+14.8 2016: D+4.5 2012: R+4.7 2008: D+5.3
Not yet ingested
- Civics
- —
Market trends
- HPI YoY
- ▼ -122.41%
- Current HPI
- 230.2373
- Rent YoY
- —
- Metro
- Truckee-Grass Valley, CA
- State GDP YoY
- ▲ 3.21%
- F500 in state
- 116
Industry mix (Fortune 500 HQ in CA)
| Industry | F500 HQs | Revenue |
|---|---|---|
| Technology | 27 | $1,492B |
|
||
| Financial Services | 3 | $174B |
|
||
| Retail | 3 | $44B |
|
||
| Insurance | 3 | $26B |
|
||
| Media / Entertainment | 2 | $115B |
|
||
| Pharmaceuticals / Biotech | 2 | $62B |
|
||
Cash-flow waterfall
monthlySold comps — $/sqft
last 12 mo · ≤1 miLoading sold comps…