None · Candlewood Orchards, CT
Flood risk 8/10 · Major
- FEMA flood zone
- X (unshaded)
- Chance of flooding over 30 yrs
- 0.78%
- Est. flood insurance / yr
- $507 – $1,088
Fire risk 1/10 · Minimal
- Est. fire insurance / yr
- $829 – $1,539
Heat risk 4/10 · Minor
- Hot days now (above 99°F)
- 7 days/yr
- Hot days in 30 yrs
- 15 days/yr
Wind risk 4/10 · Minor
- Chance of severe wind over 30 yrs
- 24.0%
Air-quality risk 3/10 · Minor
- Unhealthy air days now
- 3 days/yr
- Unhealthy air days in 30 yrs
- 4 days/yr
Risk factors via First Street. Map © Google.
Why this score? — see what drove the B grade
The composite is a weighted blend of 9 inputs, each scored 0–100. Each bar is that input's sub-score; the figure is the points it added to the 100-point composite (weight × sub-score).
- Cash flow +27.2/30.0
- ARV discount +15.0/15.0
- DSCR +9.4/10.0
- 1% rule +8.0/10.0
- Schools +5.0/10.0
- Rent growth +2.5/5.0
- Livability +2.5/5.0
- Condition / age +2.5/5.0
- Appreciation +0.0/10.0
$249,000
🖨 Deal sheet (PDF) 📄 Offer letter ✓ Due diligence
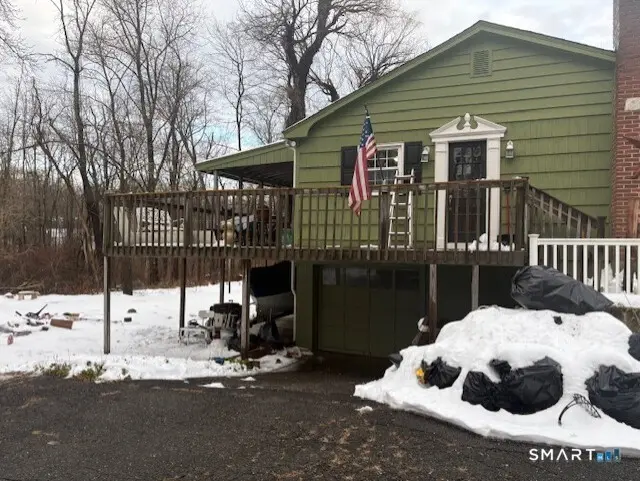
Listing remarks
Three bedroom, one bath ranch in need of repairs. Being sold "as-is".
Key facts
- 0.7 acre lot
- Garage
- Built 1950
Neighborhood map
What this means for you Summary
Snapshot
- This is a 3-bed/1.0-bath single-family listed at $249k.
Deal economics
- At list price, monthly cash flow is $644 ($8k/yr) — positive.
- The deal already cash-flows at list — no discount required.
- Meets the 1% rule at list price ($3k rent vs $249k).
Location & tenants
- Location reads: area grade B — affects rentability + tenant quality, not the cash-flow math above.
- Brookfield School District (suburban): math 46% / reading 59% proficiency, ranked #61 of 153 in CT (top 40%) — acceptable for families but not a draw, mixed tenant base, ~2y average lease; only 6% free/reduced lunch — higher-income household profile.
- Zoned schools: Huckleberry Hill Elementary School (math 40% / reading 47%, grade F, #280 of 553 statewide, top 51%, 527 students, 24% FRL); Whisconier Middle School (math 49% / reading 62%, grade B-, #63 of 175 statewide, top 36%, 782 students, 22% FRL); Brookfield High School (math 43% / reading 70%, grade C, #62 of 194 statewide, top 32%, 871 students, 21% FRL) — zoned schools average 22% FRL vs 6% district-wide (16 pts higher); higher-poverty schools than district average — tighter screening recommended.
- Market conditions: 104 active listings in the ZIP; 6 comparable units currently listed for rent nearby; rentals leasing fast (median 5d on market — plan ~1-2 weeks tenant-placement turnaround); 1,151 units permitted in Western Connecticut Planning Region in 2024 (714 in 5+ unit buildings).
Forward outlook
- Local home prices are declining (-3.0%/yr); year-one equity from $2k of loan paydown is wiped out by about $7k of value loss. Plan a longer hold.
- At projected returns (-3.0% appreciation + 3.0% rent growth), your $70k cash investment doubles in ~10 years — after that, you're playing with house money.
Negotiation context
- Only 1 days on market — expect competitive offers; lowballing is unlikely to land.
Risks & watch-outs
- Watch-outs: flood insurance adds $66/mo; built in 1950 — expect roof / HVAC / electrical / plumbing capex.
- Climate carrying-cost: severe flood risk — expect insurance premiums to compound above CPI over the hold.
Questions for the listing agent
- Built in 1950 — when were the roof, HVAC, electrical panel, plumbing, and water heater last replaced?
- What's the actual annual flood-insurance premium (NFIP or private), and is the property in a SFHA with mandatory coverage?
- Is there a deadline driving the sale (1031 exchange, divorce, estate, relocation)? That informs how much negotiation room exists.
- What's the average days-on-market for RENTAL listings here right now (not sales)? A rising rental-DOM trend means longer vacancies and softer asking-rent achievability than the comps imply.
- What's the recent tenant-quality profile in this submarket — average credit score on applications, eviction rate, late-payment / NSF rate, and stable-employment percentage? A property-management company in the area should have these aggregated.
- How much new for-sale + rental construction is in the pipeline within 1–3 miles? Heavy new supply typically softens prices + rents 12–24 months out; constrained supply supports both.
Investment metrics
- 1% rule
- 1.30% ✓
- Cap rate
- 9.72%
- Cash-on-cash
- 12.22%
- DSCR
- 1.54
- GRM
- 6.4
CMA / ARV
- ARV (on-the-fly)
- $450,870
- Comps found
- 3
Show comp detail 3 sales within ~0.75 mi
| Address | Dist | Beds/Ba | Sqft | Sold | Price | $/sf | Match |
|---|---|---|---|---|---|---|---|
| 2 Jackson Dr | 0.26mi | 3/2.0 | 1,225 (+8%) | 14mo | $495,000 | $404 | 59 |
| 1 Allen Rd | 0.39mi | 3/1.0 | 1,225 (+8%) | 17mo | $405,000 | $331 | 54 |
| 9 Clearview Dr | 0.30mi | 3/2.5 | 1,040 (-8%) | 20mo | $415,000 | $399 | 50 |
Match score weights: distance 35% · size 25% · config 20% · recency 20%. Top-matched comps best support the ARV.
Projected returns pro-forma
-3.0% appreciation · 3.0% rent growth · sell at horizon
- IRR
- 0.3%
- Equity multiple
- 1.01×
- Total profit
- $825
- Equity at exit
- $37,127
- IRR
- 10.0%
- Equity multiple
- 1.78×
- Total profit
- $54,218
- Equity at exit
- $21,529
Cash invested: $69,720 (down + closing). Projections, not guarantees.
Landlord ↔ Tenant lean methodology
- Overall (STATE)
- 27 Tenant-Leaning
- State Connecticut
- 27 Tenant-Leaning · D+7
- County
- — inherits STATE
- City
- — inherits STATE
ZIP-level market 06804
- Active inventory
- 104
- Price-to-rent
- 6.4×
Monthly cashflow live
- Estimated rent
- $3,249 high interval (Pro) →
- Mortgage (P&I)
- −$1,306
- Tax from tax record
- −$447 /mo · $5,364/yr
- Insurance
- −$104
- Flood insurance flood zone
- −$66 /mo · $798/yr
- HOA
- −$0
- Vacancy / Maint / Mgmt
- −$682
- Net cashflow
- $644
Break-even live
Sensitivity live
| Price | -10% $785 | -5% $714 | +0% $644 | +5% $573 | +10% $503 |
|---|---|---|---|---|---|
| Rent | -10% $387 | -5% $515 | +0% $644 | +5% $772 | +10% $900 |
| Rate | -1.0pp $769 | -0.5pp $707 | base $644 | +0.5pp $579 | +1.0pp $514 |
UW: 25.0% down · 7.5% · 30yr · 1.5% tax · 5.0% vac · 8.0% maint · 8.0% mgmt
Financing live
Cash to close
- Down payment
- $62,250
- Closing costs
- $7,470
- Reserves months
- —
- Total cash needed
- —
Loan-product check · same deal, 3 products live
Conventional
25% down · 7.5% · 30yr
- Down + closing
- —
- Monthly P&I
- —
- Monthly cashflow
- —
- DSCR
- —
- Eligible?
- —
Personal DTI + credit; lowest rate.
DSCR
20% down · 8.5% · 30yr
- Down + closing
- —
- Monthly P&I
- —
- Monthly cashflow
- —
- DSCR
- —
- Eligible?
- —
No personal income docs; deal must DSCR.
Hard money
10% down · 12.0% · 12mo
- Down + closing
- —
- Monthly P&I
- —
- Monthly cashflow
- —
- DSCR
- —
- Eligible?
- —
Short-term bridge; refi at stabilization.
Rent comps 6 comps
| Address | Beds | Baths | Sqft | Rent | $/sqft | DOM | Units | Dist |
|---|---|---|---|---|---|---|---|---|
| 70 Kellogg St Brookfield, CT | 3.0 | 2.5 | 1368 | $3,500 | $2.56 | 4d | 1 | 0.39mi |
| 5 Lilac Ln Brookfield, CT | 3.0 | 2.0 | 1488 | $4,100 | $2.76 | 4d | 1 | 0.57mi |
| 101 Laurel Hill Rd Brookfield, CT | 1.0–2.0 | 1.0–2.0 | 911 | $3,194 | $3.51 | 4d | 33 | 1.19mi |
| 277 Whisconier Rd Unit B Brookfield, CT | 2.0 | 1.0 | 700 | $2,300 | $3.29 | 45d | 1 | 1.37mi |
| 887 Federal Rd Unit 5 Brookfield, CT | 2.0 | 2.0 | 1040 | $2,370 | $2.28 | 45d | 1 | 1.41mi |
| 887 Federal Rd Brookfield, CT | 2.0 | 2.0 | 1040 | $2,300 | $2.21 | 4d | 1 | 1.41mi |
Listing history 2 events
-
2026-04-02status Under Contract
-
2026-03-31$249,000 Active
ⓘ Source: listings_history table (triggers on properties + properties_extension) + one-shot
backfill from property_details.listing_events for pre-trigger history.
Tax reassessment forecast CT · Partial reset (capped growth)
- Current annual tax
- $5,364 · $447/mo
- Projected year-2 tax
- $5,364 · $447/mo
- Expected delta
- $0/yr ($0/mo · 0.0%)
ⓘ Screening estimate from a state-policy table — verify with the county assessor before closing.
Climate risk First Street
- Flood 8/10 Severe FEMA zone X (unshaded) · 78% chance over 30 yrs
- Wildfire 1/10 Low
- Heat 4/10 Moderate 7 d/yr ≥99°F today · 15 d/yr by 30 yrs out
- Wind 4/10 Moderate 24% chance of damaging wind over 30 yrs
- Air quality 3/10 Moderate 3 unhealthy d/yr today · 4 by 30 yrs out
Nearby sold comps map
Loading sold comps map…
Walkable amenities ~0.75 mi
Loading nearby amenities…
Taxation est. · year 1
- Rental income
- $38,988
- − Mortgage interest
- −$13,948
- − Property taxes
- −$5,364
- − Insurance
- −$2,042
- − Repairs & maintenance
- −$3,119
- − Management
- −$3,119
- − Depreciation
- −$7,244
- Taxable income
- $4,152
- Est. tax owed @ 24.0%
- −$997
- After-tax cash flow
- $6,728/yr
For passive investors: Depreciation is non-cash, so a rental often shows a tax loss while cash-flowing — sheltering income. Rental losses are passive: they offset passive income freely, and up to $25,000/yr can offset ordinary (W-2) income if you actively participate and your MAGI is under $100k (phasing out to $0 by $150k); unused losses carry forward. On sale, claimed depreciation is recaptured at up to 25%, and gains may owe capital-gains tax (a 1031 exchange can defer both). Figures are a year-1 estimate at your 24.0% rate — not tax advice; consult a CPA.
Schools (NCES district)
- District
- Brookfield School District
- NCES district ID
- 0900540
- Math proficiency
- 46% ▼ -16.00%
- Reading proficiency
- 59% ▼ -10.00%
- Median HH income
- $105,279
- Composite
- 50.09/100
- National rank
- #1907
- State rank
- #61 of 153 in CT
Livability — Candlewood Orchards
No livability data for this city. (Only ~50 U.S. cities are tracked.)
Census & demographics
- Census place
- Candlewood Orchards, CT
- Population (ZIP)
- 17,871
Population outlook (Western Connecticut County) Hauer SSP2
- By 2040
- 685,031
Race, ethnicity, and origin ACS 2023
- Neighborhood character
- Predominantly White (79%)
- Race & ethnicity
- White 79% Hispanic / Latino 10% Two or more races 7% Black 4% Asian 3%
- Hispanic origin (detail)
- Puerto Rican 3% Cuban 1% Dominican 2%
- Common ancestry
- Romanian 7% Estonian 2% Slovak 2%
- Foreign-born
- 14% · Canada, China, Jamaica
- Languages at home
- 82% English-only · Spanish 6% Other Indo-European 5% Russian/Polish/Slavic 3%
Political lean MEDSL · Western Connecticut
- 2024 margin
- D (+19.1) · D 58.8% · R 39.7% · Other 1.6%
- All cycles
- 2024: D+19.1
Not yet ingested
- Civics
- —
Market trends
- HPI YoY
- ▼ -241.11%
- Current HPI
- 327.215
- Rent YoY
- —
- Metro
- —
- State GDP YoY
- ▲ 1.06%
- F500 in state
- 38
Industry mix (Fortune 500 HQ in CT)
| Industry | F500 HQs | Revenue |
|---|---|---|
| Industrial Machinery | 4 | $38B |
|
||
| Insurance | 3 | $71B |
|
||
| Financial Services | 2 | $25B |
|
||
| Transportation / Logistics | 2 | $18B |
|
||
| Healthcare | 1 | $247B |
|
||
| Telecommunications | 1 | $55B |
|
||
Price history
2 events — show timeline
- 2026-04-02 Pending — Smart MLS
- 2026-03-31 Listed $249,000 Smart MLS
Property tax history
+4.0%/yrLatest (2023): $5,364 · +3.8% YoY. Source: county tax records.
Cash-flow waterfall
monthlySold comps — $/sqft
last 12 mo · ≤1 miLoading sold comps…