 Multi-family
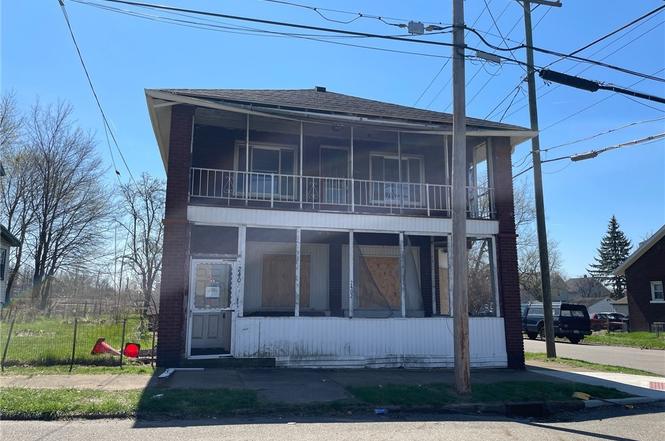
2402 14th St NE · Canton, OH
Flood risk 1/10 · Minimal
- FEMA flood zone
- X (unshaded)
- Chance of flooding over 30 yrs
- 0.0%
- Est. flood insurance / yr
- $473 – $860
Fire risk 1/10 · Minimal
- Est. fire insurance / yr
- $713 – $1,323
Heat risk 3/10 · Minor
- Hot days now (above 96°F)
- 7 days/yr
- Hot days in 30 yrs
- 17 days/yr
Wind risk 1/10 · Minimal
- Chance of severe wind over 30 yrs
- —
Air-quality risk 2/10 · Minimal
- Unhealthy air days now
- 1 days/yr
- Unhealthy air days in 30 yrs
- 2 days/yr
Risk factors via First Street. Map © Google.
Why this score? — see what drove the D grade
The composite is a weighted blend of 9 inputs, each scored 0–100. Each bar is that input's sub-score; the figure is the points it added to the 100-point composite (weight × sub-score).
- Cash flow +15.0/30.0
- ARV discount +7.5/15.0
- 1% rule +5.0/10.0
- DSCR +5.0/10.0
- Livability +3.6/5.0
- Condition / age +2.5/5.0
- Rent growth +2.4/5.0
- Schools +1.7/10.0
- Appreciation +0.0/10.0
$44,900
🖨 Deal sheet (PDF) 📄 Offer letter ✓ Due diligence
Multi-family units
County records classify this as Multi-Family (2-4 Unit). Listing-text estimate: 1 unit. estimate disagrees with records
Listing remarks
Spacious home . Separate living areas with separate entrances. Screened porch upstairs and downstairs. Close to schools and shopping.
Key facts
- Close to schools
- Screened porch
- Separate entrances
Tags
Property features AI
Exterior
- Parking: Parking lot
- Utilities: Public water; Public sewer
- Home design: 2-story home; Fixer condition
- Construction: Built according to public records; Asphalt and fiberglass roof
- Exterior features: Brick exterior
Interior
- Bedrooms: 2 main-level bedrooms
- Bathrooms: 2 full bathrooms; 1 main-level bathroom
- Heating & cooling: Forced air heating; Gas heating
- Interior features: Full basement
Neighborhood map
What this means for you Summary
Snapshot
- This is a 4-bed/2.5-bath multifamily listed at $45k.
Deal economics
- At list price, monthly cash flow is $1k ($16k/yr) — positive.
- The deal already cash-flows at list — no discount required.
- Meets the 1% rule at list price ($2k rent vs $45k).
- Recommended offer: $41k (9.0% below list) — sets the bar for market timing.
- Cap rate 41.8% vs local median 5.1% in Canton — top-decile yield for the area; either an underpriced asset or a hidden risk that comps aren't pricing in. Stress-test before assuming the spread holds.
Location & tenants
- Location reads 71/100 on livability (#441 in OH) — a middle-class / working-renter tenant base. Strengths: commute A+, cost of living A+, housing A; Watch: crime F, employment F.
- Canton City (urban): math 17% / reading 26% proficiency, ranked #627 of 656 in OH (top 96%) — low school quality limits family demand, transient renter base, plan for 1-2y turnover; 76% free/reduced lunch — lower-income household profile, screen leases tightly.
- Zoned schools: Belle Stone Elementary School (324 students, 0% FRL); Crenshaw Middle School (math 10% / reading 19%, grade F, #630 of 654 statewide, top 97%, 774 students, 0% FRL); Mckinley High School (math 8% / reading 29%, grade F, #683 of 781 statewide, top 88%, 2,154 students, 0% FRL) — zoned schools average 0% FRL vs 76% district-wide (76 pts lower); this property's tenant base skews higher-income than the district average.
- Market conditions: Rents soft (-0.2%/yr); 71 active listings in the ZIP; lower-income renter base — watch delinquency; 528 units permitted in Stark County in 2024 (84 in 5+ unit buildings).
- At $2,073/mo this rent would consume 57% of the median local household income ($43k/yr) (locally 524% of renters already pay >50% of income on rent) — very limited rent-growth headroom before tenants either downsize or default.
Forward outlook
- Local home prices are declining (-3.0%/yr); year-one equity from $310 of loan paydown is wiped out by about $1k of value loss. Plan a longer hold.
- Stark County population projected to shrink 8% by 2050 — rents likely to lag national; underwrite the cash flow, not the appreciation.
- At projected returns (-3.0% appreciation + 0.0% rent growth), your $13k cash investment doubles in ~1 year — after that, you're playing with house money.
Negotiation context
- It's been on market 107 days — a 9% lower offer ($41k) is reasonable based on typical stale-listing flexibility.
- 3 sale attempts since 2y ago; this cycle's ask has dropped $5k (10%) from the opening price — seller is motivated, your offer sets the floor, not the list.
Risks & watch-outs
- Watch-outs: built in 1916 — expect roof / HVAC / electrical / plumbing capex.
Questions for the listing agent
- It's been on market 107 days. Have you received any prior offers? Is the seller open to a 9% concession, seller financing, or rate buy-down credit?
- Built in 1916 — when were the roof, HVAC, electrical panel, plumbing, and water heater last replaced?
- Why hasn't it sold? Are there any deal-killer items the seller is aware of (foundation, flood, title, zoning, code violations)?
- Is there a deadline driving the sale (1031 exchange, divorce, estate, relocation)? That informs how much negotiation room exists.
- Crime grade is F in this area — have there been break-ins, vandalism, or insurance claims at this property in the last 3 years? What carrier currently insures it and at what premium?
- The area grade is low — what's the realistic commute time and amenity access for the typical tenant pool here? Any planned neighborhood developments (good or bad) we should know about?
- What's the average days-on-market for RENTAL listings here right now (not sales)? A rising rental-DOM trend means longer vacancies and softer asking-rent achievability than the comps imply.
- What's the recent tenant-quality profile in this submarket — average credit score on applications, eviction rate, late-payment / NSF rate, and stable-employment percentage? A property-management company in the area should have these aggregated.
- How much new apartment / multifamily construction is in the pipeline within 1–3 miles? Heavy new supply (>2% of stock underway) typically softens rents 12–24 months out; light construction supports rent growth.
Investment metrics
- 1% rule
- 4.62% ✓
- Cap rate
- 41.77%
- Cash-on-cash
- 126.70%
- DSCR
- 6.64
- GRM
- 1.8
CMA / ARV
- ARV (on-the-fly)
- $108,160
- Comps found
- 1
Show comp detail 1 sale within ~0.75 mi
| Address | Dist | Beds/Ba | Sqft | Sold | Price | $/sf | Match |
|---|---|---|---|---|---|---|---|
| 2635 Mahoning Rd NE | 0.37mi | 4/3.0 | 2,773 (+3%) | 20mo | $112,000 | $40 | 60 |
Match score weights: distance 35% · size 25% · config 20% · recency 20%. Top-matched comps best support the ARV.
Projected returns pro-forma
-3.0% appreciation · 0.0% rent growth · sell at horizon
- IRR
- —
- Equity multiple
- 6.67×
- Total profit
- $71,222
- Equity at exit
- $6,695
- IRR
- —
- Equity multiple
- 12.73×
- Total profit
- $147,528
- Equity at exit
- $3,882
Cash invested: $12,572 (down + closing). Projections, not guarantees.
Landlord ↔ Tenant lean methodology
- Overall (STATE)
- 73 Landlord-Friendly
- State Ohio
- 73 Landlord-Friendly · R+6
- County
- — inherits STATE
- City
- — inherits STATE
ZIP-level market 44705
- Rents YoY
- -0.2%
- Active inventory
- 71
- Price-to-rent
- 3.6×
Monthly cashflow live
- Estimated rent
- $2,073 high interval (Pro) →
- Mortgage (P&I)
- −$235
- Tax est. 1.5%
- −$56 /mo · $674/yr
- Insurance
- −$19
- HOA
- −$0
- Vacancy / Maint / Mgmt
- −$435
- Net cashflow
- $1,327
Break-even live
Sensitivity live
| Price | -10% $1,358 | -5% $1,343 | +0% $1,327 | +5% $1,312 | +10% $1,296 |
|---|---|---|---|---|---|
| Rent | -10% $1,164 | -5% $1,245 | +0% $1,327 | +5% $1,409 | +10% $1,491 |
| Rate | -1.0pp $1,350 | -0.5pp $1,339 | base $1,327 | +0.5pp $1,316 | +1.0pp $1,304 |
2-unit breakdown (identical units grouped — click to expand)
| Units | Beds | Baths | Est. rent |
|---|---|---|---|
| 2× units | 2 | 1 | $2,072 |
| #1 | 2 | 1 | $1,036 |
| #2 | 2 | 1 | $1,036 |
| Total (2 units) | $2,073 | ||
UW: 25.0% down · 7.5% · 30yr · 1.5% tax · 5.0% vac · 8.0% maint · 8.0% mgmt
Financing live
Cash to close
- Down payment
- $11,225
- Closing costs
- $1,347
- Reserves months
- —
- Total cash needed
- —
Loan-product check · same deal, 3 products live
Conventional
25% down · 7.5% · 30yr
- Down + closing
- —
- Monthly P&I
- —
- Monthly cashflow
- —
- DSCR
- —
- Eligible?
- —
Personal DTI + credit; lowest rate.
DSCR
20% down · 8.5% · 30yr
- Down + closing
- —
- Monthly P&I
- —
- Monthly cashflow
- —
- DSCR
- —
- Eligible?
- —
No personal income docs; deal must DSCR.
Hard money
10% down · 12.0% · 12mo
- Down + closing
- —
- Monthly P&I
- —
- Monthly cashflow
- —
- DSCR
- —
- Eligible?
- —
Short-term bridge; refi at stabilization.
Listing history 10 events
-
2026-05-01status Pending
-
2026-03-22price $44,900
-
2026-01-14historical
-
2026-01-12$49,900 Active
-
2026-01-12$49,900 Active
-
2024-10-17historical
-
2024-10-14price $70,000
-
2024-08-20price $80,000
-
2024-07-01price $60,000
-
2024-05-31$74,500 Active
ⓘ Source: listings_history table (triggers on properties + properties_extension) + one-shot
backfill from property_details.listing_events for pre-trigger history.
Climate risk First Street
- Flood 1/10 Low FEMA zone X (unshaded) · 0% chance over 30 yrs
- Wildfire 1/10 Low
- Heat 3/10 Moderate 7 d/yr ≥96°F today · 17 d/yr by 30 yrs out
- Wind 1/10 Low
- Air quality 2/10 Low 1 unhealthy d/yr today · 2 by 30 yrs out
Nearby sold comps map
Loading sold comps map…
Walkable amenities ~0.75 mi
Loading nearby amenities…
Taxation est. · year 1
- Rental income
- $24,876
- − Mortgage interest
- −$2,515
- − Property taxes
- −$674
- − Insurance
- −$224
- − Repairs & maintenance
- −$1,990
- − Management
- −$1,990
- − Depreciation
- −$1,306
- Taxable income
- $16,177
- Est. tax owed @ 24.0%
- −$3,882
- After-tax cash flow
- $12,046/yr
For passive investors: Depreciation is non-cash, so a rental often shows a tax loss while cash-flowing — sheltering income. Rental losses are passive: they offset passive income freely, and up to $25,000/yr can offset ordinary (W-2) income if you actively participate and your MAGI is under $100k (phasing out to $0 by $150k); unused losses carry forward. On sale, claimed depreciation is recaptured at up to 25%, and gains may owe capital-gains tax (a 1031 exchange can defer both). Figures are a year-1 estimate at your 24.0% rate — not tax advice; consult a CPA.
Schools (NCES district)
- District
- Canton City
- NCES district ID
- 3904371
- Math proficiency
- 17% ▼ -17.00%
- Reading proficiency
- 26% ▼ -12.00%
- Median HH income
- $28,825
- Composite
- 17.1/100
- National rank
- #9116
- State rank
- #627 of 656 in OH
Livability — Canton
- Score
- 71/100
- State rank
- #441
- US rank
- #7259
Category grades
Schools grade is shown separately in the Schools card above.
Census & demographics
- Census place
- Canton, OH
- County
- Stark County · 272,865 people
- City population
- 103,614
- Metro
- Canton-Massillon, OH
- Population (ZIP)
- 16,872
- Household income
- $43,439
- Rent vs Own
- Severe rent burden
- 524.0
Population outlook (Stark County) Hauer SSP2
- Today (2025)
- 373,708 people
- By 2030
- 371,245 · -0.7%
- By 2040
- 361,331 · -3.3%
- By 2050
- 345,290 · -7.6%
- By 2075
- 302,669 · -19.0%
- By 2100
- 238,870 · -36.1%
Race, ethnicity, and origin ACS 2023
- Neighborhood character
- Diverse neighborhood (Simpson 0.60)
- Race & ethnicity
- White 58% Black 22% Two or more races 13% Hispanic / Latino 9%
- Hispanic origin (detail)
- Mexican 2% Puerto Rican 2%
- Common ancestry
- Italian 5% Romanian 4% Lithuanian 2%
- Foreign-born
- 3% · Canada
- Languages at home
- 97% English-only · Spanish 2% German/W. Germanic 1%
Political lean MEDSL · Stark
- 2024 margin
- Strong R (+21.9) · D 38.6% · R 60.5%
- 2008→2024 swing
- -27.4pp toward R · 2008: 5.5pp · 2024: -21.9pp
- All cycles
- 2024: R+21.9 2020: R+18.5 2016: R+17.4 2012: R+0.4 2008: D+5.5
Not yet ingested
- Civics
- —
Market trends
- HPI YoY
- ▼ -200.62%
- Current HPI
- 150.1531
- Rent YoY
- ▼ -0.23%
- Metro
- Canton-Massillon, OH
- State GDP YoY
- ▲ 1.98%
- F500 in state
- 48
Industry mix (Fortune 500 HQ in OH)
| Industry | F500 HQs | Revenue |
|---|---|---|
| Insurance | 3 | $145B |
|
||
| Industrial Machinery | 3 | $49B |
|
||
| Financial Services | 3 | $24B |
|
||
| Consumer Goods | 2 | $93B |
|
||
| Aerospace / Defense | 2 | $47B |
|
||
| Utilities | 2 | $33B |
|
||
Price history
-39.7% since first listed10 events — show timeline
- 2026-05-01 Pending — MLSNOW
- 2026-03-22 Price Changed $44,900 MLSNOW
- 2026-01-14 Listing Removed — MLSNOW
- 2026-01-12 Listed $49,900 MLSNOW
- 2026-01-12 Listed $49,900 MLSNOW
- 2024-10-17 Listing Removed — MLSNOW
- 2024-10-14 Price Changed $70,000 MLSNOW
- 2024-08-20 Price Changed $80,000 MLSNOW
- 2024-07-01 Price Changed $60,000 MLSNOW
- 2024-05-31 Listed $74,500 MLSNOW
Property tax history
+62.5%/yrLatest (2024): $2,495 · +716.9% YoY. Source: county tax records.
Cash-flow waterfall
monthlySold comps — $/sqft
last 12 mo · ≤1 miLoading sold comps…