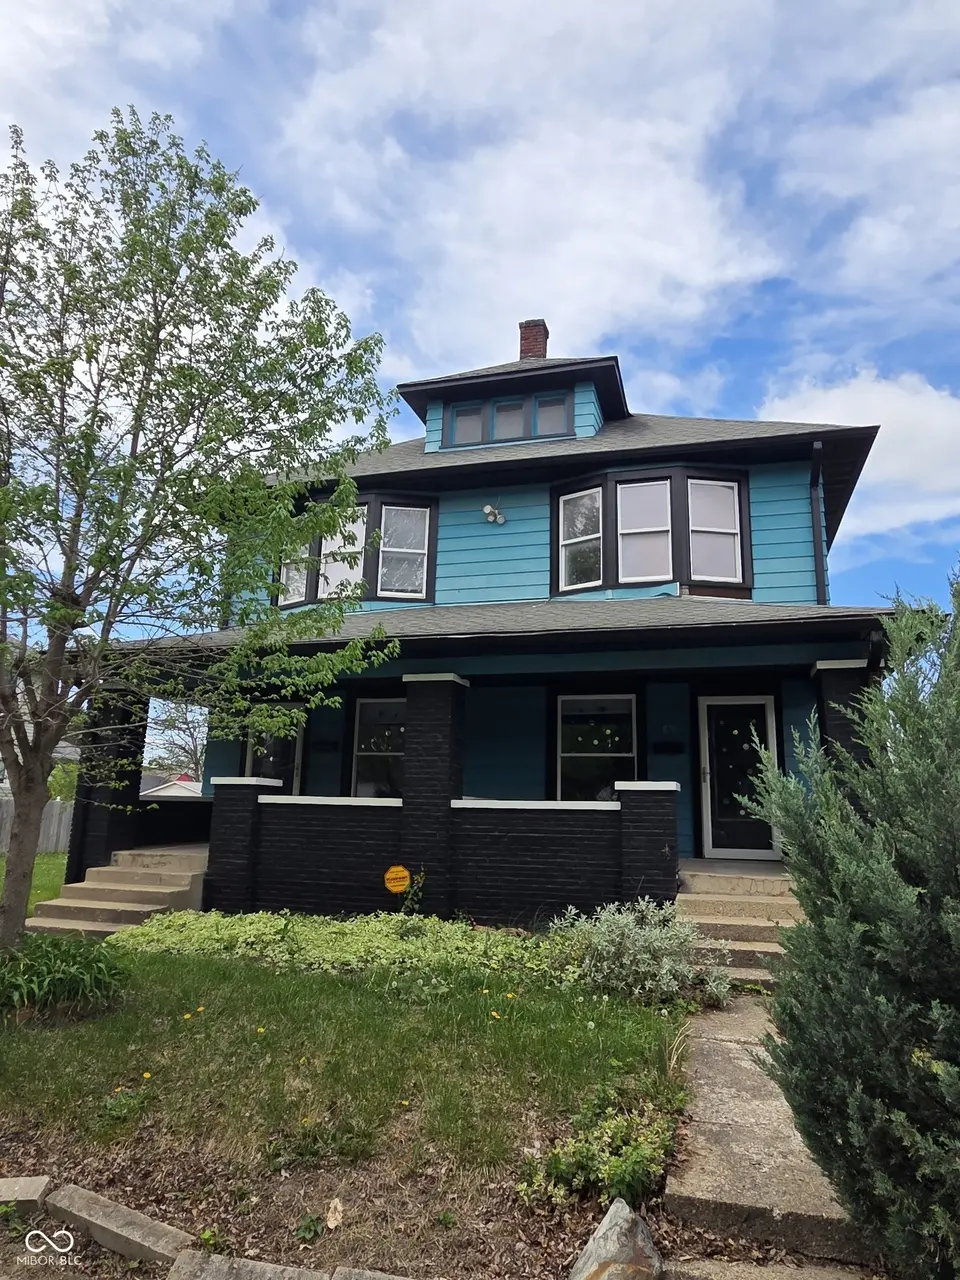
 Fourplex
848 N Oxford St · Indianapolis city (balance), IN
Flood risk 1/10 · Minimal
- FEMA flood zone
- X (unshaded)
- Chance of flooding over 30 yrs
- 0.0%
- Est. flood insurance / yr
- $473 – $860
Fire risk 1/10 · Minimal
- Est. fire insurance / yr
- $717 – $1,331
Heat risk 3/10 · Minor
- Hot days now (above 102°F)
- 7 days/yr
- Hot days in 30 yrs
- 19 days/yr
Wind risk 2/10 · Minimal
- Chance of severe wind over 30 yrs
- 1.0%
Air-quality risk 4/10 · Minor
- Unhealthy air days now
- 5 days/yr
- Unhealthy air days in 30 yrs
- 7 days/yr
Risk factors via First Street. Map © Google.
Why this score? — see what drove the C grade
The composite is a weighted blend of 9 inputs, each scored 0–100. Each bar is that input's sub-score; the figure is the points it added to the 100-point composite (weight × sub-score).
- Cash flow +28.0/30.0
- DSCR +10.0/10.0
- 1% rule +8.0/10.0
- Rent growth +4.3/5.0
- Livability +2.5/5.0
- Condition / age +2.5/5.0
- Schools +1.4/10.0
- ARV discount +0.0/15.0
- Appreciation +0.0/10.0
$289,900
🖨 Deal sheet 📄 Offer letter ✓ Due diligence
Multi-family units
County records classify this as Multi-Family (2-4 Unit). Listing-text estimate: 4 units. confirmed
Listing remarks MLS
Absolutely Charming and Ready For that Motivated individual to take on the project/investment that will keep on giving! Do not miss the chance to own your own income generator! This home is perfect for the individual that can see the potential in what this property has to offer. It does need quite a few cosmetic updates inside, one side does not have a working furnace, however, this exterior needs little work, roof is in good condition and the windows have been changed on most of the property. Again, this house is super cute and should be considered a fixer upper for cash buyers!
Key facts
- Fourplex
- Kitchen
- Cash flow
Tags
Property features AI
Finance
- Other: Zoned D5; Lot under 1/4 acre (approx. 0.13 acre); Road access via concrete city street
- Financial info: Multi-unit property with 4 total units; Gross income and expenses not reported
Exterior
- Parking: Detached 2-car garage
- Utilities: No solid waste service listed
- Home design: Residential income property; Quadruplex (attached); Two-story sections; Faces east; Property listed as fixer
- Construction: Brick and wood siding construction
- Exterior features: Partial privacy fencing; Asphalt roof; Curb, sidewalk and street light presence; Small trees (under 20 ft)
Interior
- Kitchen: Eat-in kitchen (one 3-bedroom unit sized approx. 13x16); Kitchen in 1-bedroom unit sized approx. 10x12
- Bedrooms: Some units are 3-bedroom; Some units are 1-bedroom
- Bathrooms: Some units have 1 bathroom
- Heating & cooling: Forced air heating; Central air conditioning
- Interior features: Has basement; Eat-in kitchen (some units); Fireplace (some units)
- Laundry & utility: Laundry connections (in at least one unit)
Neighborhood map
What this means for you Summary
Snapshot
- This is a 2×1bd/1ba + 2×3bd/1ba units multifamily listed at $290k.
Deal economics
- At list price, monthly cash flow is $906 ($11k/yr) — positive. Per door: $227/mo.
- The deal already cash-flows at list — no discount required.
- Meets the 1% rule at list price ($4k rent vs $290k).
- Recommended offer: $281k (3.0% below list) — sets the bar for market timing.
- Cap rate 10.0% vs local median 4.4% in Indianapolis city (balance) — top-decile yield for the area; either an underpriced asset or a hidden risk that comps aren't pricing in. Stress-test before assuming the spread holds.
Location & tenants
- Location reads: area grade C — affects rentability + tenant quality, not the cash-flow math above.
- Indianapolis Public Schools (urban): math 14% / reading 20% proficiency, ranked #286 of 301 in IN (top 95%) — low school quality limits family demand, transient renter base, plan for 1-2y turnover; 77% free/reduced lunch — lower-income household profile, screen leases tightly.
- Market conditions: Rents rising fast (+7.3%/yr); 480 active listings in the ZIP; 40 comparable units currently listed for rent nearby; rentals at typical pace (median 24d on market — plan ~3-4 weeks tenant-placement turnaround); 1,906 units permitted in Marion County in 2024 (621 in 5+ unit buildings).
- At $3,765/mo this rent would consume 92% of the median local household income ($49k/yr) (locally 1906% of renters already pay >50% of income on rent) — very limited rent-growth headroom before tenants either downsize or default.
Forward outlook
- Local home prices are declining (-3.0%/yr); year-one equity from $2k of loan paydown is wiped out by about $9k of value loss. Plan a longer hold.
- Marion County population projected at +18% by 2050 — long-run rental-demand tailwind backs the buy-and-hold thesis.
- At projected returns (-3.0% appreciation + 7.3% rent growth), your $81k cash investment doubles in ~7 years — after that, you're playing with house money.
Negotiation context
- It's been on market 35 days — a 3% lower offer ($281k) is reasonable based on typical stale-listing flexibility.
- 8 sale attempts since 3y ago with the ask held roughly flat each time — persistent listings suggest the price (not the market) is what's stuck; bring a comps-based counter.
- Current owner paid $180k; list at $290k implies a 61% gain — meaningful room to come down on a strong offer.
Risks & watch-outs
- Watch-outs: built in 1920 — expect roof / HVAC / electrical / plumbing capex.
Questions for the listing agent
- It's been on market 35 days. Have you received any prior offers? Is the seller open to a 3% concession, seller financing, or rate buy-down credit?
- Can we see the unit-by-unit rent roll, current vacancy, and any below-market leases? What's the average tenancy length?
- What capital expenditures (roof, boiler, parking lot, exteriors) have been made in the last 5 years, and what's planned in the next 2?
- Built in 1920 — when were the roof, HVAC, electrical panel, plumbing, and water heater last replaced?
- Is there a deadline driving the sale (1031 exchange, divorce, estate, relocation)? That informs how much negotiation room exists.
- What's the average days-on-market for RENTAL listings here right now (not sales)? A rising rental-DOM trend means longer vacancies and softer asking-rent achievability than the comps imply.
- What's the recent tenant-quality profile in this submarket — average credit score on applications, eviction rate, late-payment / NSF rate, and stable-employment percentage? A property-management company in the area should have these aggregated.
- How much new apartment / multifamily construction is in the pipeline within 1–3 miles? Heavy new supply (>2% of stock underway) typically softens rents 12–24 months out; light construction supports rent growth.
Investment metrics
- 1% rule
- 1.30% ✓
- Cap rate
- 10.04%
- Cash-on-cash
- 13.40%
- DSCR
- 1.60
- GRM
- 6.4
CMA / ARV
- ARV (median comp)
- $234,653
- List price
- $289,900
- Delta
- 23.54%
- Verdict
- OVERPRICED
- Comps
- 20 within 1.0 mi
Show comp detail 5 sales within ~0.75 mi
| Address | Dist | Beds/Ba | Sqft | Sold | Price | $/sf | Match |
|---|---|---|---|---|---|---|---|
| 1315 N Rural St | 0.42mi | 2/2.0 (-1) | 1,392 (+8%) | 5mo | $82,000 | $59 | 42 |
| 224 N Tacoma Ave | 0.63mi | 2/2.0 (-1) | 1,200 (-7%) | 2mo | $140,000 | $117 | 38 |
| 826 N Beville Ave | 0.38mi | 3/1.0 | 1,472 (+14%) | 1mo | $236,000 | $160 | 37 |
| 2522 E 16th St | 0.65mi | 2/2.0 (-1) | 1,300 (+1%) | 14mo | $184,000 | $142 | 36 |
| 944 N Hamilton Ave | 0.52mi | 2/2.0 (-1) | 1,400 (+9%) | 8mo | $170,000 | $121 | 35 |
Match score weights: distance 35% · size 25% · config 20% · recency 20%. Top-matched comps best support the ARV.
Projected returns pro-forma
-3.0% appreciation · 7.31% rent growth · sell at horizon
- IRR
- 8.3%
- Equity multiple
- 1.34×
- Total profit
- $27,877
- Equity at exit
- $43,225
- IRR
- 21.0%
- Equity multiple
- 3.16×
- Total profit
- $175,407
- Equity at exit
- $25,065
Cash invested: $81,172 (down + closing). Projections, not guarantees.
Landlord ↔ Tenant lean methodology
- Overall (STATE)
- 90 Strongly Landlord-Friendly
- State Indiana
- 90 Strongly Landlord-Friendly · R+11
- County
- — inherits STATE
- City
- — inherits STATE
ZIP-level market 46201
- Home prices YoY
- -33.9%
- Rents YoY
- 7.3%
- Active inventory
- 480
- Price-to-rent
- 34.6×
Monthly cashflow live
- Estimated rent
- $3,765 medium interval (Pro) →
- Mortgage (P&I)
- −$1,520
- Tax from tax record
- −$427 /mo · $5,124/yr
- Insurance
- −$121
- HOA
- −$0
- Vacancy / Maint / Mgmt
- −$791
- Net cashflow
- $906
Break-even live
4-unit breakdown (identical units grouped — click to expand)
| Units | Beds | Baths | Est. rent |
|---|---|---|---|
| 2× units | 1 | 1 | $1,396 |
| #1 | 1 | 1 | $698 |
| #2 | 1 | 1 | $698 |
| 2× units | 3 | 1 | $2,368 |
| #3 | 3 | 1 | $1,184 |
| #4 | 3 | 1 | $1,184 |
| Total (4 units) | $3,765 | ||
UW: 25.0% down · 7.5% · 30yr · 1.5% tax · 5.0% vac · 8.0% maint · 8.0% mgmt
Financing live
Cash to close
- Down payment
- $72,475
- Closing costs
- $8,697
- Reserves months
- —
- Total cash needed
- —
Loan-product check · same deal, 3 products live
Conventional
25% down · 7.5% · 30yr
- Down + closing
- —
- Monthly P&I
- —
- Monthly cashflow
- —
- DSCR
- —
- Eligible?
- —
Personal DTI + credit; lowest rate.
DSCR
20% down · 8.5% · 30yr
- Down + closing
- —
- Monthly P&I
- —
- Monthly cashflow
- —
- DSCR
- —
- Eligible?
- —
No personal income docs; deal must DSCR.
Hard money
10% down · 12.0% · 12mo
- Down + closing
- —
- Monthly P&I
- —
- Monthly cashflow
- —
- DSCR
- —
- Eligible?
- —
Short-term bridge; refi at stabilization.
Rent comps 40 comps
| Address | Beds | Baths | Sqft | Rent | $/sqft | DOM | Units | Dist |
|---|---|---|---|---|---|---|---|---|
| 849 N Rural St Unit 849 Indianapolis, IN | 3.0 | 2.5 | 1300 | $2,000 | $1.54 | 43d | 1 | 0.02mi |
| 851 N Rural St Indianapolis, IN | 3.0 | 2.5 | 1300 | $1,700 | $1.31 | 23d | 1 | 0.03mi |
| 852 N Rural St Indianapolis, IN | 2.0 | 1.5 | 1528 | $1,300 | $0.85 | 23d | 1 | 0.05mi |
| 645 N Oxford St Indianapolis, IN | 4.0 | 1.5 | 1344 | $1,500 | $1.12 | 23d | 1 | 0.10mi |
| 639 N Rural St Indianapolis, IN | 3.0 | 1.0 | 1000 | $1,675 | $1.68 | 17d | 1 | 0.12mi |
| 818 N Oakland Ave Unit 46201 Indianapolis, IN | 3.0 | 1.5 | 1332 | $1,550 | $1.16 | 43d | 1 | 0.15mi |
| 619 N Rural St Indianapolis, IN | 3.0 | 2.0 | 1300 | $1,600 | $1.23 | 23d | 1 | 0.16mi |
| 849 N Oakland Ave Indianapolis, IN | 4.0 | 3.0 | 1638 | $2,350 | $1.43 | 12d | 1 | 0.17mi |
| 960 Eastern Ave Indianapolis, IN | 3.0 | 1.5 | 1616 | $1,500 | $0.93 | 43d | 1 | 0.18mi |
| 960 Eastern Ave Indianapolis, IN | 3.0 | 1.5 | 1616 | $1,500 | $0.93 | 23d | 1 | 0.18mi |
| 3101 E 10th St #301 Indianapolis, IN | 2.0 | 1.0 | 921 | $1,195 | $1.30 | 43d | 1 | 0.22mi |
| 3030 E 10th St Indianapolis, IN | 2.0 | 1.0 | 950 | $900 | $0.95 | 21d | 1 | 0.23mi |
| 632 N Gray St Indianapolis, IN | 3.0 | 1.0 | 960 | $1,800 | $1.88 | 43d | 1 | 0.24mi |
| 627 N Tacoma Ave Indianapolis, IN | 3.0 | 1.0 | 1160 | $1,350 | $1.16 | 10d | 1 | 0.24mi |
| 625 N Tacoma Ave Indianapolis, IN | 3.0 | 1.0 | 1160 | $1,350 | $1.16 | 10d | 1 | 0.25mi |
| 1036 N Parker Ave Indianapolis, IN | 4.0 | 2.0 | 1342 | $1,745 | $1.30 | 4d | 1 | 0.26mi |
| 639 N Gray St Indianapolis, IN | 3.0 | 1.5 | 1120 | $1,220 | $1.09 | 43d | 1 | 0.26mi |
| 1038 N Parker Ave Indianapolis, IN | 4.0 | 2.0 | 1342 | $1,745 | $1.30 | 4d | 1 | 0.26mi |
| 637 N Gray St Indianapolis, IN | 3.0 | 1.5 | 1120 | $1,150 | $1.03 | 44d | 1 | 0.26mi |
| 1112 N Rural St Unit 1110 Indianapolis, IN | 2.0 | 1.5 | 1204 | $1,150 | $0.96 | 23d | 1 | 0.27mi |
| 515 N Oxford St Indianapolis, IN | 2.0 | 1.5 | 1728 | $1,050 | $0.61 | 3d | 1 | 0.28mi |
| 1113 N Oxford St Indianapolis, IN | 3.0 | 2.0 | 1100 | $1,495 | $1.36 | 7d | 1 | 0.28mi |
| 2814 E Michigan St Unit D Indianapolis, IN | 2.0 | 1.5 | 949 | $1,350 | $1.42 | 43d | 1 | 0.29mi |
| 933 N Dearborn St Indianapolis, IN | 3.0 | 1.5 | 1204 | $1,500 | $1.25 | 43d | 1 | 0.29mi |
| 2810 E Michigan St Unit C Indianapolis, IN | 2.0 | 1.5 | 949 | $1,350 | $1.42 | 43d | 1 | 0.29mi |
| 613-615 N Jefferson Indianapolis, IN | 3.0 | 1.0 | 1030 | $1,600 | $1.55 | 14d | 1 | 0.31mi |
| 840 N Lasalle St Indianapolis, IN | 3.0 | 1.0 | 1215 | $1,100 | $0.91 | 23d | 1 | 0.32mi |
| 2903 E Michigan St Indianapolis, IN | 3.0 | 2.0 | 1310 | $1,650 | $1.26 | 14d | 1 | 0.34mi |
| 909 N Lasalle St Indianapolis, IN | 3.0 | 2.0 | 1717 | $1,600 | $0.93 | 44d | 1 | 0.35mi |
| 929 N Beville Ave Indianapolis, IN | 3.0 | 1.0 | 1328 | $1,395 | $1.05 | 23d | 1 | 0.35mi |
| 826 N Beville Ave Indianapolis, IN | 3.0 | 1.0 | 1472 | $1,295 | $0.88 | 4d | 1 | 0.36mi |
| 826 N Beville Ave Indianapolis, IN | 3.0 | 1.0 | 1472 | $1,295 | $0.88 | 2d | 1 | 0.36mi |
| 510 N Dearborn St Indianapolis, IN | 3.0 | 1.0 | 1008 | $1,350 | $1.34 | 43d | 1 | 0.39mi |
| 1214 N Oakland Ave Indianapolis, IN | 3.0 | 2.0 | 1464 | $1,350 | $0.92 | 14d | 1 | 0.39mi |
| 1119 N Dearborn St Indianapolis, IN | 3.0 | 1.5 | 1200 | $1,249 | $1.04 | 43d | 1 | 0.39mi |
| 1216 N Oakland Ave Indianapolis, IN | 3.0 | 2.0 | 1464 | $1,550 | $1.06 | 14d | 1 | 0.40mi |
| 418 Eastern Ave Indianapolis, IN | 3.0 | 1.0 | 1008 | $1,325 | $1.31 | 23d | 1 | 0.40mi |
| 635 Jefferson Ave Indianapolis, IN | 3.0 | 1.5 | 1744 | $1,700 | $0.97 | 43d | 1 | 0.41mi |
| 953 N Tuxedo St Indianapolis, IN | 3.0 | 1.0 | 1200 | $950 | $0.79 | 23d | 1 | 0.44mi |
| 439 N Forest Ave Indianapolis, IN | 3.0 | 2.0 | 1030 | $1,200 | $1.17 | 23d | 1 | 0.44mi |
Listing history 25 events
-
2026-06-17status $289,900 Pending 35 DOM
-
2026-06-17days on market $289,900 Active 35 DOM
-
2026-06-16days on market $289,900 Active 34 DOM
-
2026-06-15days on market $289,900 Active 33 DOM
-
2026-06-13days on market $289,900 Active 31 DOM
-
2026-06-13days on market $289,900 Active 30 DOM
-
2026-06-09days on market $289,900 Active 27 DOM
-
2026-06-08days on market $289,900 Active 26 DOM
-
2026-06-07statusdays on market $289,900 Active 25 DOM
-
2026-04-27$289,900 Active 574-char remark
-
2024-08-23soldstatus $180,000 Closed 589-char remark
Show marketing remark (589 chars)
Absolutely Charming and Ready For that Motivated individual to take on the project/investment that will keep on giving! Do not miss the chance to own your own income generator! This home is perfect for the individual that can see the potential in what this property has to offer. It does need quite a few cosmetic updates inside, one side does not have a working furnace, however, this exterior needs little work, roof is in good condition and the windows have been changed on most of the property. Again, this house is super cute and should be considered a fixer upper for cash buyers!
-
2024-08-08status Pending 589-char remark
Show marketing remark (589 chars)
Absolutely Charming and Ready For that Motivated individual to take on the project/investment that will keep on giving! Do not miss the chance to own your own income generator! This home is perfect for the individual that can see the potential in what this property has to offer. It does need quite a few cosmetic updates inside, one side does not have a working furnace, however, this exterior needs little work, roof is in good condition and the windows have been changed on most of the property. Again, this house is super cute and should be considered a fixer upper for cash buyers!
-
2024-07-24status Active 589-char remark
Show marketing remark (589 chars)
Absolutely Charming and Ready For that Motivated individual to take on the project/investment that will keep on giving! Do not miss the chance to own your own income generator! This home is perfect for the individual that can see the potential in what this property has to offer. It does need quite a few cosmetic updates inside, one side does not have a working furnace, however, this exterior needs little work, roof is in good condition and the windows have been changed on most of the property. Again, this house is super cute and should be considered a fixer upper for cash buyers!
-
2024-07-08status Pending 589-char remark
Show marketing remark (589 chars)
Absolutely Charming and Ready For that Motivated individual to take on the project/investment that will keep on giving! Do not miss the chance to own your own income generator! This home is perfect for the individual that can see the potential in what this property has to offer. It does need quite a few cosmetic updates inside, one side does not have a working furnace, however, this exterior needs little work, roof is in good condition and the windows have been changed on most of the property. Again, this house is super cute and should be considered a fixer upper for cash buyers!
-
2024-06-18$185,000 Active 589-char remark
Show marketing remark (589 chars)
Absolutely Charming and Ready For that Motivated individual to take on the project/investment that will keep on giving! Do not miss the chance to own your own income generator! This home is perfect for the individual that can see the potential in what this property has to offer. It does need quite a few cosmetic updates inside, one side does not have a working furnace, however, this exterior needs little work, roof is in good condition and the windows have been changed on most of the property. Again, this house is super cute and should be considered a fixer upper for cash buyers!
-
2024-03-31historical
-
2024-01-11status Active
-
2023-12-25status Pending
-
2023-11-21status Active
-
2023-11-12status Pending
-
2023-10-18$195,000 Active
-
2023-09-25historical
-
2023-08-14price $230,000
-
2023-05-30price $244,500
-
2023-03-05$249,500 Active
ⓘ Source: listings_history table (triggers on properties + properties_extension) + one-shot
backfill from property_details.listing_events for pre-trigger history.
Tax reassessment forecast IN · Partial reset (capped growth)
- Current annual tax
- $5,124 · $427/mo
- Projected year-2 tax
- $5,124 · $427/mo
- Expected delta
- $0/yr ($0/mo · 0.0%)
ⓘ Screening estimate from a state-policy table — verify with the county assessor before closing.
Climate risk First Street
- Flood 1/10 Low FEMA zone X (unshaded) · 0% chance over 30 yrs
- Wildfire 1/10 Low
- Heat 3/10 Moderate 7 d/yr ≥102°F today · 19 d/yr by 30 yrs out
- Wind 2/10 Low 100% chance of damaging wind over 30 yrs
- Air quality 4/10 Moderate 5 unhealthy d/yr today · 7 by 30 yrs out
Nearby sold comps map
Loading sold comps map…
Walkable amenities ~0.75 mi
Loading nearby amenities…
Taxation est. · year 1
- Rental income
- $45,180
- − Mortgage interest
- −$16,239
- − Property taxes
- −$5,124
- − Insurance
- −$1,450
- − Repairs & maintenance
- −$3,614
- − Management
- −$3,614
- − Depreciation
- −$8,433
- Taxable income
- $6,705
- Est. tax owed @ 24.0%
- −$1,609
- After-tax cash flow
- $9,266/yr
For passive investors: Depreciation is non-cash, so a rental often shows a tax loss while cash-flowing — sheltering income. Rental losses are passive: they offset passive income freely, and up to $25,000/yr can offset ordinary (W-2) income if you actively participate and your MAGI is under $100k (phasing out to $0 by $150k); unused losses carry forward. On sale, claimed depreciation is recaptured at up to 25%, and gains may owe capital-gains tax (a 1031 exchange can defer both). Figures are a year-1 estimate at your 24.0% rate — not tax advice; consult a CPA.
Schools (NCES district)
- District
- Indianapolis Public Schools
- NCES district ID
- 1804770
- Math proficiency
- 14% ▼ -7.00%
- Reading proficiency
- 20% ▼ -3.00%
- Median HH income
- $32,034
- Composite
- 13.69/100
- National rank
- #9499
- State rank
- #286 of 301 in IN
Livability — Indianapolis city (balance)
No livability data for this city. (Only ~50 U.S. cities are tracked.)
Census & demographics
- Census place
- Indianapolis city (balance), IN
- County
- Marion County · 998,460 people
- City population
- 881,119
- Metro
- Indianapolis-Carmel-Anderson, IN
- Population (ZIP)
- 30,335
- Household income
- $49,195
- Rent vs Own
- Severe rent burden
- 1906.0
Population outlook (Marion County) Hauer SSP2
- Today (2025)
- 1,025,572 people
- By 2030
- 1,065,727 · +3.9%
- By 2040
- 1,141,577 · +11.3%
- By 2050
- 1,208,920 · +17.9%
- By 2075
- 1,367,288 · +33.3%
- By 2100
- 1,438,201 · +40.2%
Race, ethnicity, and origin ACS 2023
- Neighborhood character
- Diverse neighborhood (Simpson 0.63)
- Race & ethnicity
- White 53% Hispanic / Latino 23% Black 18% Two or more races 9%
- Hispanic origin (detail)
- Mexican 14% Puerto Rican 2%
- Common ancestry
- Slovak 2% Lithuanian 2% Italian 1%
- Foreign-born
- 9% · Canada
- Languages at home
- 81% English-only · Spanish 17%
Political lean MEDSL · Marion
- 2024 margin
- Strong D (+27.7) · D 63.0% · R 35.3% · Other 1.7%
- 2008→2024 swing
- -0.7pp no change · 2008: 28.4pp · 2024: 27.7pp
- All cycles
- 2024: D+27.7 2020: D+29.1 2016: D+22.8 2012: D+22.2 2008: D+28.4
Not yet ingested
- Civics
- —
Market trends
- HPI YoY
- ▼ -192.51%
- Current HPI
- 375.0969
- Rent YoY
- ▲ 7.31%
- Metro
- Indianapolis-Carmel-Anderson, IN
- State GDP YoY
- ▲ 2.90%
- F500 in state
- 18
Industry mix (Fortune 500 HQ in IN)
| Industry | F500 HQs | Revenue |
|---|---|---|
| Industrial Machinery | 2 | $37B |
|
||
| Healthcare | 1 | $177B |
|
||
| Pharmaceuticals | 1 | $45B |
|
||
| Metals / Steel | 1 | $18B |
|
||
| Agriculture | 1 | $17B |
|
||
| Packaging | 1 | $12B |
|
||
Price history
+16.2% since first listed19 events — show timeline
- 2026-06-17 Pending — MIBOR as Distributed by MLS Grid
- 2026-06-05 Relisted — MIBOR as Distributed by MLS Grid
- 2026-05-19 Pending — MIBOR as Distributed by MLS Grid
- 2026-04-27 Listed $289,900 MIBOR as Distributed by MLS Grid
- 2024-08-23 Sold (MLS) $180,000 MIBOR as Distributed by MLS Grid
- 2024-08-08 Pending — MIBOR as Distributed by MLS Grid
- 2024-07-24 Relisted — MIBOR as Distributed by MLS Grid
- 2024-07-08 Pending — MIBOR as Distributed by MLS Grid
- 2024-06-18 Listed $185,000 MIBOR as Distributed by MLS Grid
- 2024-03-31 Listing Removed — MIBOR as Distributed by MLS Grid
- 2024-01-11 Relisted — MIBOR as Distributed by MLS Grid
- 2023-12-25 Pending — MIBOR as Distributed by MLS Grid
- 2023-11-21 Relisted — MIBOR as Distributed by MLS Grid
- 2023-11-12 Pending — MIBOR as Distributed by MLS Grid
- 2023-10-18 Listed $195,000 MIBOR as Distributed by MLS Grid
- 2023-09-25 Listing Removed — MIBOR as Distributed by MLS Grid
- 2023-08-14 Price Changed $230,000 MIBOR as Distributed by MLS Grid
- 2023-05-30 Price Changed $244,500 MIBOR as Distributed by MLS Grid
- 2023-03-05 Listed $249,500 MIBOR as Distributed by MLS Grid
Property tax history
+20.0%/yrLatest (2025): $5,124 · +140.4% YoY. Source: county tax records.
Cash-flow waterfall
monthlySold comps — $/sqft
last 12 mo · ≤1 miLoading sold comps…