2806 Kaylin Dr · Shreveport, LA
Flood risk 1/10 · Minimal
- FEMA flood zone
- X (unshaded)
- Chance of flooding over 30 yrs
- 0.0%
- Est. flood insurance / yr
- $507 – $1,088
Fire risk 2/10 · Minimal
- Est. fire insurance / yr
- $1,269 – $2,357
Heat risk 7/10 · Major
- Hot days now (above 110°F)
- 7 days/yr
- Hot days in 30 yrs
- 22 days/yr
Wind risk 6/10 · Moderate
- Chance of severe wind over 30 yrs
- 68.0%
Air-quality risk 2/10 · Minimal
- Unhealthy air days now
- 1 days/yr
- Unhealthy air days in 30 yrs
- 1 days/yr
Risk factors via First Street. Map © Google.
Why this score? — see what drove the B grade
The composite is a weighted blend of 9 inputs, each scored 0–100. Each bar is that input's sub-score; the figure is the points it added to the 100-point composite (weight × sub-score).
- Cash flow +28.8/30.0
- ARV discount +15.0/15.0
- DSCR +10.0/10.0
- 1% rule +7.6/10.0
- Livability +3.0/5.0
- Rent growth +2.9/5.0
- Condition / age +2.5/5.0
- Schools +2.2/10.0
- Appreciation +0.0/10.0
$110,000
🖨 Deal sheet 📄 Offer letter ✓ Due diligence
Listing remarks MLS
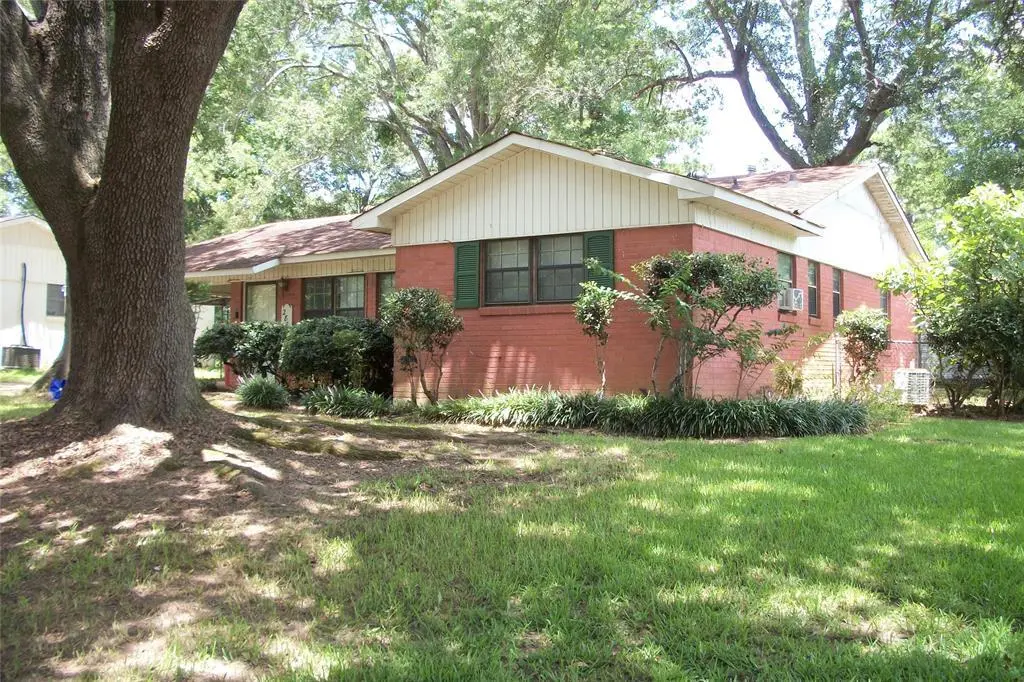
Investment Opportunity in Southern Hills – Cash-Flow from Day One! Ready to own a proven income-generating property in one of Shreveport’s most desirable neighborhoods? Don’t miss this exceptional chance to acquire a cash-flowing asset from day one. Situated on a peaceful 0.213-acre lot in sought-after Southern Hills, this charming 3-bedroom, 1.5-bath home is nestled beneath mature oak trees that provide natural shade and cooling—perfect for those warm Louisiana afternoons. The freshly painted interior offers a clean and welcoming canvas for renters or homeowners alike. Step into a fenced backyard with partial shade, a covered patio ideal for outdoor entertaining, and two sturdy metal storage buildings—great for added utility or attractive perks for future tenants. A wide driveway leads to a 2-car carport, delivering ample protected parking. Located on a quiet street with convenient access to Mansfield Road, the property is just minutes from Lowe’s, WK South Hospital, dining options, and major retail centers. Cosmetic updates could elevate curb appeal and boost rental income. Professional roof evaluation recommended—an opportunity to increase long-term value. Whether you’re an investor looking for reliable passive income or a homeowner seeking a smart purchase, this property blends immediate returns with strong growth potential.
Key facts
- Mature oak trees
- Covered patio
- Wide driveway
Tags
Neighborhood map
What this means for you Summary
Snapshot
- This is a 3-bed/2.0-bath single-family listed at $110k.
Deal economics
- At list price, monthly cash flow is $371 ($4k/yr) — positive.
- The deal already cash-flows at list — no discount required.
- Meets the 1% rule at list price ($1k rent vs $110k).
- Recommended offer: $97k (12.0% below list) — sets the bar for market timing.
- Cap rate 10.3% vs local median 5.7% in Shreveport — top-decile yield for the area; either an underpriced asset or a hidden risk that comps aren't pricing in. Stress-test before assuming the spread holds.
Location & tenants
- Location reads 59/100 on livability (#270 in LA) — a working-class tenant base; expect higher turnover. Strengths: cost of living A+, housing A; Watch: schools D+, crime F, amenities F.
- Caddo Parish (urban): math 21% / reading 32% proficiency, ranked #53 of 98 in LA (top 54%) — low school quality limits family demand, transient renter base, plan for 1-2y turnover; 64% free/reduced lunch — lower-income household profile, screen leases tightly.
- Market conditions: Rents rising (+1.7%/yr); 115 active listings in the ZIP; 16 comparable units currently listed for rent nearby; rentals at typical pace (median 22d on market — plan ~3-4 weeks tenant-placement turnaround); 221 units permitted in Caddo Parish in 2024 (0 in 5+ unit buildings).
- This rent runs 33% of the median local income ($50k/yr) — at the standard rent-burdened threshold; future hikes will face affordability resistance.
Forward outlook
- Local home prices are declining (-3.0%/yr); year-one equity from $761 of loan paydown is wiped out by about $3k of value loss. Plan a longer hold.
- Caddo County population projected at -15% by 2050 — secular population decline; favor cash flow + early exit over multi-decade hold.
- At projected returns (-3.0% appreciation + 1.7% rent growth), your $31k cash investment doubles in ~10 years — after that, you're playing with house money.
Negotiation context
- It's been on market 171 days — a 12% lower offer ($97k) is reasonable based on typical stale-listing flexibility.
- 2 sale attempts with the ask held roughly flat each time — persistent listings suggest the price (not the market) is what's stuck; bring a comps-based counter.
Risks & watch-outs
- Climate carrying-cost: major wind risk, 68% chance of damaging wind over 30y; extreme-heat days projected 7→22/yr by 2055 (HVAC capex compounding) — expect insurance premiums to compound above CPI over the hold.
Questions for the listing agent
- It's been on market 171 days. Have you received any prior offers? Is the seller open to a 12% concession, seller financing, or rate buy-down credit?
- Built in 1965 — when were the roof, HVAC, electrical panel, plumbing, and water heater last replaced?
- Why hasn't it sold? Are there any deal-killer items the seller is aware of (foundation, flood, title, zoning, code violations)?
- Is there a deadline driving the sale (1031 exchange, divorce, estate, relocation)? That informs how much negotiation room exists.
- Schools are D-rated, which usually means shorter tenancies and higher turnover. Who's the typical renter profile here, and what's been the actual vacancy rate?
- Crime grade is F in this area — have there been break-ins, vandalism, or insurance claims at this property in the last 3 years? What carrier currently insures it and at what premium?
- What's the average days-on-market for RENTAL listings here right now (not sales)? A rising rental-DOM trend means longer vacancies and softer asking-rent achievability than the comps imply.
- What's the recent tenant-quality profile in this submarket — average credit score on applications, eviction rate, late-payment / NSF rate, and stable-employment percentage? A property-management company in the area should have these aggregated.
- How much new for-sale + rental construction is in the pipeline within 1–3 miles? Heavy new supply typically softens prices + rents 12–24 months out; constrained supply supports both.
Investment metrics
- 1% rule
- 1.26% ✓
- Cap rate
- 10.34%
- Cash-on-cash
- 14.46%
- DSCR
- 1.64
- GRM
- 6.6
CMA / ARV
- ARV (median comp)
- $154,808
- List price
- $110,000
- Delta
- -28.94%
- Verdict
- UNDERPRICED
- Comps
- 20 within 1.0 mi
Show comp detail 12 sales within ~0.75 mi
| Address | Dist | Beds/Ba | Sqft | Sold | Price | $/sf | Match |
|---|---|---|---|---|---|---|---|
| 9025 Lone Oak Dr | 0.19mi | 3/1.0 | 1,185 (-4%) | 2mo | $95,000 | $80 | 79 |
| 9028 Lone Oak Dr | 0.21mi | 3/2.0 | 1,151 (-6%) | 2mo | $78,500 | $68 | 78 |
| 9035 Lone Oak Dr | 0.19mi | 3/1.0 | 1,106 (-10%) | 2mo | $146,000 | $132 | 69 |
| 9001 Bayonne Dr | 0.30mi | 3/1.5 | 1,115 (-9%) | 3mo | $155,000 | $139 | 65 |
| 9044 Marva Dr | 0.35mi | 2/1.5 (-1) | 1,185 (-4%) | 6mo | $65,000 | $55 | 65 |
| 8879 Bernay Dr | 0.50mi | 3/1.5 | 1,147 (-7%) | 3mo | $167,500 | $146 | 61 |
| 8948 Hilton Dr | 0.53mi | 3/1.0 | 1,144 (-7%) | 0mo | $125,900 | $110 | 59 |
| 2609 Lyles Ln | 0.61mi | 4/1.0 (+1) | 1,253 (+2%) | 1mo | $165,000 | $132 | 59 |
| 9039 Sara Ln | 0.14mi | 4/2.0 (+1) | 1,413 (+15%) | 7mo | $154,950 | $110 | 58 |
| 9014 Hilton Dr | 0.46mi | 3/1.0 | 1,113 (-10%) | 2mo | $154,000 | $138 | 57 |
| 8932 Torento Ln | 0.68mi | 3/1.5 | 1,110 (-10%) | 4mo | $64,000 | $58 | 47 |
| 2624 Lola Ln | 0.54mi | 3/1.0 | 1,054 (-14%) | 6mo | $65,000 | $62 | 42 |
Match score weights: distance 35% · size 25% · config 20% · recency 20%. Top-matched comps best support the ARV.
Projected returns pro-forma
-3.0% appreciation · 1.74% rent growth · sell at horizon
- IRR
- 3.5%
- Equity multiple
- 1.13×
- Total profit
- $4,084
- Equity at exit
- $16,401
- IRR
- 11.8%
- Equity multiple
- 1.88×
- Total profit
- $27,064
- Equity at exit
- $9,511
Cash invested: $30,800 (down + closing). Projections, not guarantees.
Landlord ↔ Tenant lean methodology
- Overall (STATE)
- 90 Strongly Landlord-Friendly
- State Louisiana
- 90 Strongly Landlord-Friendly · R+12
- County
- — inherits STATE
- City
- — inherits STATE
ZIP-level market 71118
- Rents YoY
- 1.7%
- Active inventory
- 115
- Price-to-rent
- 6.6×
Monthly cashflow live
- Estimated rent
- $1,381 high interval (Pro) →
- Mortgage (P&I)
- −$577
- Tax from tax record
- −$97 /mo · $1,167/yr
- Insurance
- −$46
- HOA
- −$0
- Vacancy / Maint / Mgmt
- −$290
- Net cashflow
- $371
Break-even live
UW: 25.0% down · 7.5% · 30yr · 1.5% tax · 5.0% vac · 8.0% maint · 8.0% mgmt
Financing live
Cash to close
- Down payment
- $27,500
- Closing costs
- $3,300
- Reserves months
- —
- Total cash needed
- —
Loan-product check · same deal, 3 products live
Conventional
25% down · 7.5% · 30yr
- Down + closing
- —
- Monthly P&I
- —
- Monthly cashflow
- —
- DSCR
- —
- Eligible?
- —
Personal DTI + credit; lowest rate.
DSCR
20% down · 8.5% · 30yr
- Down + closing
- —
- Monthly P&I
- —
- Monthly cashflow
- —
- DSCR
- —
- Eligible?
- —
No personal income docs; deal must DSCR.
Hard money
10% down · 12.0% · 12mo
- Down + closing
- —
- Monthly P&I
- —
- Monthly cashflow
- —
- DSCR
- —
- Eligible?
- —
Short-term bridge; refi at stabilization.
Rent comps 16 comps
| Address | Beds | Baths | Sqft | Rent | $/sqft | DOM | Units | Dist |
|---|---|---|---|---|---|---|---|---|
| 2843 Kaylin Dr Shreveport, LA | 3.0 | 1.0 | 1025 | $1,400 | $1.37 | 21d | 1 | 0.14mi |
| 2832 Holiday Ln Shreveport, LA | 3.0 | 1.0 | 1104 | $1,250 | $1.13 | 14d | 1 | 0.23mi |
| 2838 Smithfield Rd Shreveport, LA | 3.0 | 1.0 | 960 | $1,250 | $1.30 | 44d | 1 | 0.30mi |
| 9063 Marva Dr Shreveport, LA | 3.0 | 1.5 | 1052 | $1,375 | $1.31 | 44d | 1 | 0.34mi |
| 9137 Mansfield Rd Shreveport, LA | 1.0–2.0 | 1.0–2.0 | 1018 | $1,700 | $1.67 | 14d | 3 | 0.39mi |
| 3011 Mackey Ln Shreveport, LA | 3.0 | 1.5 | 1222 | $1,300 | $1.06 | 14d | 1 | 0.44mi |
| 3024 Karla Cir Unit 3024 Shreveport, LA | 3.0 | 1.0 | 971 | $1,175 | $1.21 | 44d | 1 | 0.54mi |
| 9005 Walker Rd Shreveport, LA | 2.0 | 2.0 | 975 | $1,332 | $1.37 | 14d | 5 | 0.58mi |
| 8860 Bernay Dr Shreveport, LA | 3.0 | 1.5 | 1200 | $1,300 | $1.08 | 44d | 1 | 0.59mi |
| 9100 Walker Rd Shreveport, LA | 1.0–2.0 | 1.0–2.0 | 841 | $1,164 | $1.38 | 14d | 9 | 0.73mi |
| 9295 Savanna Dr Shreveport, LA | 3.0 | 1.0 | 1297 | $1,250 | $0.96 | 21d | 1 | 0.76mi |
| 3126 W Bert Kouns Industrial Loop Shreveport, LA | 2.0 | 2.0 | 957 | $820 | $0.86 | 14d | 1 | 0.86mi |
| 2045 Bert Kouns Industrial Loop Shreveport, LA | 1.0–3.0 | 1.0–2.0 | 1006 | $1,320 | $1.31 | 44d | 11 | 0.91mi |
| 9730 Baird Rd Shreveport, LA | 1.0–2.0 | 1.0–2.0 | 872 | $1,212 | $1.39 | 14d | 19 | 1.06mi |
| 1029 Bert Kouns Industrial Loop Shreveport, LA | 3.0 | 1.5 | 1134 | $1,500 | $1.32 | 44d | 1 | 1.10mi |
| 9471 Blom Blvd Shreveport, LA | 3.0 | 1.5 | 1303 | $1,200 | $0.92 | 14d | 1 | 1.48mi |
Listing history 20 events
-
2026-06-18days on market $110,000 Active 171 DOM
-
2026-06-17days on market $110,000 Active 170 DOM
-
2026-06-16days on market $110,000 Active 169 DOM
-
2026-06-15days on market $110,000 Active 168 DOM
-
2026-06-14days on market $110,000 Active 166 DOM
-
2026-06-13days on market $110,000 Active 165 DOM
-
2026-06-10days on market $110,000 Active 163 DOM
-
2026-06-09days on market $110,000 Active 162 DOM
-
2026-06-08days on market $110,000 Active 161 DOM
-
2026-06-07days on market $110,000 Active 160 DOM
-
2026-06-05days on market $110,000 Active 157 DOM
-
2026-06-03days on market $110,000 Active 156 DOM
-
2026-06-02days on market $110,000 Active 155 DOM
-
2026-06-01days on market $110,000 Active 154 DOM
-
2026-05-31days on market $110,000 Active 153 DOM
-
2026-05-30days on market $110,000 Active 152 DOM
-
2025-12-29$110,000 Active 1405-char remark
Show marketing remark (1405 chars)
Investment Opportunity in Southern Hills – Cash-Flow from Day One! Ready to own a proven income-generating property in one of Shreveport’s most desirable neighborhoods? Don’t miss this exceptional chance to acquire a cash-flowing asset from day one. Situated on a peaceful 0.213-acre lot in sought-after Southern Hills, this charming 3-bedroom, 1.5-bath home is nestled beneath mature oak trees that provide natural shade and cooling—perfect for those warm Louisiana afternoons. The freshly painted interior offers a clean and welcoming canvas for renters or homeowners alike. Step into a fenced backyard with partial shade, a covered patio ideal for outdoor entertaining, and two sturdy metal storage buildings—great for added utility or attractive perks for future tenants. A wide driveway leads to a 2-car carport, delivering ample protected parking. Located on a quiet street with convenient access to Mansfield Road, the property is just minutes from Lowe’s, WK South Hospital, dining options, and major retail centers. Cosmetic updates could elevate curb appeal and boost rental income. Professional roof evaluation recommended—an opportunity to increase long-term value. Whether you’re an investor looking for reliable passive income or a homeowner seeking a smart purchase, this property blends immediate returns with strong growth potential.
-
2025-12-17historical
-
2025-09-13price $110,000
-
2025-06-17$125,000 Active
ⓘ Source: listings_history table (triggers on properties + properties_extension) + one-shot
backfill from property_details.listing_events for pre-trigger history.
Tax reassessment forecast LA · Resets to sale price
- Current annual tax
- $1,167 · $97/mo
- Projected year-2 tax
- $1,167 · $97/mo
- Expected delta
- $0/yr ($0/mo · 0.0%)
ⓘ Screening estimate from a state-policy table — verify with the county assessor before closing.
Climate risk First Street
- Flood 1/10 Low FEMA zone X (unshaded) · 0% chance over 30 yrs
- Wildfire 2/10 Low
- Heat 7/10 Severe 7 d/yr ≥110°F today · 22 d/yr by 30 yrs out
- Wind 6/10 Major 68% chance of damaging wind over 30 yrs
- Air quality 2/10 Low 1 unhealthy d/yr today · 1 by 30 yrs out
Nearby sold comps map
Loading sold comps map…
Walkable amenities ~0.75 mi
Loading nearby amenities…
Taxation est. · year 1
- Rental income
- $16,574
- − Mortgage interest
- −$6,162
- − Property taxes
- −$1,167
- − Insurance
- −$550
- − Repairs & maintenance
- −$1,326
- − Management
- −$1,326
- − Depreciation
- −$3,200
- Taxable income
- $2,844
- Est. tax owed @ 24.0%
- −$682
- After-tax cash flow
- $3,772/yr
For passive investors: Depreciation is non-cash, so a rental often shows a tax loss while cash-flowing — sheltering income. Rental losses are passive: they offset passive income freely, and up to $25,000/yr can offset ordinary (W-2) income if you actively participate and your MAGI is under $100k (phasing out to $0 by $150k); unused losses carry forward. On sale, claimed depreciation is recaptured at up to 25%, and gains may owe capital-gains tax (a 1031 exchange can defer both). Figures are a year-1 estimate at your 24.0% rate — not tax advice; consult a CPA.
Schools (NCES district)
- District
- Caddo Parish
- NCES district ID
- 2200300
- Math proficiency
- 21% ▼ -33.00%
- Reading proficiency
- 32% ▼ -30.00%
- Median HH income
- $39,227
- Composite
- 22.23/100
- National rank
- #8148
- State rank
- #53 of 98 in LA
Livability — Shreveport
- Score
- 59/100
- State rank
- #270
- US rank
- #19730
Category grades
Schools grade is shown separately in the Schools card above.
Census & demographics
- Census place
- Shreveport, LA
- County
- Caddo Parish · 178,536 people
- City population
- 164,123
- Metro
- Shreveport-Bossier City, LA
- Population (ZIP)
- 23,219
- Household income
- $50,287
- Rent vs Own
- Severe rent burden
- 1046.0
Population outlook (Caddo County) Hauer SSP2
- Today (2025)
- 243,190 people
- By 2030
- 237,231 · -2.5%
- By 2040
- 222,502 · -8.5%
- By 2050
- 206,516 · -15.1%
- By 2075
- 165,706 · -31.9%
- By 2100
- 122,262 · -49.7%
Race, ethnicity, and origin ACS 2023
- Neighborhood character
- Diverse neighborhood (Simpson 0.55)
- Race & ethnicity
- Black 58% White 33% Two or more races 5% Hispanic / Latino 4% Asian 1%
- Common ancestry
- Slovak 2% Lithuanian 2% Serbian 1%
- Foreign-born
- 2% · Canada
- Languages at home
- 97% English-only · Spanish 2%
Political lean MEDSL · Caddo
- 2024 margin
- Toss-up / Even · D 51.6% · R 47.0% · Other 1.4%
- 2008→2024 swing
- +1.6pp toward D · 2008: 3.0pp · 2024: 4.6pp
- All cycles
- 2024: D+4.6 2020: D+6.8 2016: D+4.2 2012: D+4.9 2008: D+3.0
Not yet ingested
- Civics
- —
Market trends
- HPI YoY
- ▼ -78.81%
- Current HPI
- 129.1782
- Rent YoY
- ▲ 1.74%
- Metro
- Shreveport-Bossier City, LA
- State GDP YoY
- ▲ 3.29%
- F500 in state
- 10
Industry mix (Fortune 500 HQ in LA)
| Industry | F500 HQs | Revenue |
|---|---|---|
| Telecommunications | 2 | $23B |
|
||
| Utilities | 1 | $12B |
|
||
| Wholesale / Distribution | 1 | $5B |
|
||
| Advertising | 1 | $2B |
|
||
Price history
-12.0% since first listed4 events — show timeline
- 2025-12-29 Listed $110,000 NTREIS
- 2025-12-17 Listing Removed — NTREIS
- 2025-09-13 Price Changed $110,000 NTREIS
- 2025-06-17 Listed $125,000 NTREIS
Property tax history
-0.8%/yrLatest (2025): $1,167 · +0.4% YoY. Source: county tax records.
Cash-flow waterfall
monthlySold comps — $/sqft
last 12 mo · ≤1 miLoading sold comps…