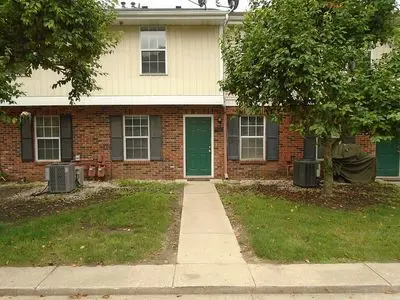
700 High St · Anderson, IN
Flood risk No data
- FEMA flood zone
- —
- Chance of flooding over 30 yrs
- —
- Est. flood insurance / yr
- —
Fire risk No data
- Est. fire insurance / yr
- —
Heat risk No data
- Hot days now (above threshold)
- —
- Hot days in 30 yrs
- —
Wind risk No data
- Chance of severe wind over 30 yrs
- —
Air-quality risk No data
- Unhealthy air days now
- —
- Unhealthy air days in 30 yrs
- —
Risk factors via First Street. Map © Google.
Why this score? — see what drove the D- grade
The composite is a weighted blend of 9 inputs, each scored 0–100. Each bar is that input's sub-score; the figure is the points it added to the 100-point composite (weight × sub-score).
- Cash flow +12.1/30.0
- ARV discount +7.5/15.0
- 1% rule +5.7/10.0
- DSCR +3.6/10.0
- Rent growth +3.0/5.0
- Livability +3.0/5.0
- Condition / age +2.5/5.0
- Schools +1.6/10.0
- Appreciation +0.0/10.0
$85,000
🖨 Deal sheet (PDF) 📄 Offer letter ✓ Due diligence
Listing remarks
Two bedroom townhouse condo. New downstairs flooring in 2024. New HVAC system in 2021. New fridge in 2024. All appliances included. Upstairs washer and dryer. Two reserved off-street parking places, one under carport. $125 per month HOA fee which includes water and sewer. * IMPORTANT * I do not carry a smart phone in my pocket. If you reply through Zillow message, I may not see it for up to 24 hours. If you& apos; re interested, please call me at 765-649-3274, leave a message, and I will return your call.
Key facts
- One under carport
- New fridge
- New hvac system
Tags
Neighborhood map
What this means for you Summary
Snapshot
- This is a 2-bed/1.5-bath condo listed at $85k.
Deal economics
- At list price, monthly cash flow is $-18 ($-219/yr) — negative.
- The deal already cash-flows at list — no discount required.
- Meets the 1% rule at list price ($912 rent vs $85k).
- Recommended offer: $82k (3.0% below list) — sets the bar for market timing.
Location & tenants
- Location reads 60/100 on livability (#521 in IN) — a middle-class / working-renter tenant base. Strengths: cost of living A+, housing A+; Watch: crime D-, amenities F, commute F.
- Anderson Community School Corporation (urban): math 15% / reading 23% proficiency, ranked #280 of 301 in IN (top 93%) — low school quality limits family demand, transient renter base, plan for 1-2y turnover; 70% free/reduced lunch — lower-income household profile, screen leases tightly.
- Zoned schools: Eastside Elementary School (math 34% / reading 36%, grade F, #590 of 994 statewide, top 60%, 511 students, 77% FRL); Highland Middle School (math 9% / reading 22%, grade F, #293 of 330 statewide, top 90%, 914 students, 81% FRL); Anderson High School (math 21% / reading 51%, grade F, #261 of 369 statewide, top 71%, 1,790 students, 76% FRL).
- Market conditions: Rents rising (+1.8%/yr); 162 active listings in the ZIP; 40 comparable units currently listed for rent nearby; rentals at typical pace (median 26d on market — plan ~3-4 weeks tenant-placement turnaround); 45% of comp listings sitting > 30 days — soft ceiling on asking rent; 184 units permitted in Madison County in 2024 (0 in 5+ unit buildings).
Forward outlook
- Local home prices are declining (-3.0%/yr); year-one equity from $588 of loan paydown is wiped out by about $3k of value loss. Plan a longer hold.
- Madison County population projected at -14% by 2050 — secular population decline; favor cash flow + early exit over multi-decade hold.
Negotiation context
- It's been on market 41 days — a 3% lower offer ($82k) is reasonable based on typical stale-listing flexibility.
- 5 sale attempts since 23y ago with the ask held roughly flat each time — persistent listings suggest the price (not the market) is what's stuck; bring a comps-based counter.
- Current owner paid $54k; list at $85k implies a 56% gain — meaningful room to come down on a strong offer.
Questions for the listing agent
- What do current leases actually rent for vs. the listed asking? Can we see a recent rent roll and the last 12 months of T-12 income?
- It's been on market 41 days. Have you received any prior offers? Is the seller open to a 3% concession, seller financing, or rate buy-down credit?
- What does the HOA fee cover, when was the last increase, and are there any pending special assessments or reserve-fund shortfalls?
- Any open or pending special assessments — roof, HVAC, plumbing, elevator, façade? What's the per-unit balance and payoff schedule, and is the seller paying it off at close or rolling it to the buyer?
- Is there a deadline driving the sale (1031 exchange, divorce, estate, relocation)? That informs how much negotiation room exists.
- Schools are F-rated, which usually means shorter tenancies and higher turnover. Who's the typical renter profile here, and what's been the actual vacancy rate?
- Crime grade is D in this area — have there been break-ins, vandalism, or insurance claims at this property in the last 3 years? What carrier currently insures it and at what premium?
- The area grade is low — what's the realistic commute time and amenity access for the typical tenant pool here? Any planned neighborhood developments (good or bad) we should know about?
- What's the average days-on-market for RENTAL listings here right now (not sales)? A rising rental-DOM trend means longer vacancies and softer asking-rent achievability than the comps imply.
- What's the recent tenant-quality profile in this submarket — average credit score on applications, eviction rate, late-payment / NSF rate, and stable-employment percentage? A property-management company in the area should have these aggregated.
- How much new apartment / multifamily construction is in the pipeline within 1–3 miles? Heavy new supply (>2% of stock underway) typically softens rents 12–24 months out; light construction supports rent growth.
Investment metrics
- 1% rule
- 1.07% ✓
- Cap rate
- 6.04%
- Cash-on-cash
- -0.92%
- DSCR
- 0.96
- GRM
- 7.8
CMA / ARV
No comps found within radius.
Projected returns pro-forma
-3.0% appreciation · 1.82% rent growth · sell at horizon
- IRR
- -19.3%
- Equity multiple
- 0.33×
- Total profit
- $-15,900
- Equity at exit
- $12,674
- IRR
- -15.1%
- Equity multiple
- 0.19×
- Total profit
- $-19,198
- Equity at exit
- $7,349
Cash invested: $23,800 (down + closing). Projections, not guarantees.
Landlord ↔ Tenant lean methodology
- Overall (STATE)
- 90 Strongly Landlord-Friendly
- State Indiana
- 90 Strongly Landlord-Friendly · R+11
- County
- — inherits STATE
- City
- — inherits STATE
ZIP-level market 46012
- Home prices YoY
- -18.6%
- Rents YoY
- 1.8%
- Active inventory
- 162
- Price-to-rent
- 7.8×
Monthly cashflow live
- Estimated rent
- $912 high interval (Pro) →
- Mortgage (P&I)
- −$446
- Tax from tax record
- −$123 /mo · $1,473/yr
- Insurance
- −$35
- HOA est. from 2 same-building comps
- −$135
- Lot rent
- −$0
- Vacancy / Maint / Mgmt
- −$192
- Net cashflow
- $-18
Break-even live
Sensitivity live
| Price | -10% $30 | -5% $6 | +0% $-18 | +5% $-42 | +10% $-66 |
|---|---|---|---|---|---|
| Rent | -10% $-90 | -5% $-54 | +0% $-18 | +5% $18 | +10% $54 |
| Rate | -1.0pp $25 | -0.5pp $3 | base $-18 | +0.5pp $-40 | +1.0pp $-63 |
UW: 25.0% down · 7.5% · 30yr · 1.5% tax · 5.0% vac · 8.0% maint · 8.0% mgmt
Financing live
Cash to close
- Down payment
- $21,250
- Closing costs
- $2,550
- Reserves months
- —
- Total cash needed
- —
Loan-product check · same deal, 3 products live
Conventional
25% down · 7.5% · 30yr
- Down + closing
- —
- Monthly P&I
- —
- Monthly cashflow
- —
- DSCR
- —
- Eligible?
- —
Personal DTI + credit; lowest rate.
DSCR
20% down · 8.5% · 30yr
- Down + closing
- —
- Monthly P&I
- —
- Monthly cashflow
- —
- DSCR
- —
- Eligible?
- —
No personal income docs; deal must DSCR.
Hard money
10% down · 12.0% · 12mo
- Down + closing
- —
- Monthly P&I
- —
- Monthly cashflow
- —
- DSCR
- —
- Eligible?
- —
Short-term bridge; refi at stabilization.
Rent comps 40 comps
| Address | Beds | Baths | Sqft | Rent | $/sqft | DOM | Units | Dist |
|---|---|---|---|---|---|---|---|---|
| 915 High St Unit 915 1/2 Anderson, IN | 1.0 | 1.0 | 600 | $650 | $1.08 | 46d | 1 | 0.14mi |
| 919 E 6th St Apt 2 Anderson, IN | 1.0 | 1.0 | 700 | $625 | $0.89 | 26d | 1 | 0.38mi |
| 917 E 8th St Unit 2 Anderson, IN | 2.0 | 1.0 | 550 | $825 | $1.50 | 10d | 1 | 0.52mi |
| 602 Meridian St Apt C Anderson, IN | 2.0 | 1.0 | 800 | $900 | $1.12 | 46d | 1 | 0.60mi |
| 602 Meridian St Unit 608 A Anderson, IN | 1.0 | 1.0 | 650 | $750 | $1.15 | 26d | 1 | 0.60mi |
| 414 Wheeler Ave Apt B Anderson, IN | 1.0 | 1.0 | 600 | $650 | $1.08 | 46d | 1 | 0.74mi |
| 223 E 11th St Anderson, IN | 2.0 | 1.0 | 800 | $900 | $1.12 | 46d | 1 | 0.76mi |
| 506 W 2nd St Anderson, IN | 3.0 | 1.0 | 964 | $1,095 | $1.14 | 26d | 1 | 0.84mi |
| 120 W 10th St Anderson, IN | 1.0–3.0 | 1.0 | 1066 | $1,025 | $0.96 | 0d | 1 | 0.85mi |
| 1411 Home Ave Anderson, IN | 3.0 | 1.0 | 810 | $1,295 | $1.60 | 26d | 1 | 0.87mi |
| 519 W 2nd St Anderson, IN | 1.0 | 1.0 | 650 | $800 | $1.23 | 46d | 1 | 0.87mi |
| 219 E 13th St Anderson, IN | 3.0 | 1.0 | 882 | $1,000 | $1.13 | 6d | 1 | 0.89mi |
| 221 E 13th St Anderson, IN | 1.0 | 1.0 | 595 | $995 | $1.67 | 17d | 1 | 0.89mi |
| 530 Alhambra Dr Anderson, IN | 1.0–2.0 | 1.0 | 879 | $1,100 | $1.25 | 46d | 1 | 0.90mi |
| 1829 E 8th St Anderson, IN | 1.0–3.0 | 1.0 | 810 | $1,025 | $1.27 | 26d | 9 | 0.94mi |
| 1317 Main St Unit D Anderson, IN | 2.0 | 1.0 | 834 | $725 | $0.87 | 1d | 1 | 0.96mi |
| 1317 Main St Anderson, IN | 2.0 | 1.0 | 750 | $800 | $1.07 | 46d | 1 | 0.96mi |
| 1045 Alhambra Dr Unit 6 Anderson, IN | 2.0 | 1.5 | 900 | $975 | $1.08 | 26d | 1 | 1.03mi |
| 1710 Jefferson St Apt 2 Anderson, IN | 2.0 | 1.0 | 550 | $950 | $1.73 | 46d | 1 | 1.11mi |
| 1321 Lafayette Ct Anderson, IN | 3.0 | 1.5 | 962 | $1,350 | $1.40 | 13d | 1 | 1.11mi |
| 1719 Johnson Ave Anderson, IN | 1.0 | 1.0 | 616 | $824 | $1.34 | 46d | 1 | 1.12mi |
| 803 1/2 W 9th St Anderson, IN | 1.0 | 1.0 | 600 | $525 | $0.88 | 46d | 1 | 1.14mi |
| 1726-1728 Walnut St Anderson, IN | 2.0 | 2.0 | 900 | $995 | $1.11 | 4d | 1 | 1.14mi |
| 924 W 5th St Unit 928 Anderson, IN | 1.0 | 1.0 | 600 | $600 | $1.00 | 46d | 1 | 1.16mi |
| 213 Madison Ave Anderson, IN | 1.0 | 1.0 | 600 | $650 | $1.08 | 46d | 1 | 1.17mi |
| 924 W 5th St Unit 924 Anderson, IN | 1.0 | 1.0 | 750 | $600 | $0.80 | 26d | 1 | 1.17mi |
| 215 S Madison Ave Anderson, IN | 1.0 | 1.0 | 600 | $650 | $1.08 | 46d | 1 | 1.17mi |
| 925 W 5th St Unit 1 Anderson, IN | 1.0 | 1.0 | 617 | $775 | $1.26 | 18d | 1 | 1.17mi |
| 1010 W 2nd St Unit 2 Anderson, IN | 2.0 | 1.0 | 875 | $1,025 | $1.17 | 24d | 1 | 1.19mi |
| 1010 W 2nd St Unit 1 Anderson, IN | 1.0 | 1.0 | 724 | $925 | $1.28 | 26d | 1 | 1.19mi |
| 1010 W 2nd St Unit 3 Anderson, IN | 3.0 | 1.0 | 1025 | $1,125 | $1.10 | 17d | 1 | 1.19mi |
| 2412 E 7th St Anderson, IN | 2.0 | 1.0 | 600 | $895 | $1.49 | 4d | 1 | 1.21mi |
| 1020 W 5th St Unit 1022 Anderson, IN | 1.0 | 1.0 | 550 | $750 | $1.36 | 46d | 1 | 1.24mi |
| 1807 Meridian St Apt 4 Anderson, IN | 2.0 | 1.0 | 600 | $675 | $1.12 | 1d | 1 | 1.27mi |
| 2002 Jefferson St Unit 3 Anderson, IN | 1.0 | 2.0 | 725 | $600 | $0.83 | 46d | 1 | 1.28mi |
| 2625 Lindberg Rd Anderson, IN | 1.0–2.0 | 1.0 | 756 | $1,385 | $1.83 | 46d | 1 | 1.29mi |
| 2505 E 10th St Anderson, IN | 1.0–2.0 | 1.0 | 850 | $949 | $1.12 | 46d | 2 | 1.38mi |
| 1704 S Cross Lakes Cir Unit 1704FS Anderson, IN | 1.0 | 1.0 | 750 | $1,130 | $1.51 | 46d | 1 | 1.41mi |
| 1704 S Cross Lakes Cir Unit 1704DS Anderson, IN | 1.0 | 1.0 | 750 | $1,080 | $1.44 | 13d | 1 | 1.41mi |
| 1312 W 8th St Unit 1308H Anderson, IN | 1.0 | 1.0 | 750 | $999 | $1.33 | 17d | 1 | 1.41mi |
HOA detail condo
- Monthly dues
- $0 · $0/yr
- Likely covers
- watersewer
- Assessments
- None detected in remarks — confirm with the listing agent.
Listing history 24 events
-
2026-06-22days on market $85,000 Active 41 DOM
-
2026-06-21days on market $85,000 Active 40 DOM
-
2026-06-18days on market $85,000 Active 37 DOM
-
2026-06-17days on market $85,000 Active 36 DOM
-
2026-06-16days on market $85,000 Active 35 DOM
-
2026-06-15days on market $85,000 Active 34 DOM
-
2026-06-13days on market $85,000 Active 32 DOM
-
2026-06-09days on market $85,000 Active 28 DOM
-
2026-06-08days on market $85,000 Active 27 DOM
-
2026-06-07days on market $85,000 Active 26 DOM
-
2026-06-05days on market $85,000 Active 23 DOM
-
2026-06-03days on market $85,000 Active 22 DOM
-
2026-06-02days on market $85,000 Active 21 DOM
-
2026-06-01days on market $85,000 Active 20 DOM
-
2026-05-31days on market $85,000 Active 19 DOM
-
2026-05-12$85,000 Active 505-char remark
-
2015-11-16historical
-
2015-05-18$59,900 Active
-
2012-06-30historical
-
2011-11-29$44,500
-
2010-08-11historical
-
2010-02-10$54,500
-
2003-06-19soldstatus $54,500
-
2003-05-05$53,900
ⓘ Source: listings_history table (triggers on properties + properties_extension) + one-shot
backfill from property_details.listing_events for pre-trigger history.
Tax reassessment forecast IN · Partial reset (capped growth)
- Current annual tax
- $1,473 · $123/mo
- Projected year-2 tax
- $1,473 · $123/mo
- Expected delta
- $0/yr ($0/mo · 0.0%)
ⓘ Screening estimate from a state-policy table — verify with the county assessor before closing.
Nearby sold comps map
Loading sold comps map…
Walkable amenities ~0.75 mi
Loading nearby amenities…
Taxation est. · year 1
- Rental income
- $10,947
- − Mortgage interest
- −$4,761
- − Property taxes
- −$1,473
- − Insurance
- −$425
- − Repairs & maintenance
- −$876
- − Management
- −$876
- − HOA
- −$1,620
- − Depreciation
- −$2,473
- Taxable loss
- −$1,557
- Est. tax savings @ 24.0%
- +$374
- After-tax cash flow
- $155/yr
For passive investors: Depreciation is non-cash, so a rental often shows a tax loss while cash-flowing — sheltering income. Rental losses are passive: they offset passive income freely, and up to $25,000/yr can offset ordinary (W-2) income if you actively participate and your MAGI is under $100k (phasing out to $0 by $150k); unused losses carry forward. On sale, claimed depreciation is recaptured at up to 25%, and gains may owe capital-gains tax (a 1031 exchange can defer both). Figures are a year-1 estimate at your 24.0% rate — not tax advice; consult a CPA.
Schools (NCES district)
- District
- Anderson Community School Corporation
- NCES district ID
- 1800150
- Math proficiency
- 15% ▼ -14.00%
- Reading proficiency
- 23% ▼ -7.00%
- Median HH income
- $38,208
- Composite
- 15.93/100
- National rank
- #9250
- State rank
- #280 of 301 in IN
Livability — Anderson
- Score
- 60/100
- State rank
- #521
- US rank
- #18709
Category grades
Schools grade is shown separately in the Schools card above.
Census & demographics
- Census place
- Anderson, IN
- County
- Madison County · 69,445 people
- City population
- 57,762
- Metro
- Indianapolis-Carmel-Anderson, IN
- Population (ZIP)
- 20,855
- Household income
- $58,041
- Rent vs Own
- Severe rent burden
- 987.0
Population outlook (Madison County) Hauer SSP2
- Today (2025)
- 125,800 people
- By 2030
- 122,640 · -2.5%
- By 2040
- 115,420 · -8.3%
- By 2050
- 108,148 · -14.0%
- By 2075
- 91,838 · -27.0%
- By 2100
- 75,670 · -39.8%
Race, ethnicity, and origin ACS 2023
- Neighborhood character
- Predominantly White (85%)
- Race & ethnicity
- White 85% Hispanic / Latino 5% Two or more races 4% Black 4%
- Hispanic origin (detail)
- Mexican 4%
- Common ancestry
- Slovak 3% Serbian 2% Italian 1%
- Foreign-born
- 2% · Canada, Vietnam
- Languages at home
- 96% English-only · Spanish 3%
Political lean MEDSL · Madison
- 2024 margin
- Strong R (+26.9) · D 35.6% · R 62.5% · Other 1.9%
- 2008→2024 swing
- -33.5pp toward R · 2008: 6.5pp · 2024: -26.9pp
- All cycles
- 2024: R+26.9 2020: R+22.6 2016: R+25.7 2012: R+4.5 2008: D+6.5
Not yet ingested
- Civics
- —
Market trends
- HPI YoY
- ▼ -61.16%
- Current HPI
- 266.9819
- Rent YoY
- ▲ 1.82%
- Metro
- Indianapolis-Carmel-Anderson, IN
- State GDP YoY
- ▲ 2.90%
- F500 in state
- 18
Industry mix (Fortune 500 HQ in IN)
| Industry | F500 HQs | Revenue |
|---|---|---|
| Industrial Machinery | 2 | $37B |
|
||
| Healthcare | 1 | $177B |
|
||
| Pharmaceuticals | 1 | $45B |
|
||
| Metals / Steel | 1 | $18B |
|
||
| Agriculture | 1 | $17B |
|
||
| Packaging | 1 | $12B |
|
||
Price history
+57.7% since first listed9 events — show timeline
- 2026-05-12 Listed $85,000 FSBO.com
- 2015-11-16 Listing Removed — MIBOR as Distributed by MLS Grid
- 2015-05-18 Listed $59,900 MIBOR as Distributed by MLS Grid
- 2012-06-30 Listing Removed — MIBOR as Distributed by MLS Grid
- 2011-11-29 Listed $44,500 MIBOR as Distributed by MLS Grid
- 2010-08-11 Listing Removed — MIBOR as Distributed by MLS Grid
- 2010-02-10 Listed $54,500 MIBOR as Distributed by MLS Grid
- 2003-06-19 Sold (MLS) $54,500 MIBOR as Distributed by MLS Grid
- 2003-05-05 Listed $53,900 MIBOR as Distributed by MLS Grid
Property tax history
+3.6%/yrLatest (2024): $1,473 · +8.3% YoY. Source: county tax records.
Cash-flow waterfall
monthlySold comps — $/sqft
last 12 mo · ≤1 miLoading sold comps…