9201 Clarewood Dr #245 · Houston, TX
Flood risk 5/10 · Moderate
- FEMA flood zone
- X (unshaded)
- Chance of flooding over 30 yrs
- 0.67%
- Est. flood insurance / yr
- $507 – $1,088
Fire risk 1/10 · Minimal
- Est. fire insurance / yr
- $1,222 – $2,270
Heat risk 9/10 · Severe
- Hot days now (above 110°F)
- 7 days/yr
- Hot days in 30 yrs
- 24 days/yr
Wind risk 9/10 · Severe
- Chance of severe wind over 30 yrs
- 99.0%
Air-quality risk 2/10 · Minimal
- Unhealthy air days now
- 2 days/yr
- Unhealthy air days in 30 yrs
- 2 days/yr
Risk factors via First Street. Map © Google.
Why this score? — see what drove the D grade
The composite is a weighted blend of 9 inputs, each scored 0–100. Each bar is that input's sub-score; the figure is the points it added to the 100-point composite (weight × sub-score).
- ARV discount +14.2/15.0
- 1% rule +7.6/10.0
- Cash flow +5.0/30.0
- Appreciation +4.6/10.0
- Livability +3.7/5.0
- Condition / age +2.5/5.0
- Schools +2.1/10.0
- Rent growth +0.8/5.0
- DSCR +0.0/10.0
$66,000
🖨 Deal sheet (PDF) 📄 Offer letter ✓ Due diligence
Listing remarks MLS
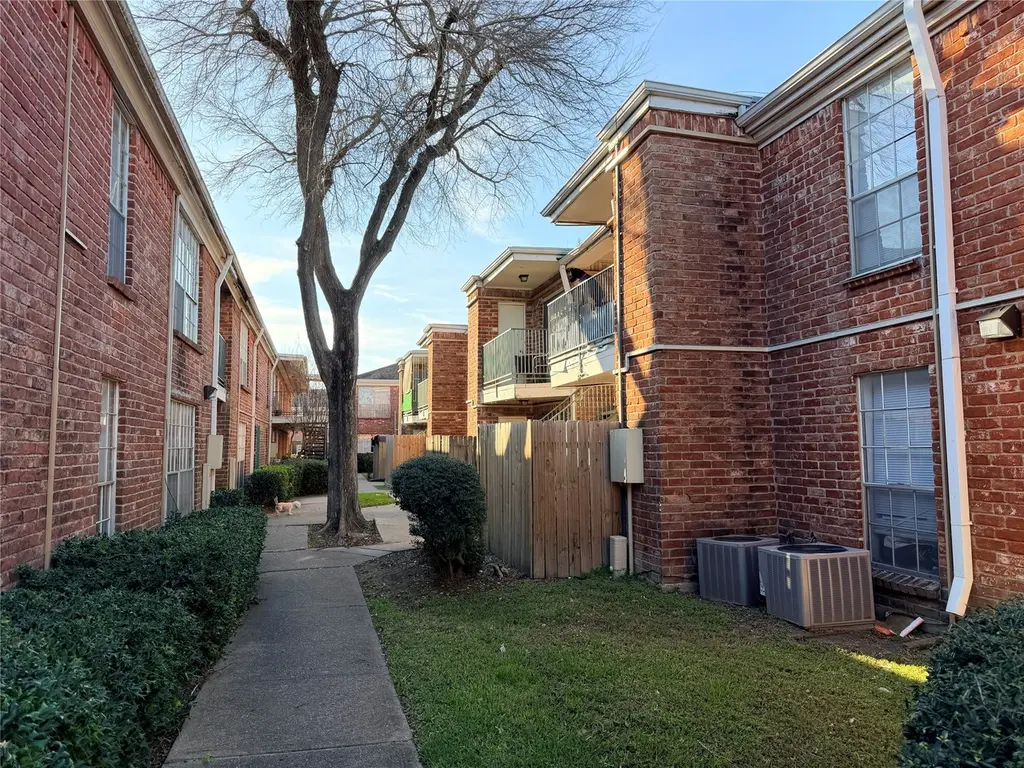
Tenant occupied. Welcome to this charming 1 bedroom, 1 bathroom condo surrounded by shopping and dining. This cozy home features a spacious living area, modern kitchen, and a balcony. Water, sewer and trash removal are included by monthly HOA. This home is ideal for anyone looking for comfort and convenience. Contact me for more information and to schedule a viewing.
Key facts
- Spacious living area
- Balcony
- Modern kitchen
Tags
Neighborhood map
What this means for you Summary
Snapshot
- This is a 1-bed/1.0-bath condo listed at $66k.
Deal economics
- At list price, monthly cash flow is $-154 ($-2k/yr) — negative.
- To cash-flow at today's rent, offer at most $39k (41.2% below list).
- Meets the 1% rule at list price ($835 rent vs $66k).
- Recommended offer: $39k (41.2% below list) — sets the bar for cash-flow.
Location & tenants
- Location reads 74/100 on livability (#184 in TX, #4,771 nationally) — a middle-class / working-renter tenant base. Strengths: amenities A+, cost of living A+, housing A+; Watch: crime F.
- Alief ISD (urban): math 23% / reading 28% proficiency, ranked #717 of 826 in TX (top 87%) — low school quality limits family demand, transient renter base, plan for 1-2y turnover; 74% free/reduced lunch — lower-income household profile, screen leases tightly.
- Zoned schools: Collins El (math 18% / reading 24%, grade F, #3,492 of 4,322 statewide, top 81%, 798 students, 92% FRL); Alief Middle (math 22% / reading 26%, grade F, #1,301 of 1,662 statewide, top 79%, 839 students, 87% FRL); Alief Isd J J A E P (13 students, 77% FRL).
- Market conditions: Rents falling (-6.6%/yr); 202 active listings in the ZIP; 40 comparable units currently listed for rent nearby; rentals at typical pace (median 20d on market — plan ~3-4 weeks tenant-placement turnaround); 29,883 units permitted in Harris County in 2024 (8,621 in 5+ unit buildings).
Forward outlook
- Local home prices are declining (-0.7%/yr); year-one equity from $456 of loan paydown is wiped out by about $482 of value loss. Plan a longer hold.
- Harris County population projected at +47% by 2050 — long-run rental-demand tailwind backs the buy-and-hold thesis.
Negotiation context
- It's been on market 118 days — a 9% lower offer ($60k) is reasonable based on typical stale-listing flexibility.
Risks & watch-outs
- Watch-outs: property tax is 2.5% of price; HOA is 36% of rent.
- Climate carrying-cost: moderate flood risk; severe wind risk, 99% chance of damaging wind over 30y; extreme-heat days projected 7→24/yr by 2055 (HVAC capex compounding) — expect insurance premiums to compound above CPI over the hold.
Questions for the listing agent
- What do current leases actually rent for vs. the listed asking? Can we see a recent rent roll and the last 12 months of T-12 income?
- It's been on market 118 days. Have you received any prior offers? Is the seller open to a 41% concession, seller financing, or rate buy-down credit?
- Built in 1979 — when were the roof, HVAC, electrical panel, plumbing, and water heater last replaced?
- Property tax is high relative to price — has the assessment been appealed recently, and will the sale trigger a re-assessment?
- What does the HOA fee cover, when was the last increase, and are there any pending special assessments or reserve-fund shortfalls?
- Any open or pending special assessments — roof, HVAC, plumbing, elevator, façade? What's the per-unit balance and payoff schedule, and is the seller paying it off at close or rolling it to the buyer?
- Why hasn't it sold? Are there any deal-killer items the seller is aware of (foundation, flood, title, zoning, code violations)?
- Is there a deadline driving the sale (1031 exchange, divorce, estate, relocation)? That informs how much negotiation room exists.
- Schools are D-rated, which usually means shorter tenancies and higher turnover. Who's the typical renter profile here, and what's been the actual vacancy rate?
- Crime grade is F in this area — have there been break-ins, vandalism, or insurance claims at this property in the last 3 years? What carrier currently insures it and at what premium?
- The area grade is low — what's the realistic commute time and amenity access for the typical tenant pool here? Any planned neighborhood developments (good or bad) we should know about?
- What's the average days-on-market for RENTAL listings here right now (not sales)? A rising rental-DOM trend means longer vacancies and softer asking-rent achievability than the comps imply.
- What's the recent tenant-quality profile in this submarket — average credit score on applications, eviction rate, late-payment / NSF rate, and stable-employment percentage? A property-management company in the area should have these aggregated.
- How much new apartment / multifamily construction is in the pipeline within 1–3 miles? Heavy new supply (>2% of stock underway) typically softens rents 12–24 months out; light construction supports rent growth.
Investment metrics
- 1% rule
- 1.26% ✓
- Cap rate
- 3.49%
- Cash-on-cash
- -10.00%
- DSCR
- 0.55
- GRM
- 6.6
CMA / ARV
- ARV (median comp)
- $77,500
- List price
- $66,000
- Delta
- -14.84%
- Verdict
- UNDERPRICED
- Comps
- 20 within 1.0 mi
Projected returns pro-forma
-0.73% appreciation · 0.0% rent growth · sell at horizon
- IRR
- -21.0%
- Equity multiple
- 0.12×
- Total profit
- $-16,189
- Equity at exit
- $16,787
- IRR
- -19.6%
- Equity multiple
- -0.57×
- Total profit
- $-29,025
- Equity at exit
- $18,368
Cash invested: $18,480 (down + closing). Projections, not guarantees.
Landlord ↔ Tenant lean methodology
- Overall (STATE)
- 87 Strongly Landlord-Friendly
- State Texas
- 87 Strongly Landlord-Friendly · R+5
- County
- — inherits STATE
- City
- — inherits STATE
ZIP-level market 77036
- Home prices YoY
- -0.3%
- Rents YoY
- -6.6%
- Active inventory
- 202
- Price-to-rent
- 6.6×
Monthly cashflow live
- Estimated rent
- $835 high interval (Pro) →
- Mortgage (P&I)
- −$346
- Tax from tax record
- −$140 /mo · $1,680/yr
- Insurance
- −$28
- HOA
- −$300
- Vacancy / Maint / Mgmt
- −$175
- Net cashflow
- $-154
Break-even live
Sensitivity live
| Price | -10% $-117 | -5% $-135 | +0% $-154 | +5% $-173 | +10% $-191 |
|---|---|---|---|---|---|
| Rent | -10% $-220 | -5% $-187 | +0% $-154 | +5% $-121 | +10% $-88 |
| Rate | -1.0pp $-121 | -0.5pp $-137 | base $-154 | +0.5pp $-171 | +1.0pp $-189 |
UW: 25.0% down · 7.5% · 30yr · 1.5% tax · 5.0% vac · 8.0% maint · 8.0% mgmt
Financing live
Cash to close
- Down payment
- $16,500
- Closing costs
- $1,980
- Reserves months
- —
- Total cash needed
- —
Loan-product check · same deal, 3 products live
Conventional
25% down · 7.5% · 30yr
- Down + closing
- —
- Monthly P&I
- —
- Monthly cashflow
- —
- DSCR
- —
- Eligible?
- —
Personal DTI + credit; lowest rate.
DSCR
20% down · 8.5% · 30yr
- Down + closing
- —
- Monthly P&I
- —
- Monthly cashflow
- —
- DSCR
- —
- Eligible?
- —
No personal income docs; deal must DSCR.
Hard money
10% down · 12.0% · 12mo
- Down + closing
- —
- Monthly P&I
- —
- Monthly cashflow
- —
- DSCR
- —
- Eligible?
- —
Short-term bridge; refi at stabilization.
Rent comps 40 comps
| Address | Beds | Baths | Sqft | Rent | $/sqft | DOM | Units | Dist |
|---|---|---|---|---|---|---|---|---|
| 9207 Clarewood Dr Houston, TX | 1.0 | 1.0 | 660 | $833 | $1.26 | 24d | 1 | 0.09mi |
| 9207 Clarewood Dr Houston, TX | 1.0 | 1.0 | 660 | $833 | $1.26 | 45d | 1 | 0.09mi |
| 7255 Corporate Dr Apt 714 Houston, TX | 1.0 | 1.0 | 682 | $905 | $1.33 | 26d | 1 | 0.40mi |
| 7255 Corporate Dr Unit 1312 Houston, TX | 1.0 | 1.0 | 612 | $880 | $1.44 | 26d | 1 | 0.40mi |
| 7255 Corporate Dr Apt 406 Houston, TX | 1.0 | 1.0 | 682 | $925 | $1.36 | 45d | 1 | 0.42mi |
| 7255 Corporate Dr Unit 906 Houston, TX | 1.0 | 1.0 | 612 | $895 | $1.46 | 45d | 1 | 0.42mi |
| 7255 Corporate Dr Unit 314 Houston, TX | 1.0 | 1.0 | 682 | $905 | $1.33 | 45d | 1 | 0.42mi |
| 5915 Ranchester Dr Houston, TX | 1.0 | 1.0 | 563 | $841 | $1.49 | 45d | 1 | 0.57mi |
| 5909 Ranchester Dr Unit 5951 Houston, TX | 1.0 | 1.0 | 380 | $771 | $2.03 | 12d | 1 | 0.59mi |
| 5909 Ranchester Dr Unit 5960 Houston, TX | 1.0 | 1.0 | 563 | $708 | $1.26 | 17d | 1 | 0.59mi |
| 5909 Ranchester Dr Unit 1162 Houston, TX | 1.0 | 1.0 | 610 | $836 | $1.37 | 9d | 1 | 0.59mi |
| 5909 Ranchester Dr Unit 1165 Houston, TX | 1.0 | 1.0 | 610 | $825 | $1.35 | 1d | 1 | 0.59mi |
| 5909 Ranchester Dr Unit 165 Houston, TX | 1.0 | 1.0 | 380 | $741 | $1.95 | 1d | 1 | 0.59mi |
| 5909 Ranchester Dr Unit 5930 Houston, TX | 1.0 | 1.0 | 610 | $875 | $1.43 | 12d | 1 | 0.59mi |
| 8701 Town Park Dr Houston, TX | 1.0–2.0 | 1.0–2.0 | 890 | $655 | $0.74 | 0d | 75 | 0.66mi |
| 8707 Town Park Dr Unit 3282 Houston, TX | 1.0 | 1.0 | 653 | $799 | $1.22 | 26d | 1 | 0.70mi |
| 3900 Woodchase Dr Houston, TX | 1.0–2.0 | 1.0 | 612 | $1,000 | $1.63 | 1d | 3 | 1.01mi |
| 3900 Woodchase Dr Houston, TX | 1.0 | 1.0 | 502 | $1,000 | $1.99 | 45d | 1 | 1.01mi |
| 9307 Beechnut St Houston, TX | 1.0 | 1.0 | 602 | $820 | $1.36 | 45d | 1 | 1.08mi |
| 9307 Beechnut St Houston, TX | 1.0 | 1.0 | 602 | $820 | $1.36 | 19d | 1 | 1.08mi |
| 10051 Westpark Dr #263 Houston, TX | 1.0 | 1.0 | 680 | $950 | $1.40 | 45d | 1 | 1.10mi |
| 9501 Beechnut St Houston, TX | — | 1.0 | 590 | $775 | $1.31 | 26d | 1 | 1.11mi |
| 8181 Colony Dr Unit 8232 Houston, TX | 1.0 | 1.0 | 602 | $684 | $1.14 | 14d | 1 | 1.13mi |
| 8181 Colony Dr Unit 1162 Houston, TX | 1.0 | 1.0 | 602 | $695 | $1.15 | 9d | 1 | 1.13mi |
| 8181 Colony Dr Unit 8255 Houston, TX | 1.0 | 1.0 | 602 | $730 | $1.21 | 14d | 1 | 1.13mi |
| 8181 Colony Dr Unit 8255 Houston, TX | 1.0 | 1.0 | 602 | $684 | $1.14 | 1d | 1 | 1.13mi |
| 8181 Colony Dr Unit 8223 Houston, TX | 1.0 | 1.0 | 450 | $664 | $1.48 | 1d | 1 | 1.13mi |
| 9501 Beechnut St Unit 707 Houston, TX | 1.0 | 1.0 | 660 | $775 | $1.17 | 26d | 1 | 1.13mi |
| 9501 Beechnut St Unit 216 Houston, TX | 1.0 | 1.0 | 660 | $775 | $1.17 | 24d | 1 | 1.13mi |
| 9501 Beechnut St Unit 321 Houston, TX | — | 1.0 | 590 | $705 | $1.19 | 24d | 1 | 1.13mi |
| 8100 Bellaire Blvd Houston, TX | 1.0–3.0 | 1.0–2.0 | 881 | $735 | $0.83 | 1d | 26 | 1.14mi |
| 10575 Westpark Dr Houston, TX | 1.0–2.0 | 1.0–2.0 | 878 | $1,121 | $1.28 | 0d | 20 | 1.15mi |
| 4033 W Sam Houston Pkwy S Houston, TX | 1.0 | 1.0 | 365 | $1,104 | $3.02 | 1d | 12 | 1.16mi |
| 8100 Sands Point Dr Houston, TX | 1.0–3.0 | 1.0–2.0 | 953 | $837 | $0.88 | 0d | 28 | 1.19mi |
| 10070 Westpark Dr Houston, TX | 1.0–2.0 | 1.0–2.0 | 720 | $785 | $1.09 | 1d | 19 | 1.21mi |
| 10100 Westpark Dr Houston, TX | 1.0–2.0 | 1.0–2.0 | 891 | $729 | $0.82 | 19d | 21 | 1.21mi |
| 10010 Westpark Dr Unit 1104 Houston, TX | 1.0 | 1.0 | 710 | $1,069 | $1.51 | 26d | 1 | 1.25mi |
| 22 Sands Point Dr Houston, TX | 1.0 | 1.0 | 610 | $955 | $1.57 | 45d | 1 | 1.26mi |
| 7900 Bellaire Blvd Houston, TX | 1.0–3.0 | 1.0–2.0 | 942 | $850 | $0.90 | 19d | 1 | 1.31mi |
| 3777 S Gessner Rd Unit 1108 Houston, TX | 1.0 | 1.0 | 670 | $920 | $1.37 | 45d | 1 | 1.34mi |
HOA detail condo
- Monthly dues
- $300 · $3,600/yr
- Likely covers
- watersewertrash
- Assessments
- None detected in remarks — confirm with the listing agent.
Listing history 18 events
-
2026-06-21days on market $66,000 Active 118 DOM
-
2026-06-18days on market $66,000 Active 115 DOM
-
2026-06-17days on market $66,000 Active 114 DOM
-
2026-06-16days on market $66,000 Active 113 DOM
-
2026-06-15days on market $66,000 Active 112 DOM
-
2026-06-13days on market $66,000 Active 110 DOM
-
2026-06-09days on market $66,000 Active 106 DOM
-
2026-06-08days on market $66,000 Active 105 DOM
-
2026-06-07days on market $66,000 Active 104 DOM
-
2026-06-04days on market $66,000 Active 101 DOM
-
2026-06-03days on market $66,000 Active 100 DOM
-
2026-06-02days on market $66,000 Active 99 DOM
-
2026-06-01days on market $66,000 Active 98 DOM
-
2026-05-31days on market $66,000 Active 97 DOM
-
2026-04-20price $66,000 370-char remark
Show marketing remark (370 chars)
Tenant occupied. Welcome to this charming 1 bedroom, 1 bathroom condo surrounded by shopping and dining. This cozy home features a spacious living area, modern kitchen, and a balcony. Water, sewer and trash removal are included by monthly HOA. This home is ideal for anyone looking for comfort and convenience. Contact me for more information and to schedule a viewing.
-
2026-03-13price $70,000 370-char remark
Show marketing remark (370 chars)
Tenant occupied. Welcome to this charming 1 bedroom, 1 bathroom condo surrounded by shopping and dining. This cozy home features a spacious living area, modern kitchen, and a balcony. Water, sewer and trash removal are included by monthly HOA. This home is ideal for anyone looking for comfort and convenience. Contact me for more information and to schedule a viewing.
-
2026-02-23$80,000 Active 370-char remark
Show marketing remark (370 chars)
Tenant occupied. Welcome to this charming 1 bedroom, 1 bathroom condo surrounded by shopping and dining. This cozy home features a spacious living area, modern kitchen, and a balcony. Water, sewer and trash removal are included by monthly HOA. This home is ideal for anyone looking for comfort and convenience. Contact me for more information and to schedule a viewing.
-
1993-01-02soldstatus
ⓘ Source: listings_history table (triggers on properties + properties_extension) + one-shot
backfill from property_details.listing_events for pre-trigger history.
Tax reassessment forecast TX · Resets to sale price
- Current annual tax
- $1,680 · $140/mo
- Projected year-2 tax
- $1,680 · $140/mo
- Expected delta
- $0/yr ($0/mo · 0.0%)
ⓘ Screening estimate from a state-policy table — verify with the county assessor before closing.
Climate risk First Street
- Flood 5/10 Major FEMA zone X (unshaded) · 67% chance over 30 yrs
- Wildfire 1/10 Low
- Heat 9/10 Extreme 7 d/yr ≥110°F today · 24 d/yr by 30 yrs out
- Wind 9/10 Extreme 99% chance of damaging wind over 30 yrs
- Air quality 2/10 Low 2 unhealthy d/yr today · 2 by 30 yrs out
Nearby sold comps map
Loading sold comps map…
Walkable amenities ~0.75 mi
Loading nearby amenities…
Taxation est. · year 1
- Rental income
- $10,019
- − Mortgage interest
- −$3,697
- − Property taxes
- −$1,680
- − Insurance
- −$330
- − Repairs & maintenance
- −$801
- − Management
- −$801
- − HOA
- −$3,600
- − Depreciation
- −$1,920
- Taxable loss
- −$2,811
- Est. tax savings @ 24.0%
- +$675
- After-tax cash flow
- $-1,174/yr
For passive investors: Depreciation is non-cash, so a rental often shows a tax loss while cash-flowing — sheltering income. Rental losses are passive: they offset passive income freely, and up to $25,000/yr can offset ordinary (W-2) income if you actively participate and your MAGI is under $100k (phasing out to $0 by $150k); unused losses carry forward. On sale, claimed depreciation is recaptured at up to 25%, and gains may owe capital-gains tax (a 1031 exchange can defer both). Figures are a year-1 estimate at your 24.0% rate — not tax advice; consult a CPA.
Schools (NCES district)
- District
- Alief ISD
- NCES district ID
- 4807830
- Math proficiency
- 23% ▼ -19.00%
- Reading proficiency
- 28% ▼ -8.00%
- Median HH income
- $37,775
- Composite
- 21.29/100
- National rank
- #8391
- State rank
- #717 of 826 in TX
Livability — Houston
- Score
- 74/100
- State rank
- #184
- US rank
- #4771
Category grades
Schools grade is shown separately in the Schools card above.
Census & demographics
- Census place
- Houston, TX
- County
- Harris County · 4,702,590 people
- City population
- 3,226,434
- Metro
- Houston-The Woodlands-Sugar Land, TX
- Population (ZIP)
- 71,770
- Household income
- $45,716
- Rent vs Own
- Severe rent burden
- 4374.0
Population outlook (Harris County) Hauer SSP2
- Today (2025)
- 5,571,493 people
- By 2030
- 6,089,821 · +9.3%
- By 2040
- 7,142,806 · +28.2%
- By 2050
- 8,185,864 · +46.9%
- By 2075
- 10,574,329 · +89.8%
- By 2100
- 12,109,958 · +117.4%
Race, ethnicity, and origin ACS 2023
- Neighborhood character
- Predominantly Hispanic (71%)
- Race & ethnicity
- Hispanic / Latino 71% Two or more races 28% Black 11% Asian 9% White 7%
- Hispanic origin (detail)
- Mexican 33% Cuban 3%
- Foreign-born
- 55% · Canada, China, Vietnam
- Languages at home
- 20% English-only · Spanish 66% Chinese 5% Vietnamese 2%
Political lean MEDSL · Harris
- 2024 margin
- Lean D (+5.5) · D 52.0% · R 46.4% · Other 1.6%
- 2008→2024 swing
- +3.9pp toward D · 2008: 1.6pp · 2024: 5.5pp
- All cycles
- 2024: D+5.5 2020: D+13.3 2016: D+12.4 2012: D+0.1 2008: D+1.6
Not yet ingested
- Civics
- —
Market trends
- HPI YoY
- ▼ -0.73%
- Current HPI
- 221.1045
- Rent YoY
- ▼ -6.62%
- Metro
- Houston-The Woodlands-Sugar Land, TX
- State GDP YoY
- ▲ 3.95%
- F500 in state
- 110
Industry mix (Fortune 500 HQ in TX)
| Industry | F500 HQs | Revenue |
|---|---|---|
| Energy | 16 | $1,198B |
|
||
| Technology | 5 | $198B |
|
||
| Engineering / Construction | 4 | $72B |
|
||
| Energy Services | 3 | $60B |
|
||
| Utilities | 3 | $41B |
|
||
| Healthcare | 2 | $330B |
|
||
Price history
-17.5% since first listed4 events — show timeline
- 2026-04-20 Price Changed $66,000 HARMLS
- 2026-03-13 Price Changed $70,000 HARMLS
- 2026-02-23 Listed $80,000 HARMLS
- 1993-01-02 Sold (Public Records) — Public Records
Property tax history
+7.1%/yrLatest (2025): $1,680 · +19.1% YoY. Source: county tax records.
Cash-flow waterfall
monthlySold comps — $/sqft
last 12 mo · ≤1 miLoading sold comps…