6 Chinook Ln · Orofino, ID
Flood risk 10/10 · Severe
- FEMA flood zone
- X (shaded)
- Chance of flooding over 30 yrs
- 0.99%
- Est. flood insurance / yr
- $507 – $1,088
Fire risk 6/10 · Moderate
- Est. fire insurance / yr
- $584 – $1,086
Heat risk 5/10 · Moderate
- Hot days now (above 95°F)
- 10 days/yr
- Hot days in 30 yrs
- 23 days/yr
Wind risk 1/10 · Minimal
- Chance of severe wind over 30 yrs
- —
Air-quality risk 9/10 · Severe
- Unhealthy air days now
- 16 days/yr
- Unhealthy air days in 30 yrs
- 18 days/yr
Risk factors via First Street. Map © Google.
Why this score? — see what drove the D+ grade
The composite is a weighted blend of 9 inputs, each scored 0–100. Each bar is that input's sub-score; the figure is the points it added to the 100-point composite (weight × sub-score).
- Cash flow +15.0/30.0
- ARV discount +7.5/15.0
- 1% rule +5.0/10.0
- DSCR +5.0/10.0
- Schools +3.9/10.0
- Livability +3.8/5.0
- Rent growth +2.5/5.0
- Condition / age +2.5/5.0
- Appreciation +0.0/10.0
$12,000
🖨 Deal sheet 📄 Offer letter ✓ Due diligence
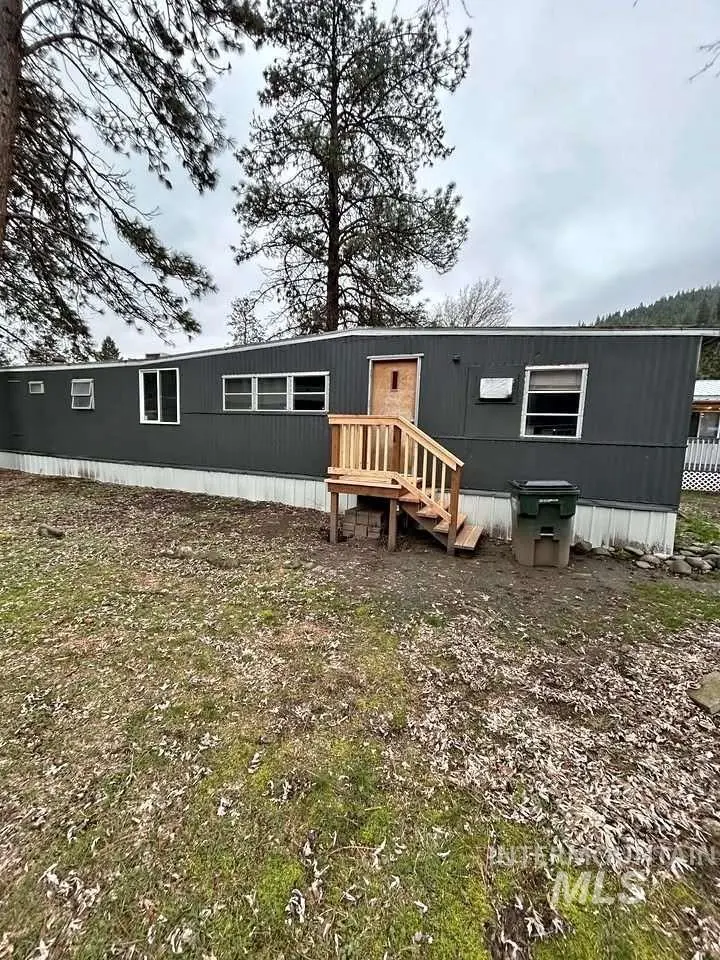
Listing remarks
Opportunity awaits in Hidden Village Mobile Home Park. This 1970 manufactured home offers 2 bedrooms and 1 bathroom and is ideal for an experienced rehabber or investor. The home has had the exterior repainted and was professionally releveled in late 2025, giving you a solid head start on improvements. New flooring and minor rehab work completed inside. Interior updates and repairs are still needed.
Key facts
- New flooring
- Minor rehab work
- Exterior repainted
Tags
Property features AI
Finance
- Other: Directions: From Hwy 12, cross the Bridge St bridge. Turn right on Clearwater Ave, then left on Chinook Ln. Property is on the right.; Located in Clearwater County area; Listing broker: Congress Realty, Inc
- Financial info: Homeowner tax exemption
Exterior
- Home design: Manufactured/mobile home on a rented lot; Built in 1970
- Construction: Manufactured construction
- Exterior features: Small lot (about 5,999 sq ft)
Interior
- Bedrooms: 2 bedrooms (both on the main level)
- Bathrooms: 1 bathroom
- Heating & cooling: No heating; No cooling
- Interior features: Main-level living
Neighborhood map
What this means for you Summary
Snapshot
- This is a 2-bed/1.0-bath manufactured listed at $12k.
Deal economics
- At list price, monthly cash flow is $560 ($7k/yr) — positive.
- The deal already cash-flows at list — no discount required.
- Meets the 1% rule at list price ($898 rent vs $12k).
- Recommended offer: $12k (3.0% below list) — sets the bar for market timing.
- Cap rate 69.0% vs local median 2.4% in Orofino — top-decile yield for the area; either an underpriced asset or a hidden risk that comps aren't pricing in. Stress-test before assuming the spread holds.
Location & tenants
- Location reads 76/100 on livability (#27 in ID, #3,806 nationally) — a middle-class / working-renter tenant base. Strengths: crime A+, cost of living A+, housing A+; Watch: amenities F, commute F, employment D-.
- Orofino Joint District (town): math 37% / reading 56% proficiency, ranked #45 of 92 in ID (top 49%) — families likely to look elsewhere, expect single-tenant / working-renter base with shorter leases.
- Zoned schools: Orofino Elementary School (math 42% / reading 52%, grade D-, #176 of 357 statewide, top 53%, 376 students, 41% FRL); Orofino High School (math 32% / reading 67%, grade D, #45 of 169 statewide, top 29%, 372 students, 25% FRL).
- Market conditions: 81 active listings in the ZIP; 51 units permitted in Clearwater County in 2024 (0 in 5+ unit buildings).
Forward outlook
- Local home prices are declining (-3.0%/yr); year-one equity from $83 of loan paydown is wiped out by about $360 of value loss. Plan a longer hold.
- Clearwater County population projected to shrink 6% by 2050 — rents likely to lag national; underwrite the cash flow, not the appreciation.
- At projected returns (-3.0% appreciation + 3.0% rent growth), your $3k cash investment doubles in ~1 year — after that, you're playing with house money.
Negotiation context
- It's been on market 55 days — a 3% lower offer ($12k) is reasonable based on typical stale-listing flexibility.
Risks & watch-outs
- Watch-outs: flood insurance adds $66/mo.
- Climate carrying-cost: severe flood risk; major wildfire risk; extreme-heat days projected 10→23/yr by 2055 (HVAC capex compounding) — expect insurance premiums to compound above CPI over the hold.
Questions for the listing agent
- It's been on market 55 days. Have you received any prior offers? Is the seller open to a 3% concession, seller financing, or rate buy-down credit?
- Built in 1970 — when were the roof, HVAC, electrical panel, plumbing, and water heater last replaced?
- What's the actual annual flood-insurance premium (NFIP or private), and is the property in a SFHA with mandatory coverage?
- Is there a deadline driving the sale (1031 exchange, divorce, estate, relocation)? That informs how much negotiation room exists.
- Schools are D-rated, which usually means shorter tenancies and higher turnover. Who's the typical renter profile here, and what's been the actual vacancy rate?
- The area grade is low — what's the realistic commute time and amenity access for the typical tenant pool here? Any planned neighborhood developments (good or bad) we should know about?
- What's the average days-on-market for RENTAL listings here right now (not sales)? A rising rental-DOM trend means longer vacancies and softer asking-rent achievability than the comps imply.
- What's the recent tenant-quality profile in this submarket — average credit score on applications, eviction rate, late-payment / NSF rate, and stable-employment percentage? A property-management company in the area should have these aggregated.
- How much new for-sale + rental construction is in the pipeline within 1–3 miles? Heavy new supply typically softens prices + rents 12–24 months out; constrained supply supports both.
Investment metrics
- 1% rule
- 7.49% ✓
- Cap rate
- 68.96%
- Cash-on-cash
- 223.83%
- DSCR
- 10.96
- GRM
- 1.1
CMA / ARV
- ARV (on-the-fly)
- $69,225
- Comps found
- 8
Show comp detail 8 sales within ~0.75 mi
| Address | Dist | Beds/Ba | Sqft | Sold | Price | $/sf | Match |
|---|---|---|---|---|---|---|---|
| 3 Steelhead Ln | 0.09mi | 2/1.0 | 968 (-1%) | 13mo | $35,000 | $36 | 84 |
| 13 Chinook Ln | 0.05mi | 3/2.0 (+1) | 1,020 (+5%) | 4mo | $79,900 | $78 | 78 |
| 5 Chinook Ln | 0.10mi | 3/2.0 (+1) | 1,020 (+5%) | 5mo | $79,900 | $78 | 74 |
| 10 Kamloop Ln | 0.05mi | 3/2.0 (+1) | 880 (-10%) | 16mo | $89,000 | $101 | 59 |
| 8 Dusk Dr | 0.50mi | 2/1.0 | 960 (-2%) | 18mo | $49,000 | $51 | 59 |
| 10 Bass Ln | 0.10mi | 2/1.0 | 840 (-14%) | 19mo | $60,000 | $71 | 56 |
| 16 Chinook Ln | 0.11mi | 3/2.0 (+1) | 1,066 (+9%) | 21mo | $62,000 | $58 | 53 |
| 7 Twilight Dr | 0.50mi | 2/2.0 | 1,072 (+10%) | 21mo | $69,000 | $64 | 39 |
Match score weights: distance 35% · size 25% · config 20% · recency 20%. Top-matched comps best support the ARV.
Projected returns pro-forma
-3.0% appreciation · 3.0% rent growth · sell at horizon
- IRR
- —
- Equity multiple
- 11.06×
- Total profit
- $33,793
- Equity at exit
- $1,789
- IRR
- —
- Equity multiple
- 23.50×
- Total profit
- $75,594
- Equity at exit
- $1,038
Cash invested: $3,360 (down + closing). Projections, not guarantees.
Landlord ↔ Tenant lean methodology
- Overall (STATE)
- 91 Strongly Landlord-Friendly
- State Idaho
- 91 Strongly Landlord-Friendly · R+18
- County
- — inherits STATE
- City
- — inherits STATE
ZIP-level market 83544
- Home prices YoY
- -18.4%
- Active inventory
- 81
- Price-to-rent
- 1.1×
Monthly cashflow live
- Estimated rent
- $898 medium interval (Pro) →
- Mortgage (P&I)
- −$63
- Tax est. 1.5%
- −$15 /mo · $180/yr
- Insurance
- −$5
- Flood insurance flood zone
- −$66 /mo · $798/yr
- HOA
- −$0
- Vacancy / Maint / Mgmt
- −$189
- Net cashflow
- $560
Break-even live
UW: 25.0% down · 7.5% · 30yr · 1.5% tax · 5.0% vac · 8.0% maint · 8.0% mgmt
Financing live
Cash to close
- Down payment
- $3,000
- Closing costs
- $360
- Reserves months
- —
- Total cash needed
- —
Loan-product check · same deal, 3 products live
Conventional
25% down · 7.5% · 30yr
- Down + closing
- —
- Monthly P&I
- —
- Monthly cashflow
- —
- DSCR
- —
- Eligible?
- —
Personal DTI + credit; lowest rate.
DSCR
20% down · 8.5% · 30yr
- Down + closing
- —
- Monthly P&I
- —
- Monthly cashflow
- —
- DSCR
- —
- Eligible?
- —
No personal income docs; deal must DSCR.
Hard money
10% down · 12.0% · 12mo
- Down + closing
- —
- Monthly P&I
- —
- Monthly cashflow
- —
- DSCR
- —
- Eligible?
- —
Short-term bridge; refi at stabilization.
Listing history 15 events
-
2026-06-17status $12,000 Pending 55 DOM
-
2026-06-17days on market $12,000 Active 55 DOM
-
2026-06-16days on market $12,000 Active 54 DOM
-
2026-06-15days on market $12,000 Active 53 DOM
-
2026-06-13days on market $12,000 Active 51 DOM
-
2026-06-12days on market $12,000 Active 50 DOM
-
2026-06-09days on market $12,000 Active 47 DOM
-
2026-06-08days on market $12,000 Active 46 DOM
-
2026-06-07pricedays on market $12,000 Active 45 DOM
-
2026-06-04days on market $15,000 Active 41 DOM
-
2026-06-02days on market $15,000 Active 40 DOM
-
2026-06-01days on market $15,000 Active 39 DOM
-
2026-05-31days on market $15,000 Active 38 DOM
-
2026-05-31days on market $15,000 Active 37 DOM
-
2026-04-23$15,000 Active
ⓘ Source: listings_history table (triggers on properties + properties_extension) + one-shot
backfill from property_details.listing_events for pre-trigger history.
Climate risk First Street
- Flood 10/10 Extreme FEMA zone X (shaded) · 99% chance over 30 yrs
- Wildfire 6/10 Major
- Heat 5/10 Major 10 d/yr ≥95°F today · 23 d/yr by 30 yrs out
- Wind 1/10 Low
- Air quality 9/10 Extreme 16 unhealthy d/yr today · 18 by 30 yrs out
Nearby sold comps map
Loading sold comps map…
Walkable amenities ~0.75 mi
Loading nearby amenities…
Taxation est. · year 1
- Rental income
- $10,779
- − Mortgage interest
- −$672
- − Property taxes
- −$180
- − Insurance
- −$858
- − Repairs & maintenance
- −$862
- − Management
- −$862
- − Depreciation
- −$349
- Taxable income
- $6,996
- Est. tax owed @ 24.0%
- −$1,679
- After-tax cash flow
- $5,044/yr
For passive investors: Depreciation is non-cash, so a rental often shows a tax loss while cash-flowing — sheltering income. Rental losses are passive: they offset passive income freely, and up to $25,000/yr can offset ordinary (W-2) income if you actively participate and your MAGI is under $100k (phasing out to $0 by $150k); unused losses carry forward. On sale, claimed depreciation is recaptured at up to 25%, and gains may owe capital-gains tax (a 1031 exchange can defer both). Figures are a year-1 estimate at your 24.0% rate — not tax advice; consult a CPA.
Schools (NCES district)
- District
- Orofino Joint District
- NCES district ID
- 1602520
- Math proficiency
- 37% ▼ -4.00%
- Reading proficiency
- 56% ▲ 3.00%
- Median HH income
- $41,114
- Composite
- 38.96/100
- National rank
- #4079
- State rank
- #45 of 92 in ID
Livability — Orofino
- Score
- 76/100
- State rank
- #27
- US rank
- #3806
Category grades
Schools grade is shown separately in the Schools card above.
Census & demographics
- Population (ZIP)
- 6,476
Population outlook (Clearwater County) Hauer SSP2
- Today (2025)
- 8,244 people
- By 2030
- 8,093 · -1.8%
- By 2040
- 7,821 · -5.1%
- By 2050
- 7,740 · -6.1%
- By 2075
- 7,777 · -5.7%
- By 2100
- 6,982 · -15.3%
Race, ethnicity, and origin ACS 2023
- Neighborhood character
- Predominantly White (87%)
- Race & ethnicity
- White 87% Two or more races 7% Hispanic / Latino 5% Asian 1% Native American 1%
- Hispanic origin (detail)
- Mexican 4%
- Common ancestry
- Slovak 4% Lithuanian 3% Portuguese 2%
- Foreign-born
- 3% · Canada
- Languages at home
- 97% English-only · Spanish 2% Tagalog/Filipino 1%
Political lean MEDSL · Clearwater
- 2024 margin
- Solid R (+62.8) · D 17.5% · R 80.3% · Other 2.1%
- 2008→2024 swing
- -28.1pp toward R · 2008: -34.8pp · 2024: -62.8pp
- All cycles
- 2024: R+62.8 2020: R+58.3 2016: R+56.5 2012: R+40.8 2008: R+34.8
Not yet ingested
- Civics
- —
Market trends
- HPI YoY
- ▼ -68.58%
- Current HPI
- 304.5259
- Rent YoY
- —
- Metro
- —
- State GDP YoY
- ▲ 4.51%
- F500 in state
- 6
Industry mix (Fortune 500 HQ in ID)
| Industry | F500 HQs | Revenue |
|---|---|---|
| Retail | 1 | $79B |
|
||
| Technology | 1 | $25B |
|
||
| Food / Agriculture | 1 | $6B |
|
||
Price history
1 event — show timeline
- 2026-04-23 Listed $15,000 IMLS
Cash-flow waterfall
monthlySold comps — $/sqft
last 12 mo · ≤1 miLoading sold comps…