 Triplex
15 12th Ave NW · Rochester, MN
Flood risk 1/10 · Minimal
- FEMA flood zone
- X (unshaded)
- Chance of flooding over 30 yrs
- 0.0%
- Est. flood insurance / yr
- $473 – $860
Fire risk 1/10 · Minimal
- Est. fire insurance / yr
- $888 – $1,650
Heat risk 2/10 · Minimal
- Hot days now (above 98°F)
- 7 days/yr
- Hot days in 30 yrs
- 15 days/yr
Wind risk 2/10 · Minimal
- Chance of severe wind over 30 yrs
- —
Air-quality risk 2/10 · Minimal
- Unhealthy air days now
- 1 days/yr
- Unhealthy air days in 30 yrs
- 1 days/yr
Risk factors via First Street. Map © Google.
Why this score? — see what drove the B grade
The composite is a weighted blend of 9 inputs, each scored 0–100. Each bar is that input's sub-score; the figure is the points it added to the 100-point composite (weight × sub-score).
- Cash flow +30.0/30.0
- 1% rule +10.0/10.0
- DSCR +10.0/10.0
- ARV discount +7.5/15.0
- Livability +4.6/5.0
- Schools +4.1/10.0
- Rent growth +3.0/5.0
- Condition / age +2.5/5.0
- Appreciation +0.0/10.0
$395,900
🖨 Deal sheet 📄 Offer letter ✓ Due diligence
Multi-family units
County records classify this as Multi-Family (2-4 Unit). Listing-text estimate: 3 units. confirmed
Listing remarks
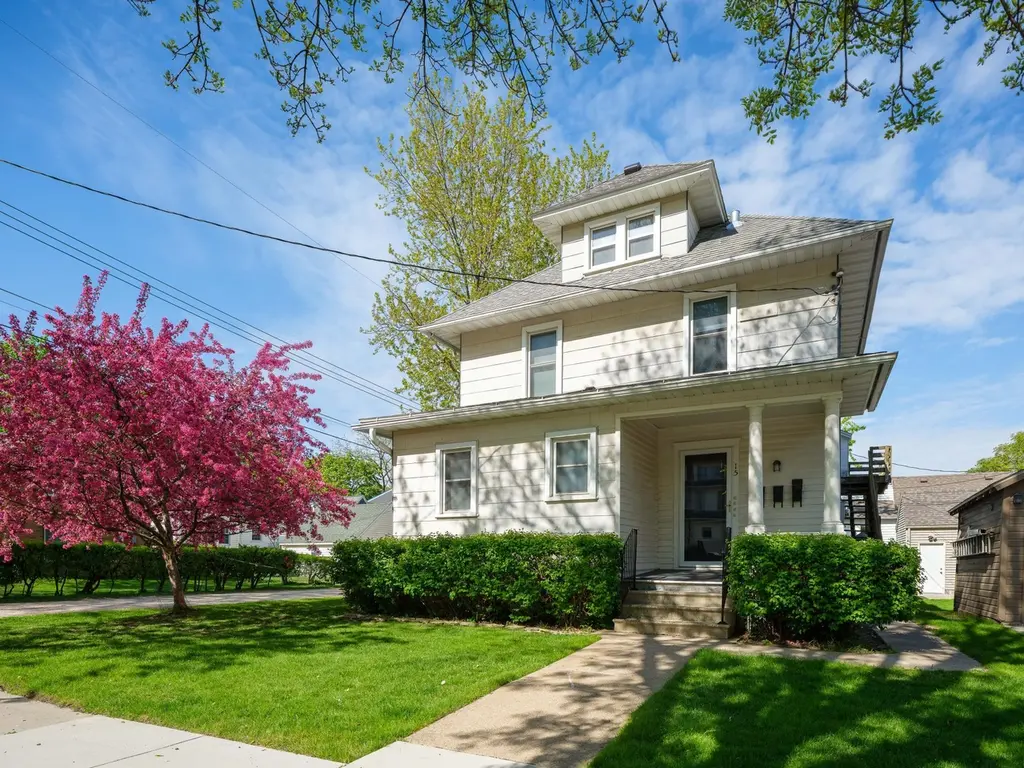
Charming circa-1925 two-story triplex that blends classic early-20th-century proportions with practical multi-family functionality. The light-colored siding, hip roof with a centered dormer, and wide eaves create a balanced, timeless façade, while a covered front porch with simple round columns offers an inviting entrance. Mature shade trees, a neatly trimmed hedge, and a well-kept front lawn provide strong curb appeal, and a side driveway offers off-street parking. Inside, much of the original woodwork, doors, and railings have been preserved, lending the building rich vintage character throughout. The property has been privately managed and meticulously maintained, and tenants have
Key facts
- Covered front porch
- Well-kept front lawn
- Mature shade trees
Tags
Property features AI
Finance
- Other: Tenant responsibilities include cable TV and telephone
- Financial info: Property is a triplex with 3 total units; Gross income reported; Net operating income reported; Owner pays utilities and many property expenses (electricity, gas, heat, insurance, janitorial service, grounds care, repairs, sewer, taxes, trash collection, water)
- HOA & community: Association provides laundry
Exterior
- Parking: Parking lot
- Utilities: City water connected; City sewer connected; Natural gas service; Circuit breaker electrical system
- Home design: Residential income property (triplex); Two levels; Entry level and living area distributed over two stories
- Construction: Frame construction; Asphalt roof (age 8 years or less); Stone foundation
- Exterior features: Public transit within six blocks; City street frontage with curbs, paved streets and sidewalks; Publicly maintained road
Interior
- Kitchen: Each unit equipped with range and refrigerator
- Bedrooms: Total of 4 bedrooms across building
- Bathrooms: Total of 3 bathrooms across building (including full and three-quarter configurations)
- Heating & cooling: Forced air heating; Window air-conditioning units in each unit
- Interior features: Full, unfinished basement with shared access; Window cooling in individual units
- Laundry & utility: Laundry available (association amenity); Laundry area located in basement
Neighborhood map
What this means for you Summary
Snapshot
- This is a 3 × 4-bed/3.0-bath units multifamily listed at $396k.
Deal economics
- At list price, monthly cash flow is $5k ($58k/yr) — positive. Per door: $2k/mo.
- The deal already cash-flows at list — no discount required.
- Meets the 1% rule at list price ($9k rent vs $396k).
- Recommended offer: $390k (1.5% below list) — sets the bar for market timing.
- Cap rate 20.8% vs local median 3.5% in Rochester — top-decile yield for the area; either an underpriced asset or a hidden risk that comps aren't pricing in. Stress-test before assuming the spread holds.
Location & tenants
- Location reads 92/100 on livability (#1 in MN, #27 nationally) — a professional / high-income tenant draw. Strengths: amenities A+, commute A+, employment A+.
- Rochester Public School District (urban): math 40% / reading 51% proficiency, ranked #152 of 301 in MN (top 50%) — families likely to look elsewhere, expect single-tenant / working-renter base with shorter leases.
- Zoned schools: John Marshall Senior High (math 37% / reading 58%, grade D, #162 of 471 statewide, top 35%, 1,573 students, 43% FRL).
- Market conditions: Rents rising (+2.2%/yr); 509 active listings in the ZIP; 16 comparable units currently listed for rent nearby; rentals at typical pace (median 21d on market — plan ~3-4 weeks tenant-placement turnaround); solid renter incomes; 1,267 units permitted in Olmsted County in 2024 (915 in 5+ unit buildings).
- At $9,409/mo this rent would consume 119% of the median local household income ($95k/yr) (locally 1651% of renters already pay >50% of income on rent) — very limited rent-growth headroom before tenants either downsize or default.
Forward outlook
- Local home prices are declining (-3.0%/yr); year-one equity from $3k of loan paydown is wiped out by about $12k of value loss. Plan a longer hold.
- Olmsted County population projected at +16% by 2050 — long-run rental-demand tailwind backs the buy-and-hold thesis.
- At projected returns (-3.0% appreciation + 2.2% rent growth), your $111k cash investment doubles in ~3 years — after that, you're playing with house money.
Negotiation context
- It's been on market 19 days — a 2% lower offer ($390k) is reasonable based on typical stale-listing flexibility.
- Current owner paid $50k; list at $396k implies a 692% gain — meaningful room to come down on a strong offer.
Risks & watch-outs
- Watch-outs: built in 1925 — expect roof / HVAC / electrical / plumbing capex.
Questions for the listing agent
- Can we see the unit-by-unit rent roll, current vacancy, and any below-market leases? What's the average tenancy length?
- What capital expenditures (roof, boiler, parking lot, exteriors) have been made in the last 5 years, and what's planned in the next 2?
- Built in 1925 — when were the roof, HVAC, electrical panel, plumbing, and water heater last replaced?
- Is there a deadline driving the sale (1031 exchange, divorce, estate, relocation)? That informs how much negotiation room exists.
- Schools are A-rated — typically a magnet for longer-tenancy family renters. What's the average tenant stay here, and is there a school-zone premium baked into asking?
- What's the average days-on-market for RENTAL listings here right now (not sales)? A rising rental-DOM trend means longer vacancies and softer asking-rent achievability than the comps imply.
- What's the recent tenant-quality profile in this submarket — average credit score on applications, eviction rate, late-payment / NSF rate, and stable-employment percentage? A property-management company in the area should have these aggregated.
- How much new apartment / multifamily construction is in the pipeline within 1–3 miles? Heavy new supply (>2% of stock underway) typically softens rents 12–24 months out; light construction supports rent growth.
Investment metrics
- 1% rule
- 2.38% ✓
- Cap rate
- 20.82%
- Cash-on-cash
- 51.88%
- DSCR
- 3.31
- GRM
- 3.5
CMA / ARV
No comps found within radius.
Projected returns pro-forma
-3.0% appreciation · 2.18% rent growth · sell at horizon
- IRR
- 48.9%
- Equity multiple
- 3.11×
- Total profit
- $233,478
- Equity at exit
- $59,030
- IRR
- 54.1%
- Equity multiple
- 6.10×
- Total profit
- $565,622
- Equity at exit
- $34,230
Cash invested: $110,852 (down + closing). Projections, not guarantees.
Landlord ↔ Tenant lean methodology
- Overall (STATE)
- 46 Balanced
- State Minnesota
- 46 Balanced · D+2
- County
- — inherits STATE
- City
- — inherits STATE
ZIP-level market 55901
- Home prices YoY
- -33.2%
- Rents YoY
- 2.2%
- Active inventory
- 509
- Price-to-rent
- 10.5×
Monthly cashflow live
- Estimated rent
- $9,409 medium interval (Pro) →
- Mortgage (P&I)
- −$2,076
- Tax from tax record
- −$399 /mo · $4,792/yr
- Insurance
- −$165
- HOA
- −$0
- Vacancy / Maint / Mgmt
- −$1,976
- Net cashflow
- $4,793
Break-even live
3-unit breakdown (identical units grouped — click to expand)
| Units | Beds | Baths | Est. rent |
|---|---|---|---|
| 3× units | 4 | 3 | $9,408 |
| #1 | 4 | 3 | $3,136 |
| #2 | 4 | 3 | $3,136 |
| #3 | 4 | 3 | $3,136 |
| Total (3 units) | $9,409 | ||
UW: 25.0% down · 7.5% · 30yr · 1.5% tax · 5.0% vac · 8.0% maint · 8.0% mgmt
Financing live
Cash to close
- Down payment
- $98,975
- Closing costs
- $11,877
- Reserves months
- —
- Total cash needed
- —
Loan-product check · same deal, 3 products live
Conventional
25% down · 7.5% · 30yr
- Down + closing
- —
- Monthly P&I
- —
- Monthly cashflow
- —
- DSCR
- —
- Eligible?
- —
Personal DTI + credit; lowest rate.
DSCR
20% down · 8.5% · 30yr
- Down + closing
- —
- Monthly P&I
- —
- Monthly cashflow
- —
- DSCR
- —
- Eligible?
- —
No personal income docs; deal must DSCR.
Hard money
10% down · 12.0% · 12mo
- Down + closing
- —
- Monthly P&I
- —
- Monthly cashflow
- —
- DSCR
- —
- Eligible?
- —
Short-term bridge; refi at stabilization.
Rent comps 16 comps
| Address | Beds | Baths | Sqft | Rent | $/sqft | DOM | Units | Dist |
|---|---|---|---|---|---|---|---|---|
| 1429 Center St W Rochester, MN | 3.0 | 1.5 | 1400 | $2,800 | $2.00 | 43d | 1 | 0.17mi |
| 1350 2nd St NW Rochester, MN | 3.0 | 2.0 | 1978 | $2,350 | $1.19 | 21d | 1 | 0.20mi |
| 217 14th Ave SW Rochester, MN | 3.0 | 1.0–2.0 | 1389 | $4,126 | $2.97 | 13d | 35 | 0.23mi |
| 809 1st St NW Rochester, MN | 3.0 | 2.0 | 2030 | $2,400 | $1.18 | 13d | 1 | 0.38mi |
| 619 2nd St NW Unit 2 Rochester, MN | 3.0 | 1.5 | 1435 | $1,575 | $1.10 | 13d | 1 | 0.51mi |
| 950 11th Ave NW Rochester, MN | 2.0–3.0 | 2.0 | 1225 | $1,695 | $1.38 | 13d | 8 | 0.61mi |
| 207 5th Ave SW Rochester, MN | 3.0 | 2.0 | 1500 | $2,100 | $1.40 | 43d | 1 | 0.61mi |
| 700 20th Ave SW Unit 1 Rochester, MN | 4.0 | 3.0 | 2500 | $2,900 | $1.16 | 13d | 1 | 0.79mi |
| 814 7th Ave SW Unit back Rochester, MN | 3.0 | 1.0 | 1400 | $3,000 | $2.14 | 43d | 1 | 0.82mi |
| 801 6th Ave SW Rochester, MN | 3.0 | 2.5 | 2160 | $2,500 | $1.16 | 21d | 1 | 0.82mi |
| 705 1st Ave SW Rochester, MN | 3.0 | 1.0–2.5 | 1135 | $3,875 | $3.41 | 13d | 91 | 1.03mi |
| 917 N Broadway Ave Rochester, MN | 2.0 | 1.0 | 2000 | $1,400 | $0.70 | 43d | 1 | 1.11mi |
| 1321 3rd Ave NW Rochester, MN | 4.0 | 2.0 | 2320 | $2,295 | $0.99 | 13d | 1 | 1.14mi |
| 449 E Center St Rochester, MN | 1.0–3.0 | 1.0–2.0 | 1165 | $3,795 | $3.26 | 13d | 40 | 1.27mi |
| 1441 Salem Rd SW Rochester, MN | 3.0 | 2.0 | 1842 | $2,900 | $1.57 | 43d | 1 | 1.36mi |
| 607 7th Ave SE Rochester, MN | 2.0 | 2.0 | 2614 | $2,300 | $0.88 | 43d | 1 | 1.48mi |
Listing history 4 events
-
2026-05-18historical Contingent - Inspection 1898-char remark
-
2026-05-09$395,900 Active 1898-char remark
-
1988-01-02soldstatus $50,000
-
1987-10-01soldstatus $50,000
ⓘ Source: listings_history table (triggers on properties + properties_extension) + one-shot
backfill from property_details.listing_events for pre-trigger history.
Tax reassessment forecast MN · Partial reset (capped growth)
- Current annual tax
- $4,792 · $399/mo
- Projected year-2 tax
- $4,792 · $399/mo
- Expected delta
- $0/yr ($0/mo · 0.0%)
ⓘ Screening estimate from a state-policy table — verify with the county assessor before closing.
Climate risk First Street
- Flood 1/10 Low FEMA zone X (unshaded) · 0% chance over 30 yrs
- Wildfire 1/10 Low
- Heat 2/10 Low 7 d/yr ≥98°F today · 15 d/yr by 30 yrs out
- Wind 2/10 Low
- Air quality 2/10 Low 1 unhealthy d/yr today · 1 by 30 yrs out
Nearby sold comps map
Loading sold comps map…
Walkable amenities ~0.75 mi
Loading nearby amenities…
Taxation est. · year 1
- Rental income
- $112,908
- − Mortgage interest
- −$22,177
- − Property taxes
- −$4,792
- − Insurance
- −$1,980
- − Repairs & maintenance
- −$9,033
- − Management
- −$9,033
- − Depreciation
- −$11,517
- Taxable income
- $54,378
- Est. tax owed @ 24.0%
- −$13,051
- After-tax cash flow
- $44,461/yr
For passive investors: Depreciation is non-cash, so a rental often shows a tax loss while cash-flowing — sheltering income. Rental losses are passive: they offset passive income freely, and up to $25,000/yr can offset ordinary (W-2) income if you actively participate and your MAGI is under $100k (phasing out to $0 by $150k); unused losses carry forward. On sale, claimed depreciation is recaptured at up to 25%, and gains may owe capital-gains tax (a 1031 exchange can defer both). Figures are a year-1 estimate at your 24.0% rate — not tax advice; consult a CPA.
Schools (NCES district)
- District
- Rochester Public School District
- NCES district ID
- 2731800
- Math proficiency
- 40% ▼ -10.00%
- Reading proficiency
- 51% ▼ -4.00%
- Median HH income
- $66,540
- Composite
- 40.6/100
- National rank
- #3695
- State rank
- #152 of 301 in MN
Livability — Rochester
- Score
- 92/100
- State rank
- #1
- US rank
- #27
Category grades
Schools grade is shown separately in the Schools card above.
Census & demographics
- Census place
- Rochester, MN
- County
- Olmsted County · 135,035 people
- City population
- 135,035
- Metro
- Rochester, MN
- Population (ZIP)
- 58,495
- Household income
- $94,607
- Rent vs Own
- Severe rent burden
- 1651.0
Population outlook (Olmsted County) Hauer SSP2
- Today (2025)
- 165,999 people
- By 2030
- 172,425 · +3.9%
- By 2040
- 183,785 · +10.7%
- By 2050
- 192,981 · +16.3%
- By 2075
- 215,284 · +29.7%
- By 2100
- 224,887 · +35.5%
Race, ethnicity, and origin ACS 2023
- Neighborhood character
- Predominantly White (71%)
- Race & ethnicity
- White 71% Black 12% Asian 8% Two or more races 6% Hispanic / Latino 5%
- Hispanic origin (detail)
- Mexican 3%
- Common ancestry
- Portuguese 11% Romanian 3% Iranian 2%
- Foreign-born
- 15% · Canada, Vietnam, China
- Languages at home
- 81% English-only · Spanish 3% Other Asian/Pacific 3% Arabic 2%
Political lean MEDSL · Olmsted
- 2024 margin
- D (+10.7) · D 54.3% · R 43.6% · Other 2.1%
- 2008→2024 swing
- +7.4pp toward D · 2008: 3.3pp · 2024: 10.7pp
- All cycles
- 2024: D+10.7 2020: D+10.7 2016: D+0.8 2012: D+3.2 2008: D+3.3
Not yet ingested
- Civics
- —
Market trends
- HPI YoY
- ▼ -126.08%
- Current HPI
- 253.7999
- Rent YoY
- ▲ 2.18%
- Metro
- Rochester, MN
- State GDP YoY
- ▲ 2.41%
- F500 in state
- 34
Industry mix (Fortune 500 HQ in MN)
| Industry | F500 HQs | Revenue |
|---|---|---|
| Healthcare | 2 | $407B |
|
||
| Retail | 2 | $150B |
|
||
| Consumer Goods | 2 | $32B |
|
||
| Industrial Machinery | 2 | $6B |
|
||
| Agriculture | 1 | $40B |
|
||
| Healthcare / Medical Devices | 1 | $32B |
|
||
Price history
+691.8% since first listed5 events — show timeline
- 2026-05-28 Pending — NORTHSTARMLS as Distributed by MLS Grid
- 2026-05-18 Contingent — NORTHSTARMLS as Distributed by MLS Grid
- 2026-05-09 Listed $395,900 NORTHSTARMLS as Distributed by MLS Grid
- 1988-01-02 Sold (Public Records) $50,000 Public Records
- 1987-10-01 Sold (Public Records) $50,000 Public Records
Property tax history
+6.8%/yrLatest (2025): $4,792 · +4.9% YoY. Source: county tax records.
Cash-flow waterfall
monthlySold comps — $/sqft
last 12 mo · ≤1 miLoading sold comps…