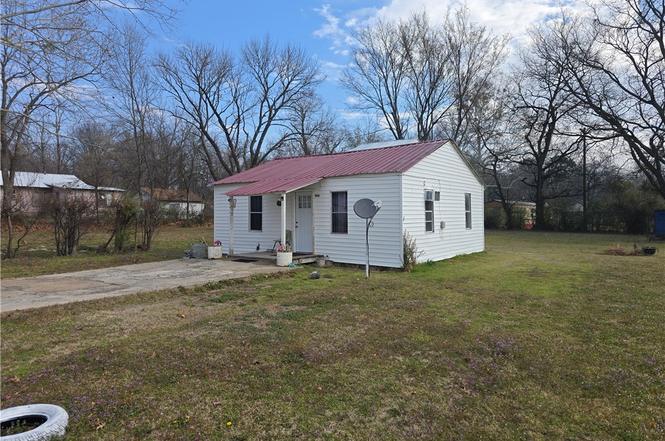
400 Hardy St · Poteau, OK
Flood risk 1/10 · Minimal
- FEMA flood zone
- X (unshaded)
- Chance of flooding over 30 yrs
- 0.0%
- Est. flood insurance / yr
- $507 – $1,088
Fire risk 5/10 · Moderate
- Est. fire insurance / yr
- $2,463 – $4,575
Heat risk 7/10 · Major
- Hot days now (above 114°F)
- 7 days/yr
- Hot days in 30 yrs
- 20 days/yr
Wind risk 2/10 · Minimal
- Chance of severe wind over 30 yrs
- 3.0%
Air-quality risk 2/10 · Minimal
- Unhealthy air days now
- 2 days/yr
- Unhealthy air days in 30 yrs
- 2 days/yr
Risk factors via First Street. Map © Google.
Why this score? — see what drove the B grade
The composite is a weighted blend of 9 inputs, each scored 0–100. Each bar is that input's sub-score; the figure is the points it added to the 100-point composite (weight × sub-score).
- Cash flow +30.0/30.0
- 1% rule +10.0/10.0
- DSCR +10.0/10.0
- ARV discount +7.5/15.0
- Appreciation +7.1/10.0
- Livability +2.9/5.0
- Rent growth +2.5/5.0
- Schools +2.5/10.0
- Condition / age +2.5/5.0
$64,901
🖨 Deal sheet 📄 Offer letter ✓ Due diligence
Listing remarks
Calling all investors! This 3-bed, 1-bath home centrally located in the heart of Poteau and just minutes from shopping, dining, and local conveniences. This is the versatile project you’ve been searching for. The real value lies in the included extra lot, providing a unique double-lot footprint with massive development potential. Whether you choose to renovate the existing home for a steady rental stream or develop the additional lot for a new build, the ROI potential is clear. Sold as-is, this property is priced to move in a competitive market. Secure your next project today!
Key facts
- Extra lot
- Double-lot footprint
- 0.32 acre lot
Tags
Property features AI
Finance
- Other: Tax annual amount reported
Exterior
- Parking: Concrete parking
- Security: Smoke detector(s)
- Utilities: Public water; Public sewer; Electricity available; Cable available; Phone available; Water available; Sewer available
- Home design: Single family residence; Two-story house
- Construction: Vinyl siding; Asphalt/metal/shingle roof
- Exterior features: Covered porch; Partial fencing; Outbuilding
Interior
- Kitchen: Range; Refrigerator
- Flooring: Carpet; Laminate
- Bathrooms: 1 full bathroom
- Heating & cooling: Electric heating; Window cooling units; Ceiling fan(s)
- Interior features: Ceiling fan(s); Blinds
- Laundry & utility: Washer hookup; Electric dryer hookup; Electric water heater
Neighborhood map
What this means for you Summary
Snapshot
- This is a 2-bed/1.0-bath single-family listed at $65k.
Deal economics
- At list price, monthly cash flow is $648 ($8k/yr) — positive.
- The deal already cash-flows at list — no discount required.
- Meets the 1% rule at list price ($1k rent vs $65k).
- Recommended offer: $59k (9.0% below list) — sets the bar for market timing.
- Cap rate 18.3% vs local median 3.8% in Poteau — top-decile yield for the area; either an underpriced asset or a hidden risk that comps aren't pricing in. Stress-test before assuming the spread holds.
Location & tenants
- Location reads 57/100 on livability (#485 in OK) — a working-class tenant base; expect higher turnover. Strengths: cost of living A+, housing A+; Watch: crime D+, amenities F, commute F.
- Poteau (town): math 30% / reading 29% proficiency, ranked #68 of 270 in OK (top 25%) — low school quality limits family demand, transient renter base, plan for 1-2y turnover.
- Zoned schools: Poteau Upper Es (math 45% / reading 36%, grade F, #98 of 845 statewide, top 12%, 471 students, 0% FRL); Poteau Hs (math 22% / reading 32%, grade F, #125 of 447 statewide, top 31%, 636 students, 0% FRL) — zoned schools average 0% FRL vs 54% district-wide (54 pts lower); this property's tenant base skews higher-income than the district average.
- Market conditions: 137 active listings in the ZIP; 73 units permitted in Le Flore County in 2024 (0 in 5+ unit buildings).
Forward outlook
- In year one you build about $3k of equity ($449 loan paydown + $3k appreciation (4.2% local appreciation)).
- Le Flore County population projected at -13% by 2050 — secular population decline; favor cash flow + early exit over multi-decade hold.
- At projected returns (4.2% appreciation + 3.0% rent growth), your $18k cash investment doubles in ~2 years — after that, you're playing with house money.
- By year 10, paydown + projected appreciation supports a ~$31k cash-out refi (75% LTV) — recoverable capital for the next deal without selling this one.
Negotiation context
- It's been on market 99 days — a 9% lower offer ($59k) is reasonable based on typical stale-listing flexibility.
Risks & watch-outs
- Watch-outs: built in 1945 — expect roof / HVAC / electrical / plumbing capex.
- Climate carrying-cost: moderate wildfire risk; extreme-heat days projected 7→20/yr by 2055 (HVAC capex compounding) — expect insurance premiums to compound above CPI over the hold.
Questions for the listing agent
- It's been on market 99 days. Have you received any prior offers? Is the seller open to a 9% concession, seller financing, or rate buy-down credit?
- Built in 1945 — when were the roof, HVAC, electrical panel, plumbing, and water heater last replaced?
- Why hasn't it sold? Are there any deal-killer items the seller is aware of (foundation, flood, title, zoning, code violations)?
- Is there a deadline driving the sale (1031 exchange, divorce, estate, relocation)? That informs how much negotiation room exists.
- Schools are F-rated, which usually means shorter tenancies and higher turnover. Who's the typical renter profile here, and what's been the actual vacancy rate?
- Crime grade is D in this area — have there been break-ins, vandalism, or insurance claims at this property in the last 3 years? What carrier currently insures it and at what premium?
- What's the average days-on-market for RENTAL listings here right now (not sales)? A rising rental-DOM trend means longer vacancies and softer asking-rent achievability than the comps imply.
- What's the recent tenant-quality profile in this submarket — average credit score on applications, eviction rate, late-payment / NSF rate, and stable-employment percentage? A property-management company in the area should have these aggregated.
- How much new for-sale + rental construction is in the pipeline within 1–3 miles? Heavy new supply typically softens prices + rents 12–24 months out; constrained supply supports both.
Investment metrics
- 1% rule
- 2.01% ✓
- Cap rate
- 18.27%
- Cash-on-cash
- 42.78%
- DSCR
- 2.90
- GRM
- 4.2
CMA / ARV
- ARV (on-the-fly)
- $157,680
- Comps found
- 8
Show comp detail 8 sales within ~0.75 mi
| Address | Dist | Beds/Ba | Sqft | Sold | Price | $/sf | Match |
|---|---|---|---|---|---|---|---|
| 207 Pearl St | 0.11mi | 3/2.0 (+1) | 1,108 (-5%) | 1mo | $158,000 | $143 | 77 |
| 304 Pearl St | 0.10mi | 3/2.0 (+1) | 1,160 (-1%) | 12mo | $185,000 | $159 | 76 |
| 702 Hamilton St | 0.35mi | 2/1.0 | 1,166 (-0%) | 15mo | $99,000 | $85 | 71 |
| 603 Oklahoma Ave | 0.22mi | 3/2.0 (+1) | 1,152 (-1%) | 11mo | $108,000 | $94 | 69 |
| 207 Thompson Ave | 0.46mi | 3/2.0 (+1) | 1,164 (-0%) | 7mo | $169,900 | $146 | 63 |
| 604 Oklahoma Ave | 0.23mi | 3/1.0 (+1) | 1,112 (-5%) | 17mo | $125,000 | $112 | 62 |
| 309 N Hill St | 0.46mi | 3/2.0 (+1) | 1,200 (+3%) | 9mo | $115,000 | $96 | 57 |
| 107 N Paul Mathis Dr | 0.67mi | 3/2.0 (+1) | 1,074 (-8%) | 21mo | $145,000 | $135 | 29 |
Match score weights: distance 35% · size 25% · config 20% · recency 20%. Top-matched comps best support the ARV.
Projected returns pro-forma
4.22% appreciation · 3.0% rent growth · sell at horizon
- IRR
- 49.8%
- Equity multiple
- 3.94×
- Total profit
- $53,354
- Equity at exit
- $33,753
- IRR
- 48.3%
- Equity multiple
- 7.99×
- Total profit
- $127,059
- Equity at exit
- $55,892
Cash invested: $18,172 (down + closing). Projections, not guarantees.
Landlord ↔ Tenant lean methodology
- Overall (STATE)
- 83 Strongly Landlord-Friendly
- State Oklahoma
- 83 Strongly Landlord-Friendly · R+20
- County
- — inherits STATE
- City
- — inherits STATE
ZIP-level market 74953
- Home prices YoY
- 1.7%
- Active inventory
- 137
- Price-to-rent
- 4.2×
Monthly cashflow live
- Estimated rent
- $1,302 medium interval (Pro) →
- Mortgage (P&I)
- −$340
- Tax from tax record
- −$13 /mo · $161/yr
- Insurance
- −$27
- HOA
- −$0
- Vacancy / Maint / Mgmt
- −$273
- Net cashflow
- $648
Break-even live
UW: 25.0% down · 7.5% · 30yr · 1.5% tax · 5.0% vac · 8.0% maint · 8.0% mgmt
Financing live
Cash to close
- Down payment
- $16,225
- Closing costs
- $1,947
- Reserves months
- —
- Total cash needed
- —
Loan-product check · same deal, 3 products live
Conventional
25% down · 7.5% · 30yr
- Down + closing
- —
- Monthly P&I
- —
- Monthly cashflow
- —
- DSCR
- —
- Eligible?
- —
Personal DTI + credit; lowest rate.
DSCR
20% down · 8.5% · 30yr
- Down + closing
- —
- Monthly P&I
- —
- Monthly cashflow
- —
- DSCR
- —
- Eligible?
- —
No personal income docs; deal must DSCR.
Hard money
10% down · 12.0% · 12mo
- Down + closing
- —
- Monthly P&I
- —
- Monthly cashflow
- —
- DSCR
- —
- Eligible?
- —
Short-term bridge; refi at stabilization.
Listing history 15 events
-
2026-06-18days on market $64,901 Active 99 DOM
-
2026-06-17days on market $64,901 Active 98 DOM
-
2026-06-16days on market $64,901 Active 97 DOM
-
2026-06-15days on market $64,901 Active 96 DOM
-
2026-06-13days on market $64,901 Active 94 DOM
-
2026-06-12days on market $64,901 Active 93 DOM
-
2026-06-09days on market $64,901 Active 90 DOM
-
2026-06-08days on market $64,901 Active 89 DOM
-
2026-06-08days on market $64,901 Active 88 DOM
-
2026-06-07days on market $64,901 Active 87 DOM
-
2026-06-04days on market $64,901 Active 84 DOM
-
2026-06-02days on market $64,901 Active 83 DOM
-
2026-06-01days on market $64,901 Active 82 DOM
-
2026-05-31days on market $64,901 Active 81 DOM
-
2026-03-05$64,901 Active
ⓘ Source: listings_history table (triggers on properties + properties_extension) + one-shot
backfill from property_details.listing_events for pre-trigger history.
Tax reassessment forecast OK · Resets to sale price
- Current annual tax
- $161 · $13/mo
- Projected year-2 tax
- $584 · $49/mo
- Expected delta
- +$423/yr (+$35/mo · 262.8%)
ⓘ Screening estimate from a state-policy table — verify with the county assessor before closing.
Climate risk First Street
- Flood 1/10 Low FEMA zone X (unshaded) · 0% chance over 30 yrs
- Wildfire 5/10 Major
- Heat 7/10 Severe 7 d/yr ≥114°F today · 20 d/yr by 30 yrs out
- Wind 2/10 Low 3% chance of damaging wind over 30 yrs
- Air quality 2/10 Low 2 unhealthy d/yr today · 2 by 30 yrs out
Nearby sold comps map
Loading sold comps map…
Walkable amenities ~0.75 mi
Loading nearby amenities…
Taxation est. · year 1
- Rental income
- $15,625
- − Mortgage interest
- −$3,635
- − Property taxes
- −$161
- − Insurance
- −$325
- − Repairs & maintenance
- −$1,250
- − Management
- −$1,250
- − Depreciation
- −$1,888
- Taxable income
- $7,116
- Est. tax owed @ 24.0%
- −$1,708
- After-tax cash flow
- $6,066/yr
For passive investors: Depreciation is non-cash, so a rental often shows a tax loss while cash-flowing — sheltering income. Rental losses are passive: they offset passive income freely, and up to $25,000/yr can offset ordinary (W-2) income if you actively participate and your MAGI is under $100k (phasing out to $0 by $150k); unused losses carry forward. On sale, claimed depreciation is recaptured at up to 25%, and gains may owe capital-gains tax (a 1031 exchange can defer both). Figures are a year-1 estimate at your 24.0% rate — not tax advice; consult a CPA.
Schools (NCES district)
- District
- Poteau
- NCES district ID
- 4024870
- Math proficiency
- 30% ▼ -4.00%
- Reading proficiency
- 29% ▼ -4.00%
- Median HH income
- $42,165
- Composite
- 25.05/100
- National rank
- #7546
- State rank
- #68 of 270 in OK
Livability — Poteau
- Score
- 57/100
- State rank
- #485
- US rank
- #22172
Category grades
Schools grade is shown separately in the Schools card above.
Census & demographics
- Census place
- Poteau, OK
- Population (ZIP)
- 12,284
Population outlook (Le Flore County) Hauer SSP2
- Today (2025)
- 48,504 people
- By 2030
- 47,474 · -2.1%
- By 2040
- 44,914 · -7.4%
- By 2050
- 42,239 · -12.9%
- By 2075
- 35,071 · -27.7%
- By 2100
- 25,949 · -46.5%
Race, ethnicity, and origin ACS 2023
- Neighborhood character
- Predominantly White (70%)
- Race & ethnicity
- White 70% Hispanic / Latino 12% Native American 10% Two or more races 10% Black 1%
- Hispanic origin (detail)
- Mexican 11%
- Common ancestry
- Slovak 2% Iranian 2% Serbian 1%
- Foreign-born
- 7% · Canada
- Languages at home
- 90% English-only · Spanish 10%
Political lean MEDSL · Le Flore
- 2024 margin
- Solid R (+64.8) · D 17.0% · R 81.8% · Other 1.3%
- 2008→2024 swing
- -26.1pp toward R · 2008: -38.6pp · 2024: -64.8pp
- All cycles
- 2024: R+64.8 2020: R+63.4 2016: R+58.7 2012: R+41.1 2008: R+38.6
Not yet ingested
- Civics
- —
Market trends
- HPI YoY
- ▲ 4.22%
- Current HPI
- 252.3937
- Rent YoY
- —
- Metro
- —
- State GDP YoY
- ▲ 1.55%
- F500 in state
- 6
Industry mix (Fortune 500 HQ in OK)
| Industry | F500 HQs | Revenue |
|---|---|---|
| Energy | 3 | $48B |
|
||
Price history
1 event — show timeline
- 2026-03-05 Listed $64,901 WRVBOR
Property tax history
+3.4%/yrLatest (2025): $161 · +5.2% YoY. Source: county tax records.
Cash-flow waterfall
monthlySold comps — $/sqft
last 12 mo · ≤1 miLoading sold comps…