35011 Starboard Dr · Long Neck, DE
Flood risk 9/10 · Severe
- FEMA flood zone
- AE
- Chance of flooding over 30 yrs
- 0.99%
- Est. flood insurance / yr
- $2,026 – $9,024
Fire risk 3/10 · Minor
- Est. fire insurance / yr
- $476 – $884
Heat risk 8/10 · Major
- Hot days now (above 100°F)
- 7 days/yr
- Hot days in 30 yrs
- 18 days/yr
Wind risk 8/10 · Major
- Chance of severe wind over 30 yrs
- 80.0%
Air-quality risk 2/10 · Minimal
- Unhealthy air days now
- 1 days/yr
- Unhealthy air days in 30 yrs
- 1 days/yr
Risk factors via First Street. Map © Google.
Why this score? — see what drove the B- grade
The composite is a weighted blend of 9 inputs, each scored 0–100. Each bar is that input's sub-score; the figure is the points it added to the 100-point composite (weight × sub-score).
- Cash flow +30.0/30.0
- 1% rule +10.0/10.0
- DSCR +10.0/10.0
- ARV discount +4.0/15.0
- Livability +3.5/5.0
- Schools +2.9/10.0
- Rent growth +2.5/5.0
- Condition / age +2.5/5.0
- Appreciation +0.0/10.0
$99,000
🖨 Deal sheet (PDF) 📄 Offer letter ✓ Due diligence
Listing remarks
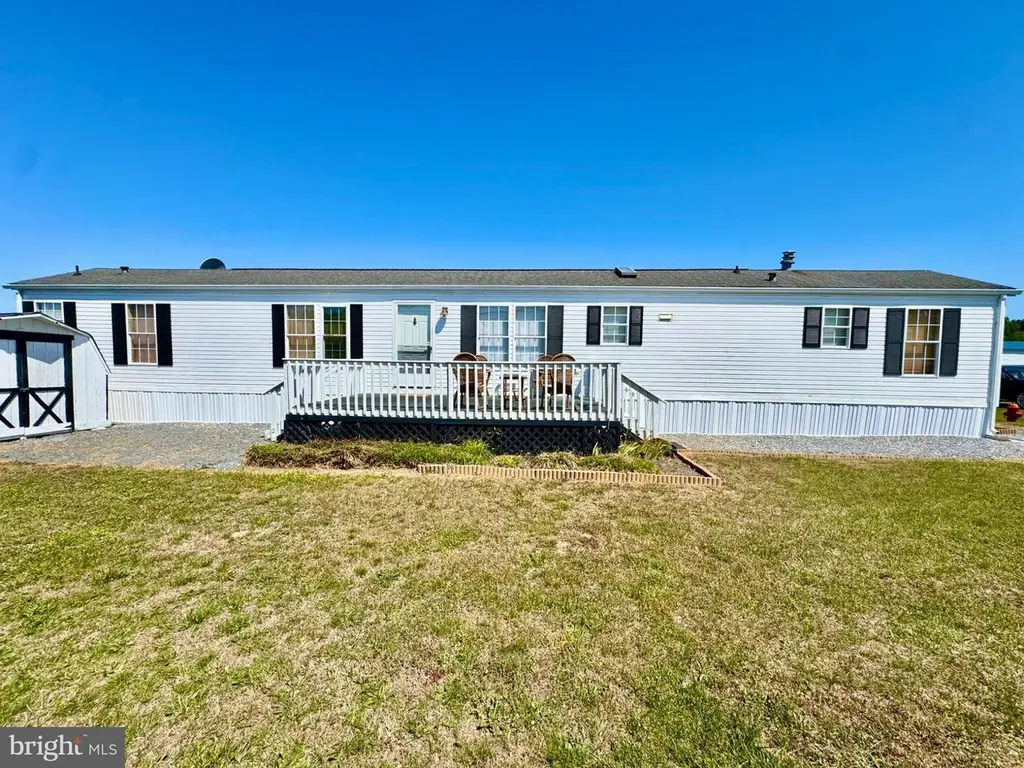
Welcome to your next Beach Retreat, a Turnkey 2-Bedroom Bungalow. Experience the coastal lifestyle in this bright and airy bungalow, perfectly situated in a vibrant waterfront community. Designed for relaxation and effortless entertaining, this home is being sold fully furnished and turnkey, making it ready for you to enjoy the very first day of summer. The Living area is Open & Airy Living. The living area features an open-concept floor plan and is flooded with natural light, seamlessly connecting the living spaces. The Home features brand-new luxury vinyl plank (LVP) flooring throughout the main living areas providing a modern, durable finish. The Siding and skirting on the front o
Key facts
- 4 parking spots
- Community pool
- Built 1995
Property features AI
Finance
- Other: Property manager present; Federal flood zone: AE
- Financial info: Land lease monthly payment (approximately $569.78); 1 year remaining on land lease
- HOA & community: Community amenities include beach access, common grounds, community center, gated community, marina/marina club, picnic area, pier/dock, outdoor pool, tot lots/playground, and water/lake privileges; Property located in Rehoboth Shores
Exterior
- Parking: Gravel driveway; Driveway parking with 4 spaces (total 4 garage/parking spaces listed)
- Utilities: Public water; Public sewer; Propane hot water; Propane leased heating; No municipal trash service
- Home design: Manufactured / modular home; Single wide mobile home (14' x 76'); Land lease community (land lease monthly); Good property condition; Building not winterized
- Construction: Modular/manufactured construction; Pillar/post/pier foundation; Architectural shingle roof; Estimated year built
- Exterior features: Cleared lot; Deck(s); Shed; Water access to a creek (fishing allowed, canoe/kayak); Navigable water nearby
Interior
- Kitchen: Dishwasher; Microwave; Electric range/oven; Range hood; Refrigerator
- Bedrooms: 2 bedrooms on the main level (entry level bedrooms)
- Flooring: Carpet; Luxury vinyl plank
- Bathrooms: 2 full bathrooms (main level)
- Heating & cooling: Central heating (forced air); Propane (leased) heating fuel; Central air conditioning (electric)
- Interior features: Open floor plan; Combination dining/living areas; Combination kitchen/dining and kitchen/living; Breakfast area; Dining area; Country-style kitchen with table space; Master bathroom; Tub/shower; Ceiling fans; Window treatments; Furnished
- Laundry & utility: Washer; Dryer; Main-floor laundry; Water heater
Neighborhood map
What this means for you Summary
Snapshot
- This is a 2-bed/2.0-bath manufactured listed at $99k.
Deal economics
- At list price, monthly cash flow is $391 ($5k/yr) — positive.
- The deal already cash-flows at list — no discount required.
- Meets the 1% rule at list price ($2k rent vs $99k).
- Recommended offer: $96k (3.0% below list) — sets the bar for market timing.
- Cap rate 16.6% vs local median 3.4% in Long Neck — top-decile yield for the area; either an underpriced asset or a hidden risk that comps aren't pricing in. Stress-test before assuming the spread holds.
Location & tenants
- Location reads 69/100 on livability (#30 in DE) — a middle-class / working-renter tenant base. Strengths: cost of living A+, housing A+, crime A-; Watch: employment D+, amenities F, commute F.
- Indian River School District (rural): math 25% / reading 41% proficiency, ranked #14 of 26 in DE (top 54%) — families likely to look elsewhere, expect single-tenant / working-renter base with shorter leases.
- Zoned schools: Long Neck Elementary School (math 22% / reading 35%, grade F, #57 of 105 statewide, top 55%, 693 students, 0% FRL); Millsboro Middle School (math 24% / reading 42%, grade F, #14 of 36 statewide, top 37%, 771 students, 0% FRL); Sussex Central High School (math 23% / reading 42%, grade F, #24 of 40 statewide, top 59%, 2,039 students, 0% FRL) — zoned schools average 0% FRL vs 49% district-wide (49 pts lower); this property's tenant base skews higher-income than the district average.
- Market conditions: 870 active listings in the ZIP; 2 comparable units currently listed for rent nearby; solid renter incomes; 4,354 units permitted in Sussex County in 2024 (344 in 5+ unit buildings).
Forward outlook
- Local home prices are declining (-3.0%/yr); year-one equity from $684 of loan paydown is wiped out by about $3k of value loss. Plan a longer hold.
- Sussex County population projected at +25% by 2050 — long-run rental-demand tailwind backs the buy-and-hold thesis.
- At projected returns (-3.0% appreciation + 3.0% rent growth), your $28k cash investment doubles in ~7 years — after that, you're playing with house money.
Negotiation context
- It's been on market 47 days — a 3% lower offer ($96k) is reasonable based on typical stale-listing flexibility.
- 4 sale attempts since 5y ago with the ask held roughly flat each time — persistent listings suggest the price (not the market) is what's stuck; bring a comps-based counter.
- Current owner paid $53k; list at $99k implies a 87% gain — meaningful room to come down on a strong offer.
Risks & watch-outs
- Watch-outs: flood insurance adds $460/mo.
- Climate carrying-cost: in FEMA flood zone AE (mandatory federal flood insurance); severe wind risk, 80% chance of damaging wind over 30y; extreme-heat days projected 7→18/yr by 2055 (HVAC capex compounding) — expect insurance premiums to compound above CPI over the hold.
Questions for the listing agent
- It's been on market 47 days. Have you received any prior offers? Is the seller open to a 3% concession, seller financing, or rate buy-down credit?
- What's the actual annual flood-insurance premium (NFIP or private), and is the property in a SFHA with mandatory coverage?
- Is there a deadline driving the sale (1031 exchange, divorce, estate, relocation)? That informs how much negotiation room exists.
- Schools are F-rated, which usually means shorter tenancies and higher turnover. Who's the typical renter profile here, and what's been the actual vacancy rate?
- What's the average days-on-market for RENTAL listings here right now (not sales)? A rising rental-DOM trend means longer vacancies and softer asking-rent achievability than the comps imply.
- What's the recent tenant-quality profile in this submarket — average credit score on applications, eviction rate, late-payment / NSF rate, and stable-employment percentage? A property-management company in the area should have these aggregated.
- How much new for-sale + rental construction is in the pipeline within 1–3 miles? Heavy new supply typically softens prices + rents 12–24 months out; constrained supply supports both.
Investment metrics
- 1% rule
- 1.96% ✓
- Cap rate
- 16.61%
- Cash-on-cash
- 36.86%
- DSCR
- 2.64
- GRM
- 4.2
CMA / ARV
- ARV (median comp)
- $91,819
- List price
- $99,000
- Delta
- 7.82%
- Verdict
- FAIR
- Comps
- 20 within 1.0 mi
Show comp detail 1 sale within ~0.75 mi
| Address | Dist | Beds/Ba | Sqft | Sold | Price | $/sf | Match |
|---|---|---|---|---|---|---|---|
| 34587 Scarp St #17051 | 0.58mi | 3/2.0 (+1) | 924 (-13%) | 20mo | $120,000 | $130 | 30 |
Match score weights: distance 35% · size 25% · config 20% · recency 20%. Top-matched comps best support the ARV.
Projected returns pro-forma
-3.0% appreciation · 3.0% rent growth · sell at horizon
- IRR
- 8.4%
- Equity multiple
- 1.33×
- Total profit
- $9,174
- Equity at exit
- $14,761
- IRR
- 17.8%
- Equity multiple
- 2.49×
- Total profit
- $41,324
- Equity at exit
- $8,560
Cash invested: $27,720 (down + closing). Projections, not guarantees.
Landlord ↔ Tenant lean methodology
- Overall (STATE)
- 70 Landlord-Friendly
- State Delaware
- 70 Landlord-Friendly · D+7
- County
- — inherits STATE
- City
- — inherits STATE
ZIP-level market 19966
- Home prices YoY
- -6.4%
- Active inventory
- 870
- Price-to-rent
- 4.2×
Monthly cashflow live
- Estimated rent
- $1,944 medium interval (Pro) →
- Mortgage (P&I)
- −$519
- Tax est. 1.5%
- −$124 /mo · $1,485/yr
- Insurance
- −$41
- Flood insurance flood zone
- −$460 /mo · $5,525/yr
- HOA
- −$0
- Vacancy / Maint / Mgmt
- −$408
- Net cashflow
- $391
Break-even live
Sensitivity live
| Price | -10% $459 | -5% $425 | +0% $391 | +5% $357 | +10% $323 |
|---|---|---|---|---|---|
| Rent | -10% $237 | -5% $314 | +0% $391 | +5% $468 | +10% $545 |
| Rate | -1.0pp $441 | -0.5pp $416 | base $391 | +0.5pp $365 | +1.0pp $339 |
UW: 25.0% down · 7.5% · 30yr · 1.5% tax · 5.0% vac · 8.0% maint · 8.0% mgmt
Financing live
Cash to close
- Down payment
- $24,750
- Closing costs
- $2,970
- Reserves months
- —
- Total cash needed
- —
Loan-product check · same deal, 3 products live
Conventional
25% down · 7.5% · 30yr
- Down + closing
- —
- Monthly P&I
- —
- Monthly cashflow
- —
- DSCR
- —
- Eligible?
- —
Personal DTI + credit; lowest rate.
DSCR
20% down · 8.5% · 30yr
- Down + closing
- —
- Monthly P&I
- —
- Monthly cashflow
- —
- DSCR
- —
- Eligible?
- —
No personal income docs; deal must DSCR.
Hard money
10% down · 12.0% · 12mo
- Down + closing
- —
- Monthly P&I
- —
- Monthly cashflow
- —
- DSCR
- —
- Eligible?
- —
Short-term bridge; refi at stabilization.
Rent comps 2 comps
| Address | Beds | Baths | Sqft | Rent | $/sqft | DOM | Units | Dist |
|---|---|---|---|---|---|---|---|---|
| 35829 S Gloucester Cir Unit 35829 Long Neck, DE | 3.0 | 2.5 | 1500 | $1,995 | $1.33 | 15d | 1 | 0.89mi |
| 22392 Circle Rd , DE | 2.0 | 1.0 | 1000 | $1,523 | $1.52 | 15d | 1 | 1.35mi |
Listing history 24 events
-
2026-06-21days on market $99,000 Active 47 DOM
-
2026-06-18days on market $99,000 Active 44 DOM
-
2026-06-17days on market $99,000 Active 43 DOM
-
2026-06-16days on market $99,000 Active 42 DOM
-
2026-06-15days on market $99,000 Active 41 DOM
-
2026-06-14days on market $99,000 Active 39 DOM
-
2026-06-13days on market $99,000 Active 38 DOM
-
2026-06-10days on market $99,000 Active 36 DOM
-
2026-06-09days on market $99,000 Active 35 DOM
-
2026-06-08days on market $99,000 Active 34 DOM
-
2026-06-07days on market $99,000 Active 33 DOM
-
2026-06-02days on market $99,000 Active 28 DOM
-
2026-06-01days on market $99,000 Active 27 DOM
-
2026-05-31days on market $99,000 Active 26 DOM
-
2026-05-30days on market $99,000 Active 25 DOM
-
2026-05-06$99,000 Active 1697-char remark
-
2026-05-05historical $99,000 1697-char remark
-
2026-04-24historical
-
2025-11-03$99,000 Active
-
2024-03-01historical
-
2023-11-07$99,900 Active
-
2021-12-17soldstatus $52,900 Closed
-
2021-12-02status Pending
-
2021-11-18$52,900 Active
ⓘ Source: listings_history table (triggers on properties + properties_extension) + one-shot
backfill from property_details.listing_events for pre-trigger history.
Climate risk First Street
- Flood 9/10 Extreme FEMA zone AE · 99% chance over 30 yrs
- Wildfire 3/10 Moderate
- Heat 8/10 Severe 7 d/yr ≥100°F today · 18 d/yr by 30 yrs out
- Wind 8/10 Severe 80% chance of damaging wind over 30 yrs
- Air quality 2/10 Low 1 unhealthy d/yr today · 1 by 30 yrs out
Nearby sold comps map
Loading sold comps map…
Walkable amenities ~0.75 mi
Loading nearby amenities…
Taxation est. · year 1
- Rental income
- $23,325
- − Mortgage interest
- −$5,546
- − Property taxes
- −$1,485
- − Insurance
- −$6,020
- − Repairs & maintenance
- −$1,866
- − Management
- −$1,866
- − Depreciation
- −$2,880
- Taxable income
- $3,663
- Est. tax owed @ 24.0%
- −$879
- After-tax cash flow
- $3,813/yr
For passive investors: Depreciation is non-cash, so a rental often shows a tax loss while cash-flowing — sheltering income. Rental losses are passive: they offset passive income freely, and up to $25,000/yr can offset ordinary (W-2) income if you actively participate and your MAGI is under $100k (phasing out to $0 by $150k); unused losses carry forward. On sale, claimed depreciation is recaptured at up to 25%, and gains may owe capital-gains tax (a 1031 exchange can defer both). Figures are a year-1 estimate at your 24.0% rate — not tax advice; consult a CPA.
Schools (NCES district)
- District
- Indian River School District
- NCES district ID
- 1000680
- Math proficiency
- 25% ▼ -27.00%
- Reading proficiency
- 41% ▼ -17.00%
- Median HH income
- $53,838
- Composite
- 28.99/100
- National rank
- #6620
- State rank
- #14 of 26 in DE
Livability — Long Neck
- Score
- 69/100
- State rank
- #30
- US rank
- #8720
Category grades
Schools grade is shown separately in the Schools card above.
Census & demographics
- County
- Sussex County · 82,708 people
- Metro
- Salisbury, MD-DE
- Population (ZIP)
- 35,884
- Household income
- $78,305
- Rent vs Own
- Severe rent burden
- 464.0
Population outlook (Sussex County) Hauer SSP2
- Today (2025)
- 248,853 people
- By 2030
- 264,464 · +6.3%
- By 2040
- 290,980 · +16.9%
- By 2050
- 311,259 · +25.1%
- By 2075
- 352,488 · +41.6%
- By 2100
- 367,406 · +47.6%
Race, ethnicity, and origin ACS 2023
- Neighborhood character
- Predominantly White (74%)
- Race & ethnicity
- White 74% Hispanic / Latino 11% Black 8% Two or more races 7% Native American 3% Asian 1%
- Hispanic origin (detail)
- Mexican 3%
- Common ancestry
- Romanian 4% Slovak 2% Serbian 1%
- Foreign-born
- 8% · Canada, China
- Languages at home
- 88% English-only · Spanish 9% Other Indo-European 1%
Political lean MEDSL · Sussex
- 2024 margin
- R (+11.0) · D 43.9% · R 54.9% · Other 1.2%
- 2008→2024 swing
- -2.4pp toward R · 2008: -8.6pp · 2024: -11.0pp
- All cycles
- 2024: R+11.0 2020: R+11.2 2016: R+22.0 2012: R+13.0 2008: R+8.6
Not yet ingested
- Civics
- —
Market trends
- HPI YoY
- ▼ -18.26%
- Current HPI
- 268.5609
- Rent YoY
- —
- Metro
- Salisbury, MD-DE
- State GDP YoY
- —
- F500 in state
- 0
Price history
+87.1% since first listed9 events — show timeline
- 2026-05-06 Listed $99,000 BRIGHT MLS
- 2026-05-05 Coming Soon $99,000 BRIGHT MLS
- 2026-04-24 Listing Removed — BRIGHT MLS
- 2025-11-03 Listed $99,000 BRIGHT MLS
- 2024-03-01 Listing Removed — BRIGHT MLS
- 2023-11-07 Listed $99,900 BRIGHT MLS
- 2021-12-17 Sold (MLS) $52,900 BRIGHT MLS
- 2021-12-02 Pending — BRIGHT MLS
- 2021-11-18 Listed $52,900 BRIGHT MLS
Property tax history
-4.6%/yrLatest (2025): $192 · -41.4% YoY. Source: county tax records.
Cash-flow waterfall
monthlySold comps — $/sqft
last 12 mo · ≤1 miLoading sold comps…