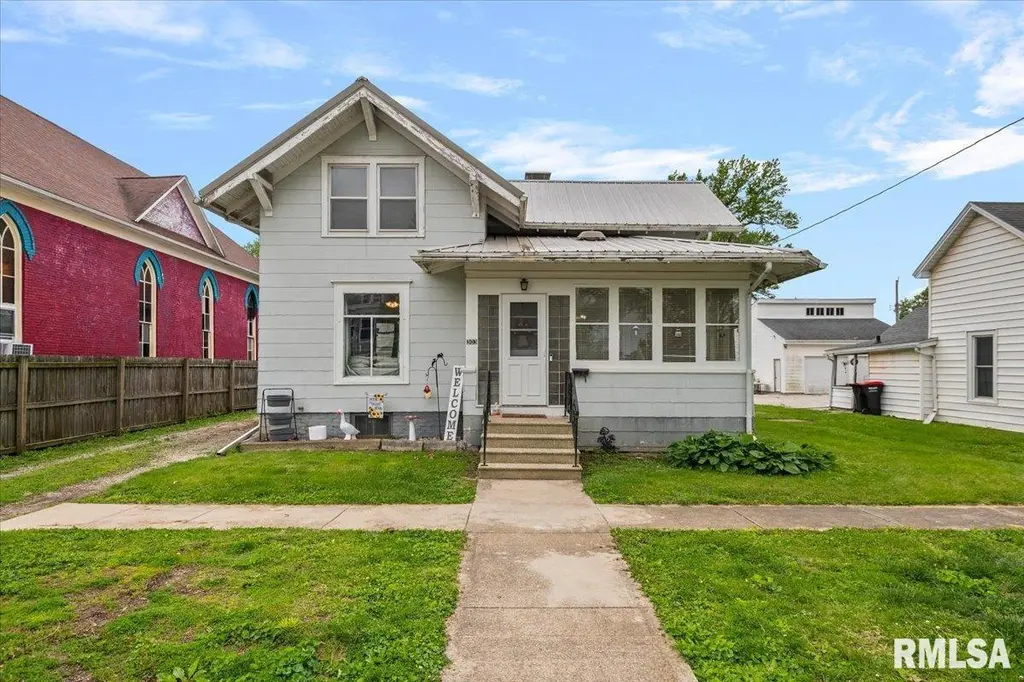
303 W 2nd St · Assumption, IL
Flood risk 1/10 · Minimal
- FEMA flood zone
- X (unshaded)
- Chance of flooding over 30 yrs
- 0.0%
- Est. flood insurance / yr
- $473 – $860
Fire risk 1/10 · Minimal
- Est. fire insurance / yr
- $804 – $1,492
Heat risk 4/10 · Minor
- Hot days now (above 105°F)
- 7 days/yr
- Hot days in 30 yrs
- 20 days/yr
Wind risk 2/10 · Minimal
- Chance of severe wind over 30 yrs
- 2.0%
Air-quality risk 2/10 · Minimal
- Unhealthy air days now
- 1 days/yr
- Unhealthy air days in 30 yrs
- 2 days/yr
Risk factors via First Street. Map © Google.
Why this score? — see what drove the B- grade
The composite is a weighted blend of 9 inputs, each scored 0–100. Each bar is that input's sub-score; the figure is the points it added to the 100-point composite (weight × sub-score).
- Cash flow +21.4/30.0
- ARV discount +15.0/15.0
- Appreciation +7.0/10.0
- DSCR +6.8/10.0
- 1% rule +6.0/10.0
- Livability +3.2/5.0
- Rent growth +2.5/5.0
- Condition / age +2.5/5.0
- Schools +1.5/10.0
$74,900
🖨 Deal sheet (PDF) 📄 Offer letter ✓ Due diligence
Listing remarks
Step into a charming and inviting fixer-upper full of character! This home offers great potential with beautiful green kitchen cabinets, flexible living spaces, and plenty of opportunity to make it your own. The bonus room could serve as a home office, family room, playroom, or hobby space, giving buyers plenty of options to fit their lifestyle. Featuring 2 bedrooms upstairs and a 3rd bedroom on the main level, plus a full bath on the main floor, this home is ready for the right buyer to appreciate its charm and personality.
Key facts
- Bonus room
- Home office
- 7,995 sq ft lot
Tags
Property features AI
Exterior
- Parking: Detached garage (1 car); On-street parking available; Gravel parking surfaces
- Utilities: Shared well; Public sewer
- Home design: Single-family residence; Two levels (built 1895); Residential zoning
- Construction: Metal roof; Built in 1895; Full, unfinished basement
- Exterior features: Level lot; Lot dimensions approximately 53.3 x 150; Road surface: Other; Metal roof
Interior
- Kitchen: Dishwasher
- Bedrooms: Three bedrooms (two upper-level bedrooms, one main-level bedroom); Upper-level bedrooms have egress windows
- Flooring: Carpet in primary living areas and bedrooms; Other flooring in kitchen, bonus room and sunroom
- Bathrooms: One full bathroom
- Heating & cooling: Window air conditioning units; Gas water heating
- Interior features: Ceiling fans
- Laundry & utility: Gas water heater
Neighborhood map
What this means for you Summary
Snapshot
- This is a 4-bed/2.0-bath single-family listed at $75k.
Deal economics
- At list price, monthly cash flow is $111 ($1k/yr) — positive.
- The deal already cash-flows at list — no discount required.
- Meets the 1% rule at list price ($828 rent vs $75k).
- Recommended offer: $73k (3.0% below list) — sets the bar for market timing.
Location & tenants
- Location reads 64/100 on livability (#717 in IL) — a middle-class / working-renter tenant base. Strengths: crime A+, cost of living A+, housing A+; Watch: employment D, schools F, amenities F.
- Central A & M CUD 21 (rural): math 13% / reading 20% proficiency, ranked #477 of 620 in IL (top 77%) — low school quality limits family demand, transient renter base, plan for 1-2y turnover.
- Market conditions: 22 active listings in the ZIP; 26 units permitted in Christian County in 2024 (0 in 5+ unit buildings).
Forward outlook
- In year one you build about $4k of equity ($518 loan paydown + $3k appreciation (4.0% local appreciation)).
- Christian County population projected at -24% by 2050 — secular population decline; favor cash flow + early exit over multi-decade hold.
- At projected returns (4.0% appreciation + 3.0% rent growth), your $21k cash investment doubles in ~4 years — after that, you're playing with house money.
- By year 9, paydown + projected appreciation supports a ~$30k cash-out refi (75% LTV) — recoverable capital for the next deal without selling this one.
Negotiation context
- It's been on market 39 days — a 3% lower offer ($73k) is reasonable based on typical stale-listing flexibility.
- Current owner paid $50k; 50% above their basis — modest negotiation headroom, anchor on the comps not their cost.
Risks & watch-outs
- Watch-outs: built in 1895 — expect roof / HVAC / electrical / plumbing capex.
Questions for the listing agent
- It's been on market 39 days. Have you received any prior offers? Is the seller open to a 3% concession, seller financing, or rate buy-down credit?
- Built in 1895 — when were the roof, HVAC, electrical panel, plumbing, and water heater last replaced?
- Is there a deadline driving the sale (1031 exchange, divorce, estate, relocation)? That informs how much negotiation room exists.
- Schools are F-rated, which usually means shorter tenancies and higher turnover. Who's the typical renter profile here, and what's been the actual vacancy rate?
- What's the average days-on-market for RENTAL listings here right now (not sales)? A rising rental-DOM trend means longer vacancies and softer asking-rent achievability than the comps imply.
- What's the recent tenant-quality profile in this submarket — average credit score on applications, eviction rate, late-payment / NSF rate, and stable-employment percentage? A property-management company in the area should have these aggregated.
- How much new for-sale + rental construction is in the pipeline within 1–3 miles? Heavy new supply typically softens prices + rents 12–24 months out; constrained supply supports both.
Investment metrics
- 1% rule
- 1.10% ✓
- Cap rate
- 8.08%
- Cash-on-cash
- 6.37%
- DSCR
- 1.28
- GRM
- 7.5
CMA / ARV
- ARV (median comp)
- $90,534
- List price
- $74,900
- Delta
- -17.27%
- Verdict
- UNDERPRICED
- Comps
- 20 within 1.0 mi
Show comp detail 1 sale within ~0.75 mi
| Address | Dist | Beds/Ba | Sqft | Sold | Price | $/sf | Match |
|---|---|---|---|---|---|---|---|
| 116 S Saint John St | 0.07mi | 3/2.0 (-1) | 946 (-5%) | 5mo | $95,000 | $100 | 79 |
Match score weights: distance 35% · size 25% · config 20% · recency 20%. Top-matched comps best support the ARV.
Projected returns pro-forma
4.0% appreciation · 3.0% rent growth · sell at horizon
- IRR
- 16.0%
- Equity multiple
- 1.96×
- Total profit
- $20,188
- Equity at exit
- $37,980
- IRR
- 16.9%
- Equity multiple
- 3.73×
- Total profit
- $57,188
- Equity at exit
- $62,123
Cash invested: $20,972 (down + closing). Projections, not guarantees.
Landlord ↔ Tenant lean methodology
- Overall (STATE)
- 43 Moderately Tenant-Leaning
- State Illinois
- 43 Moderately Tenant-Leaning · D+7
- County
- — inherits STATE
- City
- — inherits STATE
ZIP-level market 62510
- Home prices YoY
- 2.4%
- Active inventory
- 22
- Price-to-rent
- 7.5×
Monthly cashflow live
- Estimated rent
- $828 medium interval (Pro) →
- Mortgage (P&I)
- −$393
- Tax from tax record
- −$118 /mo · $1,422/yr
- Insurance
- −$31
- HOA
- −$0
- Vacancy / Maint / Mgmt
- −$174
- Net cashflow
- $111
Break-even live
Sensitivity live
| Price | -10% $154 | -5% $133 | +0% $111 | +5% $90 | +10% $69 |
|---|---|---|---|---|---|
| Rent | -10% $46 | -5% $79 | +0% $111 | +5% $144 | +10% $177 |
| Rate | -1.0pp $149 | -0.5pp $130 | base $111 | +0.5pp $92 | +1.0pp $72 |
UW: 25.0% down · 7.5% · 30yr · 1.5% tax · 5.0% vac · 8.0% maint · 8.0% mgmt
Financing live
Cash to close
- Down payment
- $18,725
- Closing costs
- $2,247
- Reserves months
- —
- Total cash needed
- —
Loan-product check · same deal, 3 products live
Conventional
25% down · 7.5% · 30yr
- Down + closing
- —
- Monthly P&I
- —
- Monthly cashflow
- —
- DSCR
- —
- Eligible?
- —
Personal DTI + credit; lowest rate.
DSCR
20% down · 8.5% · 30yr
- Down + closing
- —
- Monthly P&I
- —
- Monthly cashflow
- —
- DSCR
- —
- Eligible?
- —
No personal income docs; deal must DSCR.
Hard money
10% down · 12.0% · 12mo
- Down + closing
- —
- Monthly P&I
- —
- Monthly cashflow
- —
- DSCR
- —
- Eligible?
- —
Short-term bridge; refi at stabilization.
Listing history 18 events
-
2026-06-19days on market $74,900 Active 39 DOM
-
2026-06-18days on market $74,900 Active 38 DOM
-
2026-06-17days on market $74,900 Active 37 DOM
-
2026-06-16days on market $74,900 Active 36 DOM
-
2026-06-15days on market $74,900 Active 35 DOM
-
2026-06-14days on market $74,900 Active 33 DOM
-
2026-06-13days on market $74,900 Active 32 DOM
-
2026-06-10days on market $74,900 Active 30 DOM
-
2026-06-09days on market $74,900 Active 29 DOM
-
2026-06-08days on market $74,900 Active 28 DOM
-
2026-06-07days on market $74,900 Active 27 DOM
-
2026-06-05days on market $74,900 Active 24 DOM
-
2026-06-02days on market $74,900 Active 22 DOM
-
2026-06-01days on market $74,900 Active 21 DOM
-
2026-05-31days on market $74,900 Active 20 DOM
-
2026-05-30days on market $74,900 Active 19 DOM
-
2026-05-11$79,900 Active 530-char remark
-
2024-03-05soldstatus $50,000
ⓘ Source: listings_history table (triggers on properties + properties_extension) + one-shot
backfill from property_details.listing_events for pre-trigger history.
Tax reassessment forecast IL · Partial reset (capped growth)
- Current annual tax
- $1,422 · $118/mo
- Projected year-2 tax
- $1,561 · $130/mo
- Expected delta
- +$139/yr (+$12/mo · 9.8%)
ⓘ Screening estimate from a state-policy table — verify with the county assessor before closing.
Climate risk First Street
- Flood 1/10 Low FEMA zone X (unshaded) · 0% chance over 30 yrs
- Wildfire 1/10 Low
- Heat 4/10 Moderate 7 d/yr ≥105°F today · 20 d/yr by 30 yrs out
- Wind 2/10 Low 2% chance of damaging wind over 30 yrs
- Air quality 2/10 Low 1 unhealthy d/yr today · 2 by 30 yrs out
Nearby sold comps map
Loading sold comps map…
Walkable amenities ~0.75 mi
Loading nearby amenities…
Taxation est. · year 1
- Rental income
- $9,932
- − Mortgage interest
- −$4,196
- − Property taxes
- −$1,422
- − Insurance
- −$374
- − Repairs & maintenance
- −$795
- − Management
- −$795
- − Depreciation
- −$2,179
- Taxable income
- $172
- Est. tax owed @ 24.0%
- −$41
- After-tax cash flow
- $1,295/yr
For passive investors: Depreciation is non-cash, so a rental often shows a tax loss while cash-flowing — sheltering income. Rental losses are passive: they offset passive income freely, and up to $25,000/yr can offset ordinary (W-2) income if you actively participate and your MAGI is under $100k (phasing out to $0 by $150k); unused losses carry forward. On sale, claimed depreciation is recaptured at up to 25%, and gains may owe capital-gains tax (a 1031 exchange can defer both). Figures are a year-1 estimate at your 24.0% rate — not tax advice; consult a CPA.
Schools (NCES district)
- District
- Central A & M CUD 21
- NCES district ID
- 1709100
- Math proficiency
- 13% ▼ -5.00%
- Reading proficiency
- 20% ▼ -7.00%
- Median HH income
- $50,388
- Composite
- 15.02/100
- National rank
- #9357
- State rank
- #477 of 620 in IL
Livability — Assumption
- Score
- 64/100
- State rank
- #717
- US rank
- #14554
Category grades
Schools grade is shown separately in the Schools card above.
Census & demographics
- Census place
- Assumption, IL
- Population (ZIP)
- 1,573
Population outlook (Christian County) Hauer SSP2
- Today (2025)
- 31,182 people
- By 2030
- 29,787 · -4.5%
- By 2040
- 26,793 · -14.1%
- By 2050
- 23,757 · -23.8%
- By 2075
- 17,333 · -44.4%
- By 2100
- 11,573 · -62.9%
Race, ethnicity, and origin ACS 2023
- Neighborhood character
- Predominantly White (88%)
- Race & ethnicity
- White 88% Two or more races 9% Hispanic / Latino 8% Black 2%
- Hispanic origin (detail)
- Mexican 8%
- Common ancestry
- Lithuanian 11% Iranian 8% Serbian 1%
- Foreign-born
- 0%
- Languages at home
- 98% English-only · Spanish 1% French/Haitian/Cajun 1%
Political lean MEDSL · Christian
- 2024 margin
- Solid R (+46.7) · D 25.9% · R 72.6% · Other 1.5%
- 2008→2024 swing
- -40.4pp toward R · 2008: -6.3pp · 2024: -46.7pp
- All cycles
- 2024: R+46.7 2020: R+44.6 2016: R+42.7 2012: R+23.1 2008: R+6.3
Not yet ingested
- Civics
- —
Market trends
- HPI YoY
- ▲ 4.00%
- Current HPI
- 174.2098
- Rent YoY
- —
- Metro
- —
- State GDP YoY
- ▲ 1.59%
- F500 in state
- 60
Industry mix (Fortune 500 HQ in IL)
| Industry | F500 HQs | Revenue |
|---|---|---|
| Insurance | 4 | $201B |
|
||
| Consumer Goods | 4 | $87B |
|
||
| Industrial Machinery | 3 | $64B |
|
||
| Healthcare | 2 | $55B |
|
||
| Retail / Pharmacy | 1 | $148B |
|
||
| Agriculture / Food | 1 | $86B |
|
||
Price history
+49.8% since first listed3 events — show timeline
- 2026-05-28 Price Changed $74,900 RMLSA as Distributed by MLS Grid
- 2026-05-11 Listed $79,900 RMLSA as Distributed by MLS Grid
- 2024-03-05 Sold (Public Records) $50,000 Public Records
Property tax history
+13.0%/yrLatest (2025): $1,422 · +188.0% YoY. Source: county tax records.
Cash-flow waterfall
monthlySold comps — $/sqft
last 12 mo · ≤1 miLoading sold comps…