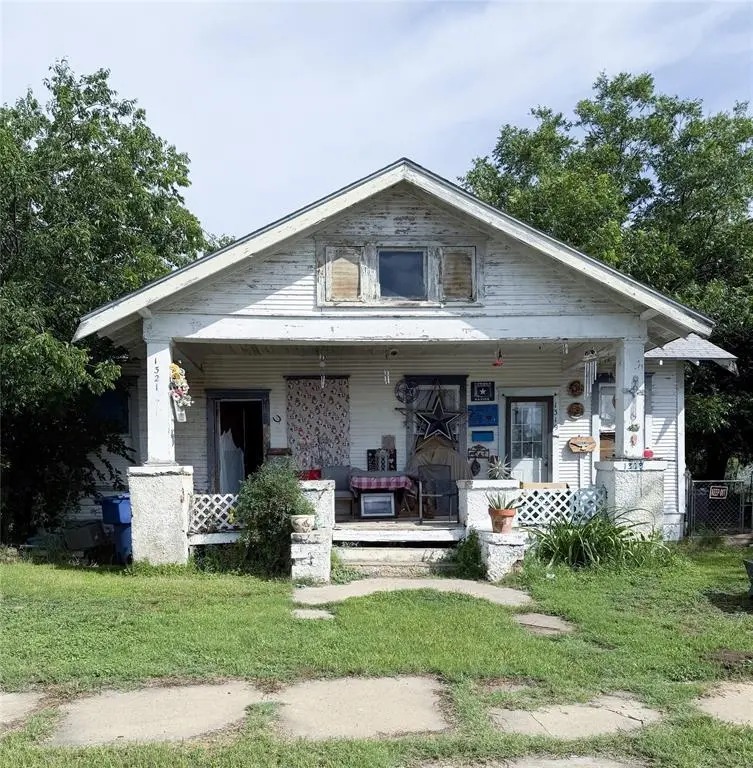
1404 2nd St · Brownwood, TX
Flood risk 1/10 · Minimal
- FEMA flood zone
- X (unshaded)
- Chance of flooding over 30 yrs
- 0.0%
- Est. flood insurance / yr
- $507 – $1,088
Fire risk 6/10 · Moderate
- Est. fire insurance / yr
- $1,222 – $2,270
Heat risk 7/10 · Major
- Hot days now (above 107°F)
- 7 days/yr
- Hot days in 30 yrs
- 23 days/yr
Wind risk 6/10 · Moderate
- Chance of severe wind over 30 yrs
- 27.0%
Air-quality risk 1/10 · Minimal
- Unhealthy air days now
- 0 days/yr
- Unhealthy air days in 30 yrs
- 0 days/yr
Risk factors via First Street. Map © Google.
Why this score? — see what drove the D grade
The composite is a weighted blend of 9 inputs, each scored 0–100. Each bar is that input's sub-score; the figure is the points it added to the 100-point composite (weight × sub-score).
- Cash flow +15.0/30.0
- ARV discount +7.5/15.0
- 1% rule +5.0/10.0
- DSCR +5.0/10.0
- Schools +3.6/10.0
- Livability +3.2/5.0
- Rent growth +2.5/5.0
- Condition / age +2.5/5.0
- Appreciation +0.0/10.0
$19,900
🖨 Deal sheet 📄 Offer letter ✓ Due diligence
Listing remarks
Investor opportunity with plenty of potential. This property features a duplex plus an additional rear house that is is in need of a full redevelopment or possible removal. The main unit offers 3 bedrooms and 2 bathrooms and has an occupant that will be out before closing. The second unit requires repairs & renovation, as plumbing and electrical components have been removed. Expect major repairs in all units. For buyers looking for a value-add project, this property presents multiple paths to create equity and maximize returns. Whether you're considering a renovation, rental strategy, or long-term investment, this is a chance to transform a property with significant upside potential.
Key facts
- Rear house
- Full redevelopment
- Value-add project
Tags
Property features AI
Finance
- Other: Corner lot will not be subdivided
- Financial info: Accepts Cash and Conventional financing; No second mortgage reported
- HOA & community: No homeowners association
Exterior
- Parking: Off-street parking
- Utilities: City water; City sewer; No municipal utility district
- Home design: Single family residence; One story; Residential property; No accessibility features reported; Not attached to another property; No subdivision restrictions known
- Construction: Built in 1920; Composition roof; Construction: rock/stone, vinyl siding, and wood; Slab foundation
- Exterior features: Garden(s); Corner lot
Interior
- Kitchen: Dishwasher; Disposal; Gas range; Microwave; Refrigerator
- Bedrooms: 3 bedrooms total; Primary bedroom (15 x 15)
- Flooring: Wood floors
- Bathrooms: 2 full bathrooms
- Heating & cooling: Window unit(s) for cooling; Other type of heating
- Interior features: Additional interior features noted as 'Other'; One living area; One dining area; Living room (15 x 15)
- Laundry & utility: Washer; Dryer
Neighborhood map
What this means for you Summary
Snapshot
- This is a 3-bed/2.0-bath single-family listed at $20k.
Deal economics
- At list price, monthly cash flow is $1k ($15k/yr) — positive.
- The deal already cash-flows at list — no discount required.
- Meets the 1% rule at list price ($2k rent vs $20k).
- Cap rate 83.7% vs local median 3.7% in Brownwood — top-decile yield for the area; either an underpriced asset or a hidden risk that comps aren't pricing in. Stress-test before assuming the spread holds.
Location & tenants
- Location reads 64/100 on livability (#781 in TX) — a middle-class / working-renter tenant base. Strengths: cost of living A+, housing A+; Watch: crime D+, health & safety D+, amenities F.
- Brownwood ISD (town): math 45% / reading 41% proficiency, ranked #344 of 826 in TX (top 42%) — families likely to look elsewhere, expect single-tenant / working-renter base with shorter leases.
- Zoned schools: Coggin El (math 45% / reading 34%, grade F, #1,545 of 4,322 statewide, top 38%, 708 students, 79% FRL) — zoned schools average 79% FRL vs 54% district-wide (25 pts higher); higher-poverty schools than district average — tighter screening recommended.
- Market conditions: 377 active listings in the ZIP; 1 comparable units currently listed for rent nearby; 142 units permitted in Brown County in 2024 (0 in 5+ unit buildings).
Forward outlook
- Local home prices are declining (-3.0%/yr); year-one equity from $138 of loan paydown is wiped out by about $597 of value loss. Plan a longer hold.
- At projected returns (-3.0% appreciation + 3.0% rent growth), your $6k cash investment doubles in ~1 year — after that, you're playing with house money.
Negotiation context
- Only 14 days on market — expect competitive offers; lowballing is unlikely to land.
Risks & watch-outs
- Watch-outs: built in 1920 — expect roof / HVAC / electrical / plumbing capex.
- Climate carrying-cost: major wind risk, 27% chance of damaging wind over 30y; major wildfire risk; extreme-heat days projected 7→23/yr by 2055 (HVAC capex compounding) — expect insurance premiums to compound above CPI over the hold.
Questions for the listing agent
- Built in 1920 — when were the roof, HVAC, electrical panel, plumbing, and water heater last replaced?
- Is there a deadline driving the sale (1031 exchange, divorce, estate, relocation)? That informs how much negotiation room exists.
- Schools are F-rated, which usually means shorter tenancies and higher turnover. Who's the typical renter profile here, and what's been the actual vacancy rate?
- Crime grade is D in this area — have there been break-ins, vandalism, or insurance claims at this property in the last 3 years? What carrier currently insures it and at what premium?
- The area grade is low — what's the realistic commute time and amenity access for the typical tenant pool here? Any planned neighborhood developments (good or bad) we should know about?
- What's the average days-on-market for RENTAL listings here right now (not sales)? A rising rental-DOM trend means longer vacancies and softer asking-rent achievability than the comps imply.
- What's the recent tenant-quality profile in this submarket — average credit score on applications, eviction rate, late-payment / NSF rate, and stable-employment percentage? A property-management company in the area should have these aggregated.
- How much new for-sale + rental construction is in the pipeline within 1–3 miles? Heavy new supply typically softens prices + rents 12–24 months out; constrained supply supports both.
Investment metrics
- 1% rule
- 9.05% ✓
- Cap rate
- 83.75%
- Cash-on-cash
- 276.63%
- DSCR
- 13.31
- GRM
- 0.9
CMA / ARV
- ARV (on-the-fly)
- $244,530
- Comps found
- 12
Show comp detail 12 sales within ~0.75 mi
| Address | Dist | Beds/Ba | Sqft | Sold | Price | $/sf | Match |
|---|---|---|---|---|---|---|---|
| 1605 6th St | 0.33mi | 3/2.0 | 1,960 (-6%) | 6mo | $105,000 | $54 | 69 |
| 1617 6th St | 0.35mi | 4/1.0 (+1) | 2,048 (-2%) | 4mo | $75,000 | $37 | 68 |
| 606 Avenue C | 0.55mi | 3/1.0 | 2,057 (-2%) | 3mo | $45,000 | $22 | 65 |
| 1009 Roselawn St | 0.46mi | 3/2.0 | 1,942 (-7%) | 8mo | $320,000 | $165 | 60 |
| 2107 Elizabeth Dr | 0.58mi | 4/2.0 (+1) | 2,048 (-2%) | 10mo | $239,900 | $117 | 56 |
| 2204 Dartmore St | 0.74mi | 4/3.0 (+1) | 2,029 (-3%) | 3mo | $254,500 | $125 | 49 |
| 2010 Brooke Ln | 0.72mi | 4/2.5 (+1) | 2,203 (+5%) | 4mo | $207,990 | $94 | 46 |
| 1400 Cottage | 0.56mi | 4/2.5 (+1) | 2,312 (+11%) | 6mo | $298,000 | $129 | 44 |
| 2100 Belmeade Ave | 0.55mi | 4/2.0 (+1) | 2,361 (+13%) | 5mo | $229,000 | $97 | 43 |
| 2202 Belmeade Ave | 0.66mi | 4/3.0 (+1) | 2,228 (+7%) | 11mo | $299,000 | $134 | 40 |
| 1908 Brooke Ln | 0.66mi | 3/2.0 | 1,781 (-15%) | 11mo | $199,900 | $112 | 35 |
| 2211 Belmeade | 0.70mi | 2/2.0 (-1) | 1,846 (-12%) | 12mo | $315,000 | $171 | 33 |
Match score weights: distance 35% · size 25% · config 20% · recency 20%. Top-matched comps best support the ARV.
Projected returns pro-forma
-3.0% appreciation · 3.0% rent growth · sell at horizon
- IRR
- —
- Equity multiple
- 15.11×
- Total profit
- $78,611
- Equity at exit
- $2,967
- IRR
- —
- Equity multiple
- 32.21×
- Total profit
- $173,906
- Equity at exit
- $1,721
Cash invested: $5,572 (down + closing). Projections, not guarantees.
Landlord ↔ Tenant lean methodology
- Overall (STATE)
- 87 Strongly Landlord-Friendly
- State Texas
- 87 Strongly Landlord-Friendly · R+5
- County
- — inherits STATE
- City
- — inherits STATE
ZIP-level market 76801
- Active inventory
- 377
- Price-to-rent
- 0.9×
Monthly cashflow live
- Estimated rent
- $1,800 medium interval (Pro) →
- Mortgage (P&I)
- −$104
- Tax est. 1.5%
- −$25 /mo · $298/yr
- Insurance
- −$8
- HOA
- −$0
- Vacancy / Maint / Mgmt
- −$378
- Net cashflow
- $1,284
Break-even live
UW: 25.0% down · 7.5% · 30yr · 1.5% tax · 5.0% vac · 8.0% maint · 8.0% mgmt
Financing live
Cash to close
- Down payment
- $4,975
- Closing costs
- $597
- Reserves months
- —
- Total cash needed
- —
Loan-product check · same deal, 3 products live
Conventional
25% down · 7.5% · 30yr
- Down + closing
- —
- Monthly P&I
- —
- Monthly cashflow
- —
- DSCR
- —
- Eligible?
- —
Personal DTI + credit; lowest rate.
DSCR
20% down · 8.5% · 30yr
- Down + closing
- —
- Monthly P&I
- —
- Monthly cashflow
- —
- DSCR
- —
- Eligible?
- —
No personal income docs; deal must DSCR.
Hard money
10% down · 12.0% · 12mo
- Down + closing
- —
- Monthly P&I
- —
- Monthly cashflow
- —
- DSCR
- —
- Eligible?
- —
Short-term bridge; refi at stabilization.
Rent comps 1 comps
| Address | Beds | Baths | Sqft | Rent | $/sqft | DOM | Units | Dist |
|---|---|---|---|---|---|---|---|---|
| 2411 13th St Brownwood, TX | 3.0 | 2.0 | 1466 | $1,800 | $1.23 | 43d | 1 | 1.24mi |
Listing history 11 events
-
2026-06-16status $19,900 Pending 14 DOM
-
2026-06-15days on market $19,900 Active 14 DOM
-
2026-06-13days on market $19,900 Active 12 DOM
-
2026-06-12pricedays on market $19,900 Active 11 DOM
-
2026-06-09days on market $27,900 Active 8 DOM
-
2026-06-08days on market $27,900 Active 7 DOM
-
2026-06-08days on market $27,900 Active 6 DOM
-
2026-06-07pricedays on market $27,900 Active 5 DOM
-
2026-06-03days on market $34,900 Active 2 DOM
-
2026-06-02remarks 695-char remark
-
2026-06-02$34,900 Active 1 DOM
ⓘ Source: listings_history table (triggers on properties + properties_extension) + one-shot
backfill from property_details.listing_events for pre-trigger history.
Climate risk First Street
- Flood 1/10 Low FEMA zone X (unshaded) · 0% chance over 30 yrs
- Wildfire 6/10 Major
- Heat 7/10 Severe 7 d/yr ≥107°F today · 23 d/yr by 30 yrs out
- Wind 6/10 Major 27% chance of damaging wind over 30 yrs
- Air quality 1/10 Low 0 unhealthy d/yr today · 0 by 30 yrs out
Nearby sold comps map
Loading sold comps map…
Walkable amenities ~0.75 mi
Loading nearby amenities…
Taxation est. · year 1
- Rental income
- $21,600
- − Mortgage interest
- −$1,115
- − Property taxes
- −$298
- − Insurance
- −$100
- − Repairs & maintenance
- −$1,728
- − Management
- −$1,728
- − Depreciation
- −$579
- Taxable income
- $16,052
- Est. tax owed @ 24.0%
- −$3,853
- After-tax cash flow
- $11,561/yr
For passive investors: Depreciation is non-cash, so a rental often shows a tax loss while cash-flowing — sheltering income. Rental losses are passive: they offset passive income freely, and up to $25,000/yr can offset ordinary (W-2) income if you actively participate and your MAGI is under $100k (phasing out to $0 by $150k); unused losses carry forward. On sale, claimed depreciation is recaptured at up to 25%, and gains may owe capital-gains tax (a 1031 exchange can defer both). Figures are a year-1 estimate at your 24.0% rate — not tax advice; consult a CPA.
Schools (NCES district)
- District
- Brownwood ISD
- NCES district ID
- 4811700
- Math proficiency
- 45% ▲ 4.00%
- Reading proficiency
- 41% ▲ 1.00%
- Median HH income
- $37,395
- Composite
- 35.8/100
- National rank
- #4833
- State rank
- #344 of 826 in TX
Livability — Brownwood
- Score
- 64/100
- State rank
- #781
- US rank
- #14230
Category grades
Schools grade is shown separately in the Schools card above.
Census & demographics
- Census place
- Brownwood, TX
- Population (ZIP)
- 25,152
Population outlook (Brown County) Hauer SSP2
- Today (2025)
- 38,381 people
- By 2030
- 38,288 · -0.2%
- By 2040
- 38,120 · -0.7%
- By 2050
- 38,227 · -0.4%
- By 2075
- 39,362 · +2.6%
- By 2100
- 39,171 · +2.1%
Race, ethnicity, and origin ACS 2023
- Neighborhood character
- Predominantly White (66%)
- Race & ethnicity
- White 66% Hispanic / Latino 26% Two or more races 15% Black 4%
- Hispanic origin (detail)
- Mexican 23%
- Common ancestry
- Italian 12% Slovak 2% Lithuanian 1%
- Foreign-born
- 4% · Canada
- Languages at home
- 82% English-only · Spanish 17%
Political lean MEDSL · Brown
- 2024 margin
- Solid R (+73.9) · D 12.7% · R 86.6%
- 2008→2024 swing
- -12.5pp toward R · 2008: -61.5pp · 2024: -73.9pp
- All cycles
- 2024: R+73.9 2020: R+72.6 2016: R+74.5 2012: R+71.7 2008: R+61.5
Not yet ingested
- Civics
- —
Market trends
- HPI YoY
- ▼ -121.52%
- Current HPI
- 164.0992
- Rent YoY
- —
- Metro
- —
- State GDP YoY
- ▲ 3.95%
- F500 in state
- 110
Industry mix (Fortune 500 HQ in TX)
| Industry | F500 HQs | Revenue |
|---|---|---|
| Energy | 16 | $1,198B |
|
||
| Technology | 5 | $198B |
|
||
| Engineering / Construction | 4 | $72B |
|
||
| Energy Services | 3 | $60B |
|
||
| Utilities | 3 | $41B |
|
||
| Healthcare | 2 | $330B |
|
||
Price history
3 events — show timeline
- 2026-06-01 Listed $34,900 NTREIS
- 2000-12-13 Sold (Public Records) — Public Records
- 2000-12-13 Sold (Public Records) — Public Records
Property tax history
+4.3%/yrLatest (2025): $2,454 · +2.9% YoY. Source: county tax records.
Cash-flow waterfall
monthlySold comps — $/sqft
last 12 mo · ≤1 miLoading sold comps…