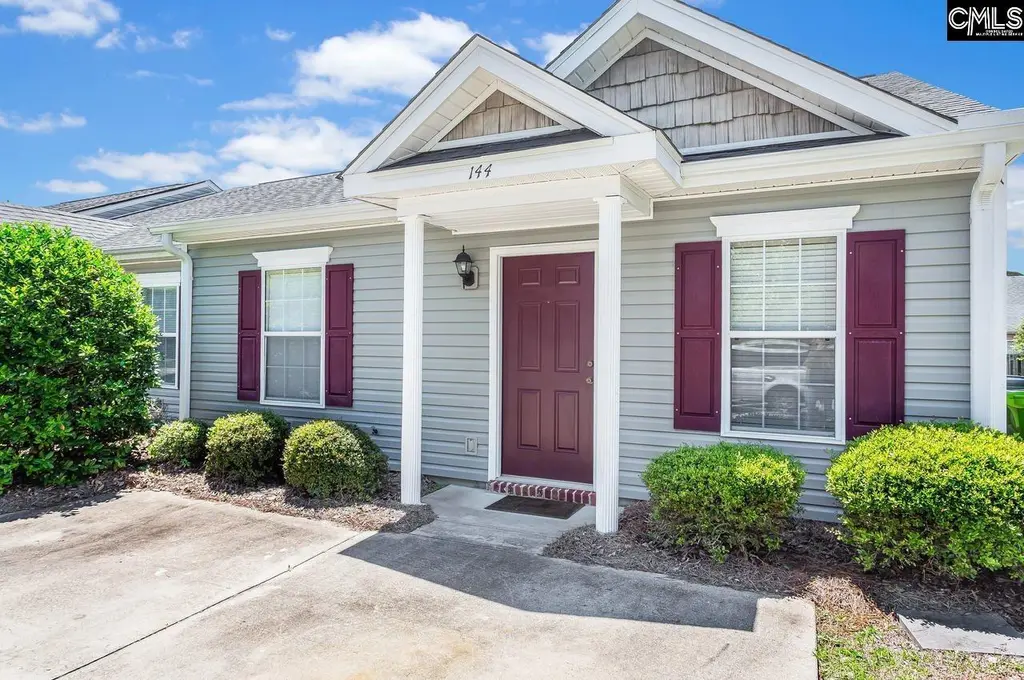
144 Elkhorn Ln · Dentsville, SC
Flood risk No data
- FEMA flood zone
- —
- Chance of flooding over 30 yrs
- —
- Est. flood insurance / yr
- —
Fire risk No data
- Est. fire insurance / yr
- —
Heat risk No data
- Hot days now (above threshold)
- —
- Hot days in 30 yrs
- —
Wind risk No data
- Chance of severe wind over 30 yrs
- —
Air-quality risk No data
- Unhealthy air days now
- —
- Unhealthy air days in 30 yrs
- —
Risk factors via First Street. Map © Google.
Why this score? — see what drove the D+ grade
The composite is a weighted blend of 9 inputs, each scored 0–100. Each bar is that input's sub-score; the figure is the points it added to the 100-point composite (weight × sub-score).
- Cash flow +19.0/30.0
- ARV discount +7.5/15.0
- DSCR +6.0/10.0
- 1% rule +4.0/10.0
- Schools +3.6/10.0
- Livability +3.6/5.0
- Rent growth +3.2/5.0
- Condition / age +2.5/5.0
- Appreciation +0.0/10.0
$177,900
🖨 Deal sheet 📄 Offer letter ✓ Due diligence
Listing remarks
Step inside to an inviting open-concept floor plan designed for comfortable everyday living and effortless entertaining. The spacious Owner's Suite features a private bath and a generous walk-in closet with washer and dryer hookups, combining comfort and functionality. A second bedroom and full bath provide flexibility for guests, family, or a home office. Enjoy being close to shopping, dining, schools, and the many conveniences along Clemson Road. With its attractive layout, low-maintenance design, and highly desirable location, this home is perfect for first-time buyers, downsizers, military personnel, students, or anyone seeking a carefree lifestyle. Don't miss this opportunity to own an
Key facts
- Move-in-ready home
- Private bath
- Walk-in closet
Tags
Property features AI
Finance
- HOA & community: Has homeowners association
Exterior
- Parking: 2 parking spaces
- Utilities: Public water; Public sewer
- Home design: Single-family property
- Construction: Slab foundation
- Exterior features: Vinyl exterior; Paved road access; Lot about 0.06 acres
Interior
- Kitchen: Kitchen on the main level
- Bedrooms: Primary bedroom on the main level
- Bathrooms: Two full bathrooms
- Heating & cooling: Central heating; Central air conditioning
- Interior features: One fireplace; Dining room on the main level; Great room on the main level
- Laundry & utility: Washer and dryer on the main level
Neighborhood map
What this means for you Summary
Snapshot
- This is a 2-bed/2.0-bath single-family listed at $178k.
Deal economics
- At list price, monthly cash flow is $184 ($2k/yr) — positive.
- The deal already cash-flows at list — no discount required.
- To meet the 1% rule (rent ≥ 1% of price), the offer needs to be $160k (10.2% below list).
- Recommended offer: $160k (10.2% below list) — sets the bar for 1% rule.
Location & tenants
- Location reads 71/100 on livability (#50 in SC) — a middle-class / working-renter tenant base. Strengths: cost of living A+, health & safety A+, housing A; Watch: amenities D+, crime F, commute F.
- Richland 02 (suburban): math 35% / reading 47% proficiency, ranked #29 of 80 in SC (top 36%) — families likely to look elsewhere, expect single-tenant / working-renter base with shorter leases.
- Zoned schools: Rice Creek Elementary (math 36% / reading 34%, grade F, #339 of 597 statewide, top 57%, 737 students, 76% FRL); Ridge View High (math 43% / reading 76%, grade C+, #110 of 196 statewide, top 58%, 1,711 students, 60% FRL) — zoned schools average 68% FRL vs 38% district-wide (30 pts higher); higher-poverty schools than district average — tighter screening recommended.
- Market conditions: Rents rising (+2.8%/yr); 406 active listings in the ZIP; 12 comparable units currently listed for rent nearby; rentals at typical pace (median 14d on market — plan ~3-4 weeks tenant-placement turnaround); 3,472 units permitted in Richland County in 2024 (1,096 in 5+ unit buildings).
Forward outlook
- Local home prices are declining (-3.0%/yr); year-one equity from $1k of loan paydown is wiped out by about $5k of value loss. Plan a longer hold.
- Richland County population projected at +30% by 2050 — long-run rental-demand tailwind backs the buy-and-hold thesis.
Negotiation context
- Only 13 days on market — expect competitive offers; lowballing is unlikely to land.
- 3 sale attempts since 7y ago with the ask held roughly flat each time — persistent listings suggest the price (not the market) is what's stuck; bring a comps-based counter.
- Current owner paid $90k; list at $178k implies a 98% gain — meaningful room to come down on a strong offer.
Questions for the listing agent
- Is there a deadline driving the sale (1031 exchange, divorce, estate, relocation)? That informs how much negotiation room exists.
- Schools are D-rated, which usually means shorter tenancies and higher turnover. Who's the typical renter profile here, and what's been the actual vacancy rate?
- Crime grade is F in this area — have there been break-ins, vandalism, or insurance claims at this property in the last 3 years? What carrier currently insures it and at what premium?
- The area grade is low — what's the realistic commute time and amenity access for the typical tenant pool here? Any planned neighborhood developments (good or bad) we should know about?
- What's the average days-on-market for RENTAL listings here right now (not sales)? A rising rental-DOM trend means longer vacancies and softer asking-rent achievability than the comps imply.
- What's the recent tenant-quality profile in this submarket — average credit score on applications, eviction rate, late-payment / NSF rate, and stable-employment percentage? A property-management company in the area should have these aggregated.
- How much new for-sale + rental construction is in the pipeline within 1–3 miles? Heavy new supply typically softens prices + rents 12–24 months out; constrained supply supports both.
Investment metrics
- 1% rule
- 0.90% ✗
- Cap rate
- 7.54%
- Cash-on-cash
- 4.44%
- DSCR
- 1.20
- GRM
- 9.3
CMA / ARV
No comps found within radius.
Projected returns pro-forma
-3.0% appreciation · 2.81% rent growth · sell at horizon
- IRR
- -9.6%
- Equity multiple
- 0.65×
- Total profit
- $-17,458
- Equity at exit
- $26,525
- IRR
- -0.5%
- Equity multiple
- 0.97×
- Total profit
- $-1,608
- Equity at exit
- $15,382
Cash invested: $49,812 (down + closing). Projections, not guarantees.
Landlord ↔ Tenant lean methodology
- Overall (STATE)
- 90 Strongly Landlord-Friendly
- State South Carolina
- 90 Strongly Landlord-Friendly · R+6
- County
- — inherits STATE
- City
- — inherits STATE
ZIP-level market 29229
- Home prices YoY
- -21.5%
- Rents YoY
- 2.8%
- Active inventory
- 406
- Price-to-rent
- 9.3×
Monthly cashflow live
- Estimated rent
- $1,597 high interval (Pro) →
- Mortgage (P&I)
- −$933
- Tax from tax record
- −$70 /mo · $840/yr
- Insurance
- −$74
- HOA
- −$0
- Vacancy / Maint / Mgmt
- −$335
- Net cashflow
- $184
Break-even live
UW: 25.0% down · 7.5% · 30yr · 1.5% tax · 5.0% vac · 8.0% maint · 8.0% mgmt
Financing live
Cash to close
- Down payment
- $44,475
- Closing costs
- $5,337
- Reserves months
- —
- Total cash needed
- —
Loan-product check · same deal, 3 products live
Conventional
25% down · 7.5% · 30yr
- Down + closing
- —
- Monthly P&I
- —
- Monthly cashflow
- —
- DSCR
- —
- Eligible?
- —
Personal DTI + credit; lowest rate.
DSCR
20% down · 8.5% · 30yr
- Down + closing
- —
- Monthly P&I
- —
- Monthly cashflow
- —
- DSCR
- —
- Eligible?
- —
No personal income docs; deal must DSCR.
Hard money
10% down · 12.0% · 12mo
- Down + closing
- —
- Monthly P&I
- —
- Monthly cashflow
- —
- DSCR
- —
- Eligible?
- —
Short-term bridge; refi at stabilization.
Rent comps 12 comps
| Address | Beds | Baths | Sqft | Rent | $/sqft | DOM | Units | Dist |
|---|---|---|---|---|---|---|---|---|
| 423 Elders Pond Cir Columbia, SC | 2.0 | 2.0 | 1125 | $1,475 | $1.31 | 19d | 1 | 0.07mi |
| 4500 Hard Scrabble Rd Columbia, SC | 1.0–3.0 | 1.0–2.0 | 1031 | $1,348 | $1.31 | 2d | 4 | 0.20mi |
| 214 Elders Pond Dr Columbia, SC | 3.0 | 2.5 | 1400 | $1,350 | $0.96 | 11d | 1 | 0.28mi |
| 1116 Waverly Place Ln Columbia, SC | 3.0 | 2.0 | 1428 | $1,875 | $1.31 | 14d | 1 | 0.37mi |
| 1214 Waverly Place Ln Columbia, SC | 3.0 | 2.0 | 1152 | $1,800 | $1.56 | 11d | 1 | 0.46mi |
| 108 Quinton Ln Columbia, SC | 3.0 | 2.0 | 1052 | $1,749 | $1.66 | 21d | 1 | 0.57mi |
| 3 Glen Knoll Ct Columbia, SC | 3.0 | 2.0 | 1320 | $1,699 | $1.29 | 11d | 1 | 0.58mi |
| 109 Jaybird Ln Columbia, SC | 3.0 | 2.0 | 1250 | $1,679 | $1.34 | 2d | 1 | 0.84mi |
| 3 Long Glen Ct Columbia, SC | 3.0 | 2.0 | 1314 | $1,849 | $1.41 | 2d | 1 | 1.03mi |
| 201 Trowbridge Rd Columbia, SC | 3.0 | 2.0 | 1220 | $1,649 | $1.35 | 23d | 1 | 1.17mi |
| 21 Winslow Ct Columbia, SC | 3.0 | 2.0 | 1220 | $1,649 | $1.35 | 21d | 1 | 1.27mi |
| 225 Lawson Dr Columbia, SC | 2.0 | 2.0 | 1288 | $1,580 | $1.23 | 23d | 1 | 1.28mi |
Listing history 11 events
-
2026-06-18days on market $177,900 Active 13 DOM
-
2026-06-17days on market $177,900 Active 12 DOM
-
2026-06-16days on market $177,900 Active 11 DOM
-
2026-06-15days on market $177,900 Active 10 DOM
-
2026-06-14days on market $177,900 Active 8 DOM
-
2026-06-13days on market $177,900 Active 7 DOM
-
2026-06-10days on market $177,900 Active 5 DOM
-
2026-06-09days on market $177,900 Active 4 DOM
-
2026-06-08days on market $177,900 Active 3 DOM
-
2026-06-07remarks 699-char remark
-
2026-06-07$177,900 Active 2 DOM
ⓘ Source: listings_history table (triggers on properties + properties_extension) + one-shot
backfill from property_details.listing_events for pre-trigger history.
Tax reassessment forecast SC · Resets to sale price
- Current annual tax
- $840 · $70/mo
- Projected year-2 tax
- $1,014 · $85/mo
- Expected delta
- +$174/yr (+$15/mo · 20.7%)
ⓘ Screening estimate from a state-policy table — verify with the county assessor before closing.
Nearby sold comps map
Loading sold comps map…
Walkable amenities ~0.75 mi
Loading nearby amenities…
Taxation est. · year 1
- Rental income
- $19,161
- − Mortgage interest
- −$9,965
- − Property taxes
- −$840
- − Insurance
- −$890
- − Repairs & maintenance
- −$1,533
- − Management
- −$1,533
- − Depreciation
- −$5,175
- Taxable loss
- −$775
- Est. tax savings @ 24.0%
- +$186
- After-tax cash flow
- $2,399/yr
For passive investors: Depreciation is non-cash, so a rental often shows a tax loss while cash-flowing — sheltering income. Rental losses are passive: they offset passive income freely, and up to $25,000/yr can offset ordinary (W-2) income if you actively participate and your MAGI is under $100k (phasing out to $0 by $150k); unused losses carry forward. On sale, claimed depreciation is recaptured at up to 25%, and gains may owe capital-gains tax (a 1031 exchange can defer both). Figures are a year-1 estimate at your 24.0% rate — not tax advice; consult a CPA.
Schools (NCES district)
- District
- Richland 02
- NCES district ID
- 4503390
- Math proficiency
- 35% ▼ -15.00%
- Reading proficiency
- 47% ▼ -5.00%
- Median HH income
- $59,684
- Composite
- 36.2/100
- National rank
- #4730
- State rank
- #29 of 80 in SC
Livability — Dentsville
- Score
- 71/100
- State rank
- #50
- US rank
- #6940
Category grades
Schools grade is shown separately in the Schools card above.
Census & demographics
- County
- Richland County · 389,530 people
- City population
- 52,835
- Metro
- Columbia, SC
- Population (ZIP)
- 51,861
- Household income
- $74,043
- Rent vs Own
- Severe rent burden
- 1939.0
Population outlook (Richland County) Hauer SSP2
- Today (2025)
- 459,667 people
- By 2030
- 487,524 · +6.1%
- By 2040
- 542,035 · +17.9%
- By 2050
- 595,371 · +29.5%
- By 2075
- 732,998 · +59.5%
- By 2100
- 820,415 · +78.5%
Race, ethnicity, and origin ACS 2023
- Neighborhood character
- Diverse neighborhood (Simpson 0.56)
- Race & ethnicity
- Black 62% White 24% Hispanic / Latino 8% Two or more races 6% Asian 3%
- Hispanic origin (detail)
- Mexican 2% Puerto Rican 2%
- Common ancestry
- Slovak 1% Lithuanian 1% Romanian 1%
- Foreign-born
- 7% · Canada, South Korea, Jamaica
- Languages at home
- 89% English-only · Spanish 6% Other Indo-European 1% Korean 1%
Political lean MEDSL · Richland
- 2024 margin
- Solid D (+34.6) · D 66.4% · R 31.8% · Other 1.8%
- 2008→2024 swing
- +5.7pp toward D · 2008: 28.9pp · 2024: 34.6pp
- All cycles
- 2024: D+34.6 2020: D+38.3 2016: D+32.9 2012: D+33.3 2008: D+28.9
Not yet ingested
- Civics
- —
Market trends
- HPI YoY
- ▼ -51.11%
- Current HPI
- 186.782
- Rent YoY
- ▲ 2.81%
- Metro
- Columbia, SC
- State GDP YoY
- ▲ 4.51%
- F500 in state
- 2
Industry mix (Fortune 500 HQ in SC)
| Industry | F500 HQs | Revenue |
|---|---|---|
| Packaging | 1 | $7B |
|
||
Price history
+93.4% since first listed6 events — show timeline
- 2026-06-03 Listed $177,900 Consolidated MLS
- 2019-12-19 Listed $92,000 SBOR
- 2019-06-04 Sold (Public Records) $90,000 Public Records
- 2019-05-30 Sold (MLS) $90,000 SBOR
- 2019-05-21 Delisted — Consolidated MLS
- 2019-05-17 Listed $92,000 Consolidated MLS
Property tax history
-0.3%/yrLatest (2025): $840 · +3.7% YoY. Source: county tax records.
Cash-flow waterfall
monthlySold comps — $/sqft
last 12 mo · ≤1 miLoading sold comps…