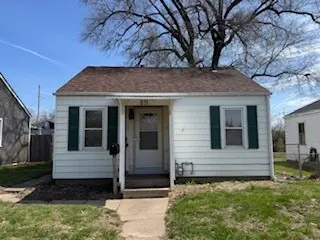
611 S Elsie Ave · Davenport, IA
Flood risk 1/10 · Minimal
- FEMA flood zone
- X (unshaded)
- Chance of flooding over 30 yrs
- 0.0%
- Est. flood insurance / yr
- $507 – $1,088
Fire risk 3/10 · Minor
- Est. fire insurance / yr
- $902 – $1,676
Heat risk 3/10 · Minor
- Hot days now (above 104°F)
- 7 days/yr
- Hot days in 30 yrs
- 16 days/yr
Wind risk 2/10 · Minimal
- Chance of severe wind over 30 yrs
- —
Air-quality risk 3/10 · Minor
- Unhealthy air days now
- 2 days/yr
- Unhealthy air days in 30 yrs
- 3 days/yr
Risk factors via First Street. Map © Google.
Why this score? — see what drove the B+ grade
The composite is a weighted blend of 9 inputs, each scored 0–100. Each bar is that input's sub-score; the figure is the points it added to the 100-point composite (weight × sub-score).
- Cash flow +30.0/30.0
- ARV discount +15.0/15.0
- 1% rule +10.0/10.0
- DSCR +10.0/10.0
- Livability +4.0/5.0
- Schools +3.9/10.0
- Rent growth +2.5/5.0
- Condition / age +2.5/5.0
- Appreciation +0.0/10.0
$47,500
🖨 Deal sheet 📄 Offer letter ✓ Due diligence
Listing remarks
Wonderful home for an investor to add to their portfolio!! Two bedroom and one bathroom slab home with a TWO car garage and fully fenced in yard!! Needs work on the inside, but has a new roof on the house and garage with aluminum siding in good shape!
Key facts
- Fully fenced yard
- New roof
- Aluminum siding
Tags
Property features AI
Finance
- Other: Fee simple ownership; Property not currently leased; Possession at closing
- HOA & community: No master association fee (not required)
Exterior
- Parking: Detached garage (2 garage spaces, 2 total parking spaces)
- Utilities: Public water; Public sewer; Electric service (standard)
- Home design: Detached single-family home; One-story
- Construction: Built approximately 81–90 years ago; Aluminum siding; Asphalt roof; Crawl space foundation
- Exterior features: Lot approximately 128 x 40; Less than 0.25-acre lot; No notable lot features
Interior
- Kitchen: Kitchen with luxury vinyl flooring
- Bedrooms: 2 bedrooms (both on main level)
- Flooring: Hardwood flooring (some bedrooms and areas); Luxury vinyl flooring (kitchen, living room); Other flooring in laundry
- Bathrooms: 1 full bathroom
- Heating & cooling: Natural gas heating; Central air conditioning
- Interior features: First-floor bedroom; Total of 4 rooms
- Laundry & utility: Main-level laundry; Gas dryer hookup
Neighborhood map
What this means for you Summary
Snapshot
- This is a 2-bed/1.0-bath single-family listed at $48k.
Deal economics
- At list price, monthly cash flow is $296 ($4k/yr) — positive.
- The deal already cash-flows at list — no discount required.
- Meets the 1% rule at list price ($848 rent vs $48k).
- Cap rate 13.8% vs local median 4.4% in Davenport — top-decile yield for the area; either an underpriced asset or a hidden risk that comps aren't pricing in. Stress-test before assuming the spread holds.
Location & tenants
- Location reads 79/100 on livability (#126 in IA, #2,312 nationally) — a middle-class / working-renter tenant base. Strengths: cost of living A+, housing A+, health & safety A+; Watch: employment C-, crime F.
- Davenport Community School District (urban): math 43% / reading 50% proficiency, ranked #288 of 289 in IA (top 100%) — families likely to look elsewhere, expect single-tenant / working-renter base with shorter leases.
- Market conditions: 68 active listings in the ZIP; 2 comparable units currently listed for rent nearby; 805 units permitted in Scott County in 2024 (479 in 5+ unit buildings).
Forward outlook
- Local home prices are declining (-3.0%/yr); year-one equity from $328 of loan paydown is wiped out by about $1k of value loss. Plan a longer hold.
- Scott County population projected at +19% by 2050 — long-run rental-demand tailwind backs the buy-and-hold thesis.
- At projected returns (-3.0% appreciation + 3.0% rent growth), your $13k cash investment doubles in ~5 years — after that, you're playing with house money.
Negotiation context
- Only 3 days on market — expect competitive offers; lowballing is unlikely to land.
- 5 sale attempts since 16y ago; this cycle's ask has dropped $15k (24%) from the opening price — seller is motivated, your offer sets the floor, not the list.
Risks & watch-outs
- Watch-outs: property tax is 2.7% of price; built in 1944 — expect roof / HVAC / electrical / plumbing capex.
Questions for the listing agent
- Built in 1944 — when were the roof, HVAC, electrical panel, plumbing, and water heater last replaced?
- Property tax is high relative to price — has the assessment been appealed recently, and will the sale trigger a re-assessment?
- Is there a deadline driving the sale (1031 exchange, divorce, estate, relocation)? That informs how much negotiation room exists.
- Crime grade is F in this area — have there been break-ins, vandalism, or insurance claims at this property in the last 3 years? What carrier currently insures it and at what premium?
- What's the average days-on-market for RENTAL listings here right now (not sales)? A rising rental-DOM trend means longer vacancies and softer asking-rent achievability than the comps imply.
- What's the recent tenant-quality profile in this submarket — average credit score on applications, eviction rate, late-payment / NSF rate, and stable-employment percentage? A property-management company in the area should have these aggregated.
- How much new for-sale + rental construction is in the pipeline within 1–3 miles? Heavy new supply typically softens prices + rents 12–24 months out; constrained supply supports both.
Investment metrics
- 1% rule
- 1.79% ✓
- Cap rate
- 13.77%
- Cash-on-cash
- 26.71%
- DSCR
- 2.19
- GRM
- 4.7
CMA / ARV
- ARV (on-the-fly)
- $76,608
- Comps found
- 10
Show comp detail 10 sales within ~0.75 mi
| Address | Dist | Beds/Ba | Sqft | Sold | Price | $/sf | Match |
|---|---|---|---|---|---|---|---|
| 611 S Elsie Ave | 0.00mi | 2/1.0 | 576 (0%) | 1mo | $48,000 | $83 | 99 |
| 3223 Mckinley Ave | 0.06mi | 2/1.0 | 620 (+8%) | 1mo | $95,000 | $153 | 83 |
| 3207 Homestead Ave | 0.44mi | 2/1.0 | 600 (+4%) | 1mo | $55,000 | $92 | 71 |
| 3116 Orchard Ave | 0.49mi | 2/1.0 | 600 (+4%) | 9mo | $76,000 | $127 | 62 |
| 914 S Elsie Ave | 0.26mi | 1/1.0 (-1) | 648 (+12%) | 0mo | $86,000 | $133 | 62 |
| 804 S Nevada Ave | 0.25mi | 2/1.0 | 636 (+10%) | 14mo | $103,500 | $163 | 59 |
| 3610 May Ln | 0.21mi | 2/1.0 | 648 (+12%) | 14mo | $71,000 | $110 | 58 |
| 3522 May Ln | 0.16mi | 2/1.0 | 648 (+12%) | 18mo | $119,000 | $184 | 57 |
| 3616 May Ln | 0.22mi | 2/1.0 | 648 (+12%) | 16mo | $80,000 | $123 | 56 |
| 1307 S Michigan Ave | 0.49mi | 2/1.0 | 648 (+12%) | 23mo | $120,000 | $185 | 37 |
Match score weights: distance 35% · size 25% · config 20% · recency 20%. Top-matched comps best support the ARV.
Projected returns pro-forma
-3.0% appreciation · 3.0% rent growth · sell at horizon
- IRR
- 20.6%
- Equity multiple
- 1.84×
- Total profit
- $11,200
- Equity at exit
- $7,082
- IRR
- 28.8%
- Equity multiple
- 3.57×
- Total profit
- $34,201
- Equity at exit
- $4,107
Cash invested: $13,300 (down + closing). Projections, not guarantees.
Landlord ↔ Tenant lean methodology
- Overall (STATE)
- 83 Strongly Landlord-Friendly
- State Iowa
- 83 Strongly Landlord-Friendly · R+6
- County
- — inherits STATE
- City
- — inherits STATE
ZIP-level market 52802
- Home prices YoY
- -28.3%
- Active inventory
- 68
- Price-to-rent
- 4.7×
Monthly cashflow live
- Estimated rent
- $848 medium interval (Pro) →
- Mortgage (P&I)
- −$249
- Tax from tax record
- −$105 /mo · $1,264/yr
- Insurance
- −$20
- HOA
- −$0
- Vacancy / Maint / Mgmt
- −$178
- Net cashflow
- $296
Break-even live
UW: 25.0% down · 7.5% · 30yr · 1.5% tax · 5.0% vac · 8.0% maint · 8.0% mgmt
Financing live
Cash to close
- Down payment
- $11,875
- Closing costs
- $1,425
- Reserves months
- —
- Total cash needed
- —
Loan-product check · same deal, 3 products live
Conventional
25% down · 7.5% · 30yr
- Down + closing
- —
- Monthly P&I
- —
- Monthly cashflow
- —
- DSCR
- —
- Eligible?
- —
Personal DTI + credit; lowest rate.
DSCR
20% down · 8.5% · 30yr
- Down + closing
- —
- Monthly P&I
- —
- Monthly cashflow
- —
- DSCR
- —
- Eligible?
- —
No personal income docs; deal must DSCR.
Hard money
10% down · 12.0% · 12mo
- Down + closing
- —
- Monthly P&I
- —
- Monthly cashflow
- —
- DSCR
- —
- Eligible?
- —
Short-term bridge; refi at stabilization.
Rent comps 2 comps
| Address | Beds | Baths | Sqft | Rent | $/sqft | DOM | Units | Dist |
|---|---|---|---|---|---|---|---|---|
| 3032 Indian Rd Unit 0 Davenport, IA | 2.0 | 1.0 | 600 | $900 | $1.50 | 44d | 1 | 0.25mi |
| 524 Lincoln Ct Unit 2 Davenport, IA | 1.0 | 1.0 | 600 | $850 | $1.42 | 21d | 1 | 1.07mi |
Listing history 17 events
-
2026-05-14status Pending
-
2026-04-16status Pending
-
2026-04-15historical
-
2026-04-09Active
-
2021-08-06historical
-
2021-08-06historical
-
2021-08-06historical
-
2021-08-06historical
-
2021-08-06historical
-
2012-02-24soldstatus $62,900
-
2012-02-24soldstatus $62,900
-
2012-01-09$62,900
-
2012-01-09$62,900
-
2010-03-12soldstatus $67,900
-
2010-03-12soldstatus $67,900
-
2010-01-27$67,900
-
2010-01-27$67,900
ⓘ Source: listings_history table (triggers on properties + properties_extension) + one-shot
backfill from property_details.listing_events for pre-trigger history.
Tax reassessment forecast IA · Partial reset (capped growth)
- Current annual tax
- $1,264 · $105/mo
- Projected year-2 tax
- $1,264 · $105/mo
- Expected delta
- $0/yr ($0/mo · 0.0%)
ⓘ Screening estimate from a state-policy table — verify with the county assessor before closing.
Climate risk First Street
- Flood 1/10 Low FEMA zone X (unshaded) · 0% chance over 30 yrs
- Wildfire 3/10 Moderate
- Heat 3/10 Moderate 7 d/yr ≥104°F today · 16 d/yr by 30 yrs out
- Wind 2/10 Low
- Air quality 3/10 Moderate 2 unhealthy d/yr today · 3 by 30 yrs out
Nearby sold comps map
Loading sold comps map…
Walkable amenities ~0.75 mi
Loading nearby amenities…
Taxation est. · year 1
- Rental income
- $10,182
- − Mortgage interest
- −$2,661
- − Property taxes
- −$1,264
- − Insurance
- −$238
- − Repairs & maintenance
- −$815
- − Management
- −$815
- − Depreciation
- −$1,382
- Taxable income
- $3,008
- Est. tax owed @ 24.0%
- −$722
- After-tax cash flow
- $2,831/yr
For passive investors: Depreciation is non-cash, so a rental often shows a tax loss while cash-flowing — sheltering income. Rental losses are passive: they offset passive income freely, and up to $25,000/yr can offset ordinary (W-2) income if you actively participate and your MAGI is under $100k (phasing out to $0 by $150k); unused losses carry forward. On sale, claimed depreciation is recaptured at up to 25%, and gains may owe capital-gains tax (a 1031 exchange can defer both). Figures are a year-1 estimate at your 24.0% rate — not tax advice; consult a CPA.
Schools (NCES district)
- District
- Davenport Community School District
- NCES district ID
- 1908580
- Math proficiency
- 43% ▼ -11.00%
- Reading proficiency
- 50% ▼ -3.00%
- Median HH income
- $46,157
- Composite
- 39.49/100
- National rank
- #3951
- State rank
- #288 of 289 in IA
Livability — Davenport
- Score
- 79/100
- State rank
- #126
- US rank
- #2312
Category grades
Schools grade is shown separately in the Schools card above.
Census & demographics
- Census place
- Davenport, IA
- County
- Scott County · 144,583 people
- City population
- 103,319
- Metro
- Davenport-Moline-Rock Island, IA-IL
- Population (ZIP)
- 9,466
- Household income
- $54,380
- Rent vs Own
- Severe rent burden
- 244.0
Population outlook (Scott County) Hauer SSP2
- Today (2025)
- 188,878 people
- By 2030
- 196,648 · +4.1%
- By 2040
- 210,860 · +11.6%
- By 2050
- 224,359 · +18.8%
- By 2075
- 258,884 · +37.1%
- By 2100
- 286,447 · +51.7%
Race, ethnicity, and origin ACS 2023
- Neighborhood character
- Predominantly White (71%)
- Race & ethnicity
- White 71% Hispanic / Latino 14% Two or more races 10% Black 5% Asian 1%
- Hispanic origin (detail)
- Mexican 13%
- Common ancestry
- Romanian 2% Lithuanian 1% Italian 1%
- Foreign-born
- 4% · Canada, Vietnam
- Languages at home
- 92% English-only · Spanish 7%
Political lean MEDSL · Scott
- 2024 margin
- Toss-up / Even · D 47.3% · R 51.2% · Other 1.4%
- 2008→2024 swing
- -18.4pp toward R · 2008: 14.6pp · 2024: -3.9pp
- All cycles
- 2024: R+3.9 2020: D+3.5 2016: D+1.4 2012: D+13.8 2008: D+14.6
Not yet ingested
- Civics
- —
Market trends
- HPI YoY
- ▼ -59.59%
- Current HPI
- 151.2076
- Rent YoY
- —
- Metro
- Davenport-Moline-Rock Island, IA-IL
- State GDP YoY
- ▲ 2.48%
- F500 in state
- 4
Industry mix (Fortune 500 HQ in IA)
| Industry | F500 HQs | Revenue |
|---|---|---|
| Financial Services | 1 | $16B |
|
||
| Retail / Convenience | 1 | $15B |
|
||
Price history
-7.4% since first listed17 events — show timeline
- 2026-05-14 Pending — MRED as Distributed by MLS Grid
- 2026-04-16 Pending — MRED as Distributed by MLS Grid
- 2026-04-15 Listing Removed — MRED as Distributed by MLS Grid
- 2026-04-09 Listed — MRED as Distributed by MLS Grid
- 2021-08-06 Listing Removed — RMLSA as Distributed by MLS Grid
- 2021-08-06 Listing Removed — RMLSA as Distributed by MLS Grid
- 2021-08-06 Listing Removed — RMLSA as Distributed by MLS Grid
- 2021-08-06 Listing Removed — RMLSA as Distributed by MLS Grid
- 2021-08-06 Listing Removed — RMLSA as Distributed by MLS Grid
- 2012-02-24 Sold (MLS) $62,900 MRED as Distributed by MLS Grid
- 2012-02-24 Sold (MLS) $62,900 RMLSA as Distributed by MLS Grid
- 2012-01-09 Listed $62,900 MRED as Distributed by MLS Grid
- 2012-01-09 Listed $62,900 RMLSA as Distributed by MLS Grid
- 2010-03-12 Sold (MLS) $67,900 RMLSA as Distributed by MLS Grid
- 2010-03-12 Sold (MLS) $67,900 MRED as Distributed by MLS Grid
- 2010-01-27 Listed $67,900 RMLSA as Distributed by MLS Grid
- 2010-01-27 Listed $67,900 MRED as Distributed by MLS Grid
Property tax history
+2.6%/yrLatest (2025): $1,264 · +5.9% YoY. Source: county tax records.
Cash-flow waterfall
monthlySold comps — $/sqft
last 12 mo · ≤1 miLoading sold comps…