 5-Plex
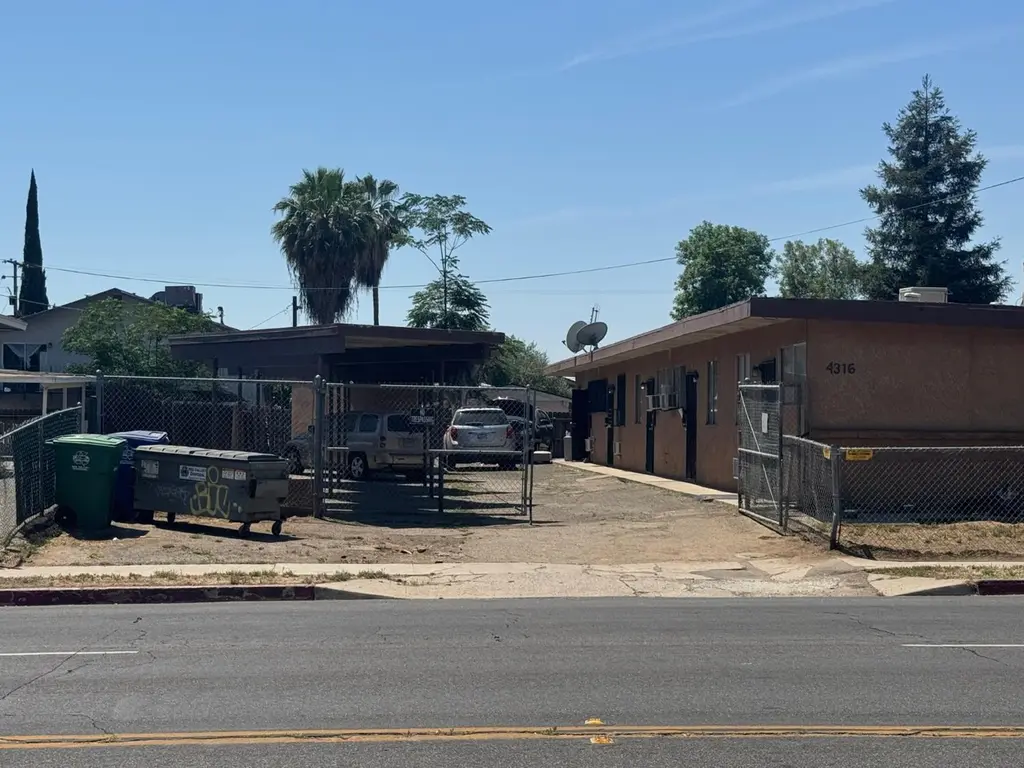
4316 E Olive Ave Unit A-E · Fresno, CA
Flood risk 1/10 · Minimal
- FEMA flood zone
- X (unshaded)
- Chance of flooding over 30 yrs
- 0.0%
- Est. flood insurance / yr
- $507 – $1,088
Fire risk 1/10 · Minimal
- Est. fire insurance / yr
- $659 – $1,223
Heat risk 8/10 · Major
- Hot days now (above 105°F)
- 7 days/yr
- Hot days in 30 yrs
- 17 days/yr
Wind risk 1/10 · Minimal
- Chance of severe wind over 30 yrs
- —
Air-quality risk 10/10 · Severe
- Unhealthy air days now
- 48 days/yr
- Unhealthy air days in 30 yrs
- 50 days/yr
Risk factors via First Street. Map © Google.
Why this score? — see what drove the D- grade
The composite is a weighted blend of 9 inputs, each scored 0–100. Each bar is that input's sub-score; the figure is the points it added to the 100-point composite (weight × sub-score).
- Cash flow +12.1/30.0
- ARV discount +7.5/15.0
- DSCR +3.6/10.0
- 1% rule +3.5/10.0
- Livability +3.1/5.0
- Schools +2.7/10.0
- Rent growth +2.3/5.0
- Condition / age +2.2/5.0
- Appreciation +0.0/10.0
$640,000
🖨 Deal sheet 📄 Offer letter ✓ Due diligence
Multi-family units
County records classify this as Multi-Family (5+ Unit). Listing-text estimate: 5 units. confirmed
5+ unit building — per-unit beds/baths from public records are typically unavailable; the breakdown below (if shown) is an estimate from the listing text.
Listing remarks
Central Fresno 5-Plex Investment OpportunityExcellent 5-unit multifamily property located in Central Fresno featuring five 1-bedroom, 1-bath units. This well-maintained income property offers strong cash flow with all units currently rented. Four of the five units are occupied by Section 8 tenants, providing reliable rental income. Rental IncomeUnit A: $1,116/monthUnit B: $1,232/monthUnit C: $1,157/monthUnit D: $1,182/monthUnit E: $1,315/monthTotal Gross Monthly Rent: $6,052Total Annual Gross Rent: $72,624Property HighlightsFive 1-bedroom, 1-bath units100% occupiedStrong cash flow investment opportunityFive covered carportsConvenient Central Fresno locationClose to grocery stores, gas stati
Key facts
- Strong cash flow
- 100 percent occupied
- 7,740 sq ft lot
Tags
Property features AI
Exterior
- Parking: Carport (has carport)
- Utilities: Electric service connected; Public sewer; Public utilities and natural gas connected
- Home design: Multi-family property; Rolled/Hot Mop roof
- Construction: Stucco construction; Concrete perimeter foundation; Built using public records as source for living area
- Exterior features: One-level property; Urban setting
Interior
- Bathrooms: Five bathrooms
- Heating & cooling: Floor or wall heat; Evaporative cooling; Wall/Window air conditioning units
- Interior features: Evaporative cooling and wall/window units; Floor or wall heating; No fireplace
Neighborhood map
What this means for you Summary
Snapshot
- This is a 5 × 1-bed/1-bath units multifamily listed at $640k. Condition is rated fair.
Deal economics
- At list price, monthly cash flow is $-140 ($-2k/yr) — negative. Per door: $-28/mo.
- To cash-flow at today's rent, offer at most $620k (3.2% below list).
- To meet the 1% rule (rent ≥ 1% of price), the offer needs to be $542k (15.3% below list).
- Recommended offer: $542k (15.3% below list) — sets the bar for 1% rule.
- Cap rate 6.0% vs local median 3.7% in Fresno — top-decile yield for the area; either an underpriced asset or a hidden risk that comps aren't pricing in. Stress-test before assuming the spread holds.
Location & tenants
- Location reads 62/100 on livability (#469 in CA) — a middle-class / working-renter tenant base. Strengths: commute A+, housing A+; Watch: amenities D+, employment D+, schools D.
- Fresno Unified (urban): math 18% / reading 47% proficiency, ranked #327 of 517 in CA (top 63%) — families likely to look elsewhere, expect single-tenant / working-renter base with shorter leases; 77% free/reduced lunch — lower-income household profile, screen leases tightly.
- Market conditions: Rents soft (-0.9%/yr); 67 active listings in the ZIP; 2,426 units permitted in Fresno County in 2024 (296 in 5+ unit buildings).
- At $5,421/mo this rent would consume 138% of the median local household income ($47k/yr) (locally 2958% of renters already pay >50% of income on rent) — very limited rent-growth headroom before tenants either downsize or default.
Forward outlook
- Local home prices are declining (-3.0%/yr); year-one equity from $4k of loan paydown is wiped out by about $19k of value loss. Plan a longer hold.
- Fresno County population projected at +11% by 2050 — modest demand growth; plan on rents tracking national, not racing it.
Negotiation context
- It's been on market 32 days — a 3% lower offer ($621k) is reasonable based on typical stale-listing flexibility.
Risks & watch-outs
- Climate carrying-cost: extreme-heat days projected 7→17/yr by 2055 (HVAC capex compounding) — expect insurance premiums to compound above CPI over the hold.
Questions for the listing agent
- What do current leases actually rent for vs. the listed asking? Can we see a recent rent roll and the last 12 months of T-12 income?
- It's been on market 32 days. Have you received any prior offers? Is the seller open to a 15% concession, seller financing, or rate buy-down credit?
- Can we see the unit-by-unit rent roll, current vacancy, and any below-market leases? What's the average tenancy length?
- What capital expenditures (roof, boiler, parking lot, exteriors) have been made in the last 5 years, and what's planned in the next 2?
- Have any recent inspections been done? Can we get a copy of the seller's disclosures and any deferred-maintenance estimates?
- Built in 1963 — when were the roof, HVAC, electrical panel, plumbing, and water heater last replaced?
- Is there a deadline driving the sale (1031 exchange, divorce, estate, relocation)? That informs how much negotiation room exists.
- Schools are D-rated, which usually means shorter tenancies and higher turnover. Who's the typical renter profile here, and what's been the actual vacancy rate?
- Crime grade is F in this area — have there been break-ins, vandalism, or insurance claims at this property in the last 3 years? What carrier currently insures it and at what premium?
- The area grade is low — what's the realistic commute time and amenity access for the typical tenant pool here? Any planned neighborhood developments (good or bad) we should know about?
- What's the average days-on-market for RENTAL listings here right now (not sales)? A rising rental-DOM trend means longer vacancies and softer asking-rent achievability than the comps imply.
- What's the recent tenant-quality profile in this submarket — average credit score on applications, eviction rate, late-payment / NSF rate, and stable-employment percentage? A property-management company in the area should have these aggregated.
- How much new apartment / multifamily construction is in the pipeline within 1–3 miles? Heavy new supply (>2% of stock underway) typically softens rents 12–24 months out; light construction supports rent growth.
Investment metrics
- 1% rule
- 0.85% ✗
- Cap rate
- 6.03%
- Cash-on-cash
- -0.94%
- DSCR
- 0.96
- GRM
- 9.8
CMA / ARV
No comps found within radius.
Projected returns pro-forma
-3.0% appreciation · 0.0% rent growth · sell at horizon
- IRR
- -21.3%
- Equity multiple
- 0.28×
- Total profit
- $-128,449
- Equity at exit
- $95,426
- IRR
- -23.9%
- Equity multiple
- -0.03×
- Total profit
- $-184,422
- Equity at exit
- $55,336
Cash invested: $179,200 (down + closing). Projections, not guarantees.
Landlord ↔ Tenant lean methodology
- Overall (STATE)
- 18 Strongly Tenant-Friendly
- State California
- 18 Strongly Tenant-Friendly · D+13
- County
- — inherits STATE
- City
- — inherits STATE
ZIP-level market 93702
- Rents YoY
- -0.9%
- Active inventory
- 67
- Price-to-rent
- 49.2×
Monthly cashflow live
- Estimated rent
- $5,421 medium interval (Pro) →
- Mortgage (P&I)
- −$3,356
- Tax est. 1.5%
- −$800 /mo · $9,600/yr
- Insurance
- −$267
- HOA
- −$0
- Vacancy / Maint / Mgmt
- −$1,138
- Net cashflow
- $-140
Break-even live
5-unit breakdown (identical units grouped — click to expand)
| Units | Beds | Baths | Est. rent |
|---|---|---|---|
| 5× units | 1 | 1 | $5,420 |
| #1 | 1 | 1 | $1,084 |
| #2 | 1 | 1 | $1,084 |
| #3 | 1 | 1 | $1,084 |
| #4 | 1 | 1 | $1,084 |
| #5 | 1 | 1 | $1,084 |
| Total (5 units) | $5,421 | ||
UW: 25.0% down · 7.5% · 30yr · 1.5% tax · 5.0% vac · 8.0% maint · 8.0% mgmt
Financing live
Cash to close
- Down payment
- $160,000
- Closing costs
- $19,200
- Reserves months
- —
- Total cash needed
- —
Loan-product check · same deal, 3 products live
Conventional
25% down · 7.5% · 30yr
- Down + closing
- —
- Monthly P&I
- —
- Monthly cashflow
- —
- DSCR
- —
- Eligible?
- —
Personal DTI + credit; lowest rate.
DSCR
20% down · 8.5% · 30yr
- Down + closing
- —
- Monthly P&I
- —
- Monthly cashflow
- —
- DSCR
- —
- Eligible?
- —
No personal income docs; deal must DSCR.
Hard money
10% down · 12.0% · 12mo
- Down + closing
- —
- Monthly P&I
- —
- Monthly cashflow
- —
- DSCR
- —
- Eligible?
- —
Short-term bridge; refi at stabilization.
Listing history 15 events
-
2026-06-18days on market $640,000 Active 32 DOM
-
2026-06-17days on market $640,000 Active 31 DOM
-
2026-06-16days on market $640,000 Active 30 DOM
-
2026-06-15days on market $640,000 Active 29 DOM
-
2026-06-13days on market $640,000 Active 27 DOM
-
2026-06-10days on market $640,000 Active 24 DOM
-
2026-06-09days on market $640,000 Active 23 DOM
-
2026-06-08days on market $640,000 Active 22 DOM
-
2026-06-07days on market $640,000 Active 21 DOM
-
2026-06-05days on market $640,000 Active 18 DOM
-
2026-06-03days on market $640,000 Active 17 DOM
-
2026-06-02days on market $640,000 Active 16 DOM
-
2026-06-01days on market $640,000 Active 15 DOM
-
2026-05-31days on market $640,000 Active 14 DOM
-
2026-05-17$675,000 Active
ⓘ Source: listings_history table (triggers on properties + properties_extension) + one-shot
backfill from property_details.listing_events for pre-trigger history.
Climate risk First Street
- Flood 1/10 Low FEMA zone X (unshaded) · 0% chance over 30 yrs
- Wildfire 1/10 Low
- Heat 8/10 Severe 7 d/yr ≥105°F today · 17 d/yr by 30 yrs out
- Wind 1/10 Low
- Air quality 10/10 Extreme 48 unhealthy d/yr today · 50 by 30 yrs out
Nearby sold comps map
Loading sold comps map…
Walkable amenities ~0.75 mi
Loading nearby amenities…
Taxation est. · year 1
- Rental income
- $65,052
- − Mortgage interest
- −$35,850
- − Property taxes
- −$9,600
- − Insurance
- −$3,200
- − Repairs & maintenance
- −$5,204
- − Management
- −$5,204
- − Depreciation
- −$18,618
- Taxable loss
- −$12,624
- Est. tax savings @ 24.0%
- +$3,030
- After-tax cash flow
- $1,346/yr
For passive investors: Depreciation is non-cash, so a rental often shows a tax loss while cash-flowing — sheltering income. Rental losses are passive: they offset passive income freely, and up to $25,000/yr can offset ordinary (W-2) income if you actively participate and your MAGI is under $100k (phasing out to $0 by $150k); unused losses carry forward. On sale, claimed depreciation is recaptured at up to 25%, and gains may owe capital-gains tax (a 1031 exchange can defer both). Figures are a year-1 estimate at your 24.0% rate — not tax advice; consult a CPA.
Condition & rehab AI · 12 photos
This 5-unit multifamily property requires moderate rehabilitation, focusing on fencing and landscaping improvements to enhance curb appeal and security, while also addressing HVAC maintenance for rental stability.
Repairs flagged
- Major fencing — Needs replacement to improve security and curb appeal
- Major landscaping — Overgrown yard needs trimming and planting
Value-add opportunities
- Both landscaping and fencing improvements — Improves curb appeal and security
- Rental HVAC maintenance — Ensures reliable heating and cooling for tenants
Renovation cost estimate screening
| Repair item | Severity | Est. cost |
|---|---|---|
| fencing · Needs replacement to improve security and curb appeal | Major | $15,000–50,000 |
| landscaping · Overgrown yard needs trimming and planting | Major | $15,000–50,000 |
| Total estimated repair cost · 2 items | $30,000–100,000 |
Value-add ROI direction
- Both landscaping and fencing improvements — Improves curb appeal and security ↑
- Rental HVAC maintenance — Ensures reliable heating and cooling for tenants ↑
ⓘ Cost ranges are severity-bucket heuristics (US national rule-of-thumb). Get contractor quotes + a written scope before underwriting a rehab budget.
Schools (NCES district)
- District
- Fresno Unified
- NCES district ID
- 0614550
- Math proficiency
- 18% ▼ -12.00%
- Reading proficiency
- 47% ▲ 9.00%
- Median HH income
- $36,095
- Composite
- 26.83/100
- National rank
- #7111
- State rank
- #327 of 517 in CA
Livability — Fresno
- Score
- 62/100
- State rank
- #469
- US rank
- #15907
Category grades
Schools grade is shown separately in the Schools card above.
Census & demographics
- Census place
- Fresno, CA
- County
- Fresno County · 834,801 people
- City population
- 593,114
- Metro
- Fresno, CA
- Population (ZIP)
- 43,875
- Household income
- $47,229
- Rent vs Own
- Severe rent burden
- 2958.0
Population outlook (Fresno County) Hauer SSP2
- Today (2025)
- 1,042,971 people
- By 2030
- 1,072,198 · +2.8%
- By 2040
- 1,122,408 · +7.6%
- By 2050
- 1,157,251 · +11.0%
- By 2075
- 1,182,575 · +13.4%
- By 2100
- 1,105,899 · +6.0%
Race, ethnicity, and origin ACS 2023
- Neighborhood character
- Predominantly Hispanic (75%)
- Race & ethnicity
- Hispanic / Latino 75% Two or more races 26% Asian 10% White 7% Black 4% Native American 2%
- Hispanic origin (detail)
- Mexican 71%
- Foreign-born
- 27% · Canada
- Languages at home
- 35% English-only · Spanish 54% Other Asian/Pacific 9%
Political lean MEDSL · Fresno
- 2024 margin
- Toss-up / Even · D 46.5% · R 50.9% · Other 2.6%
- 2008→2024 swing
- -6.5pp toward R · 2008: 2.1pp · 2024: -4.4pp
- All cycles
- 2024: R+4.4 2020: D+7.8 2016: D+3.9 2012: R+2.9 2008: D+2.1
Not yet ingested
- Civics
- —
Market trends
- HPI YoY
- ▼ -255.81%
- Current HPI
- 467.2799
- Rent YoY
- ▼ -0.94%
- Metro
- Fresno, CA
- State GDP YoY
- ▲ 3.21%
- F500 in state
- 116
Industry mix (Fortune 500 HQ in CA)
| Industry | F500 HQs | Revenue |
|---|---|---|
| Technology | 27 | $1,492B |
|
||
| Financial Services | 3 | $174B |
|
||
| Retail | 3 | $44B |
|
||
| Insurance | 3 | $26B |
|
||
| Media / Entertainment | 2 | $115B |
|
||
| Pharmaceuticals / Biotech | 2 | $62B |
|
||
Price history
1 event — show timeline
- 2026-05-17 Listed $675,000 FRESNOMLS
Cash-flow waterfall
monthlySold comps — $/sqft
last 12 mo · ≤1 miLoading sold comps…