 🏷️ Likely Rental
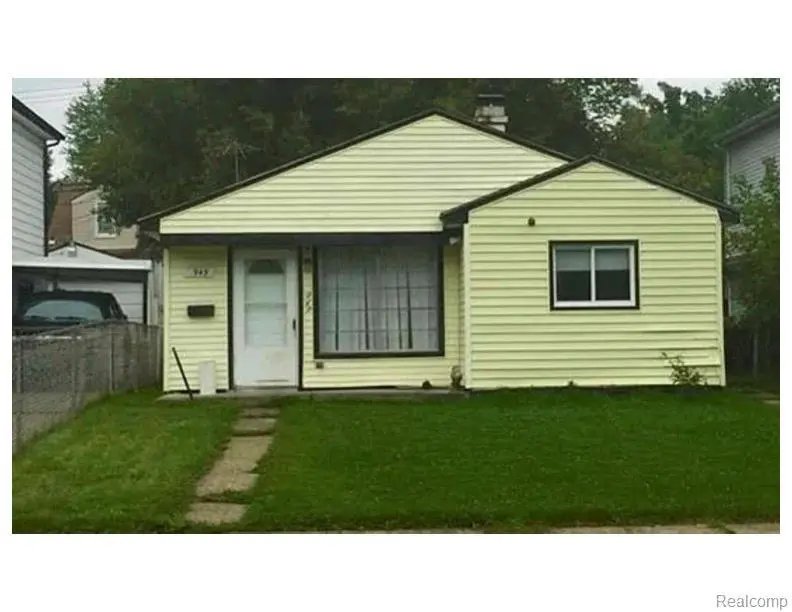
949 Kettering Ave · Pontiac, MI
Flood risk 1/10 · Minimal
- FEMA flood zone
- X (unshaded)
- Chance of flooding over 30 yrs
- 0.0%
- Est. flood insurance / yr
- $473 – $860
Fire risk 1/10 · Minimal
- Est. fire insurance / yr
- $784 – $1,456
Heat risk 2/10 · Minimal
- Hot days now (above 97°F)
- 7 days/yr
- Hot days in 30 yrs
- 15 days/yr
Wind risk 2/10 · Minimal
- Chance of severe wind over 30 yrs
- —
Air-quality risk 3/10 · Minor
- Unhealthy air days now
- 2 days/yr
- Unhealthy air days in 30 yrs
- 4 days/yr
Risk factors via First Street. Map © Google.
Why this score? — see what drove the B grade
The composite is a weighted blend of 9 inputs, each scored 0–100. Each bar is that input's sub-score; the figure is the points it added to the 100-point composite (weight × sub-score).
- Cash flow +30.0/30.0
- ARV discount +15.0/15.0
- DSCR +10.0/10.0
- 1% rule +8.0/10.0
- Rent growth +3.7/5.0
- Livability +3.2/5.0
- Condition / age +2.5/5.0
- Schools +1.0/10.0
- Appreciation +0.0/10.0
$108,700
🖨 Deal sheet 📄 Offer letter ✓ Due diligence
Listing remarks MLS
Charming 1,100 sq ft ranch on a quiet street. Perfect for future owner occupant. Tenant occupied - 24-hour notice required. Do not disturb tenant.
Key facts
- 3,920 sq ft lot
- Built 1956
- Listed 9 days
Property features AI
Finance
- Other: Subdivision: NEWTON ESTATE; Directions: South off of Perry or north off E Madison (east of Perry); Cross streets: Perry & Madison
Exterior
- Parking: No garage
- Utilities: Public water; Sewer available
- Home design: Single-family residence; One story; Entry at ground level
- Construction: Vinyl siding; Slab foundation
- Exterior features: Paved road access; Lot approximately 0.09 acres (40 x 102.16)
Interior
- Bathrooms: One full bathroom
- Heating & cooling: Forced air heating (natural gas); No central air conditioning
- Interior features: Five total rooms; Ground-level entry
Neighborhood map
What this means for you Summary
Snapshot
- This is a 3-bed/1.0-bath single-family listed at $109k.
Deal economics
- At list price, monthly cash flow is $435 ($5k/yr) — positive.
- The deal already cash-flows at list — no discount required.
- Meets the 1% rule at list price ($1k rent vs $109k).
- Cap rate 11.1% vs local median 6.7% in Pontiac — top-decile yield for the area; either an underpriced asset or a hidden risk that comps aren't pricing in. Stress-test before assuming the spread holds.
Location & tenants
- Location reads 64/100 on livability (#499 in MI) — a middle-class / working-renter tenant base. Strengths: commute A+, cost of living A+, housing A+; Watch: health & safety D, schools F, crime F.
- Pontiac City School District (urban): math 8% / reading 17% proficiency, ranked #514 of 540 in MI (top 95%) — low school quality limits family demand, transient renter base, plan for 1-2y turnover; 81% free/reduced lunch — lower-income household profile, screen leases tightly.
- Market conditions: Rents rising fast (+4.7%/yr); 83 active listings in the ZIP; 15 comparable units currently listed for rent nearby; rentals at typical pace (median 25d on market — plan ~3-4 weeks tenant-placement turnaround); 47% of comp listings sitting > 30 days — soft ceiling on asking rent; 2,614 units permitted in Oakland County in 2024 (721 in 5+ unit buildings).
- This rent runs 36% of the median local income ($48k/yr) — at the standard rent-burdened threshold; future hikes will face affordability resistance.
Forward outlook
- Local home prices are declining (-3.0%/yr); year-one equity from $752 of loan paydown is wiped out by about $3k of value loss. Plan a longer hold.
- Oakland County population projected at +10% by 2050 — modest demand growth; plan on rents tracking national, not racing it.
- At projected returns (-3.0% appreciation + 4.7% rent growth), your $30k cash investment doubles in ~7 years — after that, you're playing with house money.
Negotiation context
- Only 9 days on market — expect competitive offers; lowballing is unlikely to land.
- 11 sale attempts since 23y ago with the ask held roughly flat each time — persistent listings suggest the price (not the market) is what's stuck; bring a comps-based counter.
- Current owner paid $12k; list at $109k implies a 806% gain — meaningful room to come down on a strong offer.
Risks & watch-outs
- Watch-outs: built in 1956 — expect roof / HVAC / electrical / plumbing capex.
Questions for the listing agent
- Built in 1956 — when were the roof, HVAC, electrical panel, plumbing, and water heater last replaced?
- Is there a deadline driving the sale (1031 exchange, divorce, estate, relocation)? That informs how much negotiation room exists.
- Schools are F-rated, which usually means shorter tenancies and higher turnover. Who's the typical renter profile here, and what's been the actual vacancy rate?
- Crime grade is F in this area — have there been break-ins, vandalism, or insurance claims at this property in the last 3 years? What carrier currently insures it and at what premium?
- What's the average days-on-market for RENTAL listings here right now (not sales)? A rising rental-DOM trend means longer vacancies and softer asking-rent achievability than the comps imply.
- What's the recent tenant-quality profile in this submarket — average credit score on applications, eviction rate, late-payment / NSF rate, and stable-employment percentage? A property-management company in the area should have these aggregated.
- How much new for-sale + rental construction is in the pipeline within 1–3 miles? Heavy new supply typically softens prices + rents 12–24 months out; constrained supply supports both.
Investment metrics
- 1% rule
- 1.30% ✓
- Cap rate
- 11.10%
- Cash-on-cash
- 17.16%
- DSCR
- 1.76
- GRM
- 6.4
CMA / ARV
- ARV (on-the-fly)
- $161,622
- Comps found
- 12
Show comp detail 12 sales within ~0.75 mi
| Address | Dist | Beds/Ba | Sqft | Sold | Price | $/sf | Match |
|---|---|---|---|---|---|---|---|
| 933 Cameron Ave | 0.11mi | 3/1.0 | 1,108 (+0%) | 10mo | $104,000 | $94 | 87 |
| 1005 Emerson Ave | 0.12mi | 3/1.0 | 1,030 (-7%) | 3mo | $150,000 | $146 | 81 |
| 811 Melrose St | 0.34mi | 3/1.0 | 1,108 (+0%) | 6mo | $89,500 | $81 | 79 |
| 962 Kettering Ave | 0.04mi | 3/1.5 | 1,040 (-6%) | 10mo | $155,000 | $149 | 78 |
| 735 Cameron Ave | 0.42mi | 3/1.0 | 1,102 (-0%) | 5mo | $142,000 | $129 | 75 |
| 715 Kenilworth Ave | 0.47mi | 3/1.0 | 1,102 (-0%) | 3mo | $130,000 | $118 | 75 |
| 791 Cameron Ave | 0.32mi | 4/2.0 (+1) | 1,104 (-0%) | 8mo | $202,500 | $183 | 69 |
| 853 Melrose St | 0.28mi | 3/1.0 | 949 (-14%) | 9mo | $123,500 | $130 | 56 |
| 778 4th Ave | 0.61mi | 3/1.5 | 1,053 (-5%) | 7mo | $170,000 | $161 | 56 |
| 710 Melrose St | 0.49mi | 3/1.0 | 952 (-14%) | 3mo | $142,000 | $149 | 52 |
| 794 Clara Ave | 0.66mi | 3/2.0 | 1,018 (-8%) | 6mo | $159,900 | $157 | 46 |
| 674 Parkwood Ave | 0.66mi | 3/1.0 | 961 (-13%) | 3mo | $100,000 | $104 | 44 |
Match score weights: distance 35% · size 25% · config 20% · recency 20%. Top-matched comps best support the ARV.
Projected returns pro-forma
-3.0% appreciation · 4.73% rent growth · sell at horizon
- IRR
- 10.3%
- Equity multiple
- 1.41×
- Total profit
- $12,590
- Equity at exit
- $16,208
- IRR
- 20.7%
- Equity multiple
- 2.88×
- Total profit
- $57,235
- Equity at exit
- $9,398
Cash invested: $30,436 (down + closing). Projections, not guarantees.
Landlord ↔ Tenant lean methodology
- Overall (STATE)
- 62 Landlord-Friendly
- State Michigan
- 62 Landlord-Friendly · EVEN
- County
- — inherits STATE
- City
- — inherits STATE
ZIP-level market 48340
- Rents YoY
- 4.7%
- Active inventory
- 83
- Price-to-rent
- 6.4×
Monthly cashflow live
- Estimated rent
- $1,417 high interval (Pro) →
- Mortgage (P&I)
- −$570
- Tax from tax record
- −$69 /mo · $825/yr
- Insurance
- −$45
- HOA
- −$0
- Vacancy / Maint / Mgmt
- −$298
- Net cashflow
- $435
Break-even live
UW: 25.0% down · 7.5% · 30yr · 1.5% tax · 5.0% vac · 8.0% maint · 8.0% mgmt
Financing live
Cash to close
- Down payment
- $27,175
- Closing costs
- $3,261
- Reserves months
- —
- Total cash needed
- —
Loan-product check · same deal, 3 products live
Conventional
25% down · 7.5% · 30yr
- Down + closing
- —
- Monthly P&I
- —
- Monthly cashflow
- —
- DSCR
- —
- Eligible?
- —
Personal DTI + credit; lowest rate.
DSCR
20% down · 8.5% · 30yr
- Down + closing
- —
- Monthly P&I
- —
- Monthly cashflow
- —
- DSCR
- —
- Eligible?
- —
No personal income docs; deal must DSCR.
Hard money
10% down · 12.0% · 12mo
- Down + closing
- —
- Monthly P&I
- —
- Monthly cashflow
- —
- DSCR
- —
- Eligible?
- —
Short-term bridge; refi at stabilization.
Rent comps 15 comps
| Address | Beds | Baths | Sqft | Rent | $/sqft | DOM | Units | Dist |
|---|---|---|---|---|---|---|---|---|
| 750 Scottwood St Pontiac, MI | 3.0 | 1.0 | 920 | $1,395 | $1.52 | 12d | 1 | 0.49mi |
| 505 Old Oak Ct Pontiac, MI | 2.0 | 1.0 | 1100 | $1,299 | $1.18 | 44d | 1 | 0.64mi |
| 695 1st Ave Pontiac, MI | 3.0 | 1.0 | 986 | $1,295 | $1.31 | 44d | 1 | 0.68mi |
| 505 Old Oak Ct Unit 7 Pontiac, MI | 2.0 | 1.0 | 950 | $1,279 | $1.35 | 44d | 1 | 0.68mi |
| 957 Perry St Pontiac, MI | 1.0–3.0 | 1.0 | 835 | $1,099 | $1.32 | 44d | 1 | 0.77mi |
| 611 E Madison Ave Pontiac, MI | 3.0 | 1.5 | 950 | $1,395 | $1.47 | 44d | 1 | 0.79mi |
| 863 Amanda Ln Pontiac, MI | 3.0 | 2.0 | 1434 | $1,800 | $1.26 | 20d | 1 | 0.94mi |
| 860 Walton Blvd Pontiac, MI | 2.0 | 2.0 | 1025 | $1,295 | $1.26 | 2d | 3 | 0.94mi |
| 1221 Colony Ln Pontiac, MI | 1.0–2.0 | 1.0–1.5 | 950 | $1,250 | $1.32 | 2d | 3 | 0.99mi |
| 672 Linda Vista Dr Pontiac, MI | 3.0 | 1.0 | 900 | $1,500 | $1.67 | 3d | 1 | 1.04mi |
| 1173 Featherstone Rd Pontiac, MI | 3.0 | 1.5 | 970 | $1,495 | $1.54 | 24d | 1 | 1.06mi |
| 188 Vernon Dr Pontiac, MI | 3.0 | 1.0 | 1100 | $1,500 | $1.36 | 24d | 1 | 1.14mi |
| 264 Nelson St Pontiac, MI | 3.0 | 1.0 | 1478 | $1,590 | $1.08 | 44d | 1 | 1.30mi |
| 16 Victory Dr Unit 18 Pontiac, MI | 2.0 | 1.0 | 1118 | $1,150 | $1.03 | 44d | 1 | 1.37mi |
| 16 Victory Dr Unit 18 Pontiac, MI | 2.0 | 1.0 | 1114 | $1,150 | $1.03 | 24d | 1 | 1.37mi |
Listing history 25 events
-
2026-04-18status Pending 146-char remark
Show marketing remark (146 chars)
Charming 1,100 sq ft ranch on a quiet street. Perfect for future owner occupant. Tenant occupied - 24-hour notice required. Do not disturb tenant.
-
2026-04-18status Pending
Show marketing remark (146 chars)
Charming 1,100 sq ft ranch on a quiet street. Perfect for future owner occupant. Tenant occupied - 24-hour notice required. Do not disturb tenant.
-
2026-04-09$108,700 Active
Show marketing remark (146 chars)
Charming 1,100 sq ft ranch on a quiet street. Perfect for future owner occupant. Tenant occupied - 24-hour notice required. Do not disturb tenant.
-
2026-04-09$108,700 Active 146-char remark
Show marketing remark (146 chars)
Charming 1,100 sq ft ranch on a quiet street. Perfect for future owner occupant. Tenant occupied - 24-hour notice required. Do not disturb tenant.
-
2008-07-25soldstatus $12,000 214-char remark
Show marketing remark (214 chars)
Lender REO - Great opportunity on this ranch home with good exterior appeal and fenced yard. Home is in need of interior repairs, but priced to compensate. See "agent only" remarks for offer instructions.
-
2008-07-25soldstatus $12,000
Show marketing remark (214 chars)
Lender REO - Great opportunity on this ranch home with good exterior appeal and fenced yard. Home is in need of interior repairs, but priced to compensate. See "agent only" remarks for offer instructions.
-
2008-07-24historical
-
2008-05-27$14,900 214-char remark
Show marketing remark (214 chars)
Lender REO - Great opportunity on this ranch home with good exterior appeal and fenced yard. Home is in need of interior repairs, but priced to compensate. See "agent only" remarks for offer instructions.
-
2008-05-27$14,900
Show marketing remark (214 chars)
Lender REO - Great opportunity on this ranch home with good exterior appeal and fenced yard. Home is in need of interior repairs, but priced to compensate. See "agent only" remarks for offer instructions.
-
2008-05-20historical
-
2008-05-20historical
-
2007-12-26$14,900
-
2007-12-26$14,900
-
2007-05-30historical
-
2007-01-30$67,500
-
2006-11-16historical
-
2006-10-24$72,500
-
2006-10-22historical
-
2006-07-22$69,997
-
2003-12-05soldstatus $66,000
-
2003-11-28soldstatus $66,000
-
2003-11-28soldstatus $66,000
-
2003-11-04historical
-
2003-06-27$69,900
-
2003-06-27$69,900
ⓘ Source: listings_history table (triggers on properties + properties_extension) + one-shot
backfill from property_details.listing_events for pre-trigger history.
Tax reassessment forecast MI · Partial reset (capped growth)
- Current annual tax
- $825 · $69/mo
- Projected year-2 tax
- $1,250 · $104/mo
- Expected delta
- +$424/yr (+$35/mo · 51.4%)
ⓘ Screening estimate from a state-policy table — verify with the county assessor before closing.
Climate risk First Street
- Flood 1/10 Low FEMA zone X (unshaded) · 0% chance over 30 yrs
- Wildfire 1/10 Low
- Heat 2/10 Low 7 d/yr ≥97°F today · 15 d/yr by 30 yrs out
- Wind 2/10 Low
- Air quality 3/10 Moderate 2 unhealthy d/yr today · 4 by 30 yrs out
Nearby sold comps map
Loading sold comps map…
Walkable amenities ~0.75 mi
Loading nearby amenities…
Taxation est. · year 1
- Rental income
- $17,001
- − Mortgage interest
- −$6,089
- − Property taxes
- −$825
- − Insurance
- −$544
- − Repairs & maintenance
- −$1,360
- − Management
- −$1,360
- − Depreciation
- −$3,162
- Taxable income
- $3,661
- Est. tax owed @ 24.0%
- −$879
- After-tax cash flow
- $4,343/yr
For passive investors: Depreciation is non-cash, so a rental often shows a tax loss while cash-flowing — sheltering income. Rental losses are passive: they offset passive income freely, and up to $25,000/yr can offset ordinary (W-2) income if you actively participate and your MAGI is under $100k (phasing out to $0 by $150k); unused losses carry forward. On sale, claimed depreciation is recaptured at up to 25%, and gains may owe capital-gains tax (a 1031 exchange can defer both). Figures are a year-1 estimate at your 24.0% rate — not tax advice; consult a CPA.
Schools (NCES district)
- District
- Pontiac City School District
- NCES district ID
- 2628740
- Math proficiency
- 8% ▼ -5.00%
- Reading proficiency
- 17% ▼ -3.00%
- Median HH income
- $33,888
- Composite
- 10.12/100
- National rank
- #9802
- State rank
- #514 of 540 in MI
Livability — Pontiac
- Score
- 64/100
- State rank
- #499
- US rank
- #14703
Category grades
Schools grade is shown separately in the Schools card above.
Census & demographics
- Census place
- Pontiac, MI
- County
- Oakland County · 1,009,092 people
- City population
- 44,593
- Metro
- Detroit-Warren-Dearborn, MI
- Population (ZIP)
- 25,669
- Household income
- $47,891
- Rent vs Own
- Severe rent burden
- 1460.0
Population outlook (Oakland County) Hauer SSP2
- Today (2025)
- 1,335,747 people
- By 2030
- 1,375,100 · +2.9%
- By 2040
- 1,435,385 · +7.5%
- By 2050
- 1,469,250 · +10.0%
- By 2075
- 1,531,946 · +14.7%
- By 2100
- 1,450,485 · +8.6%
Race, ethnicity, and origin ACS 2023
- Neighborhood character
- Highly diverse neighborhood (Simpson 0.73)
- Race & ethnicity
- Black 31% Hispanic / Latino 31% White 29% Two or more races 22% Asian 4%
- Hispanic origin (detail)
- Mexican 18% Puerto Rican 7%
- Common ancestry
- Lithuanian 2% Romanian 2% Serbian 1%
- Foreign-born
- 11% · Canada, China
- Languages at home
- 74% English-only · Spanish 23% Other Asian/Pacific 2% Chinese 1%
Political lean MEDSL · Oakland
- 2024 margin
- D (+10.6) · D 54.4% · R 43.8% · Other 1.9%
- 2008→2024 swing
- -3.9pp toward R · 2008: 14.5pp · 2024: 10.6pp
- All cycles
- 2024: D+10.6 2020: D+14.1 2016: D+8.1 2012: D+8.1 2008: D+14.5
Not yet ingested
- Civics
- —
Market trends
- HPI YoY
- ▼ -295.80%
- Current HPI
- 177.961
- Rent YoY
- ▲ 4.73%
- Metro
- Detroit-Warren-Dearborn, MI
- State GDP YoY
- ▲ 1.37%
- F500 in state
- 28
Industry mix (Fortune 500 HQ in MI)
| Industry | F500 HQs | Revenue |
|---|---|---|
| Automotive Parts | 3 | $48B |
|
||
| Automotive | 2 | $372B |
|
||
| Chemicals | 1 | $45B |
|
||
| Automotive Retail | 1 | $29B |
|
||
| Healthcare / Medical Devices | 1 | $23B |
|
||
| Automotive Technology | 1 | $20B |
|
||
Price history
+55.5% since first listed25 events — show timeline
- 2026-04-18 Pending — MiRealSource-MiMLS
- 2026-04-18 Pending — REALCOMP
- 2026-04-09 Listed $108,700 REALCOMP
- 2026-04-09 Listed $108,700 MiRealSource-MiMLS
- 2008-07-25 Sold (MLS) $12,000 MiRealSource-MiMLS
- 2008-07-25 Sold (MLS) $12,000 REALCOMP
- 2008-07-24 Listing Removed — MiRealSource-MiMLS
- 2008-05-27 Listed $14,900 MiRealSource-MiMLS
- 2008-05-27 Listed $14,900 REALCOMP
- 2008-05-20 Listing Removed — REALCOMP
- 2008-05-20 Listing Removed — MiRealSource-MiMLS
- 2007-12-26 Listed $14,900 REALCOMP
- 2007-12-26 Listed $14,900 MiRealSource-MiMLS
- 2007-05-30 Listing Removed — REALCOMP
- 2007-01-30 Listed $67,500 REALCOMP
- 2006-11-16 Listing Removed — REALCOMP
- 2006-10-24 Listed $72,500 REALCOMP
- 2006-10-22 Listing Removed — REALCOMP
- 2006-07-22 Listed $69,997 REALCOMP
- 2003-12-05 Sold (Public Records) $66,000 Public Records
- 2003-11-28 Sold (MLS) $66,000 MiRealSource-MiMLS
- 2003-11-28 Sold (MLS) $66,000 REALCOMP
- 2003-11-04 Listing Removed — MiRealSource-MiMLS
- 2003-06-27 Listed $69,900 MiRealSource-MiMLS
- 2003-06-27 Listed $69,900 REALCOMP
Property tax history
-0.5%/yrLatest (2025): $825 · +2.7% YoY. Source: county tax records.
Cash-flow waterfall
monthlySold comps — $/sqft
last 12 mo · ≤1 miLoading sold comps…