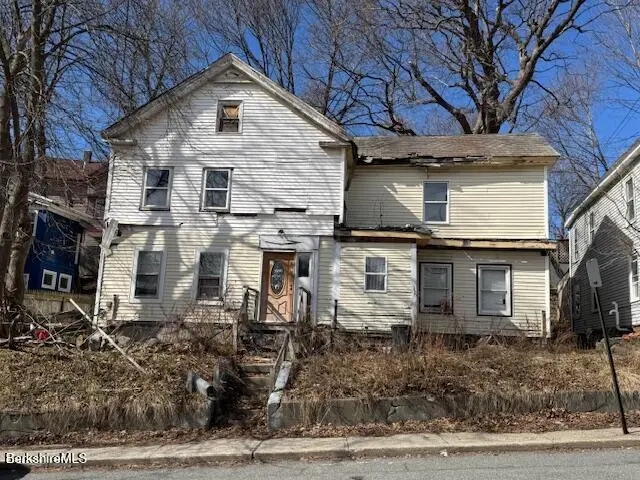
135 E Quincy St · North Adams, MA
Flood risk 1/10 · Minimal
- FEMA flood zone
- X
- Chance of flooding over 30 yrs
- 0.0%
- Est. flood insurance / yr
- $473 – $860
Fire risk 3/10 · Minor
- Est. fire insurance / yr
- $915 – $1,699
Heat risk 2/10 · Minimal
- Hot days now (above 92°F)
- 8 days/yr
- Hot days in 30 yrs
- 19 days/yr
Wind risk 4/10 · Minor
- Chance of severe wind over 30 yrs
- 9.0%
Air-quality risk 2/10 · Minimal
- Unhealthy air days now
- 0 days/yr
- Unhealthy air days in 30 yrs
- 1 days/yr
Risk factors via First Street. Map © Google.
Why this score? — see what drove the D grade
The composite is a weighted blend of 9 inputs, each scored 0–100. Each bar is that input's sub-score; the figure is the points it added to the 100-point composite (weight × sub-score).
- Cash flow +15.0/30.0
- ARV discount +7.5/15.0
- 1% rule +5.0/10.0
- DSCR +5.0/10.0
- Livability +2.8/5.0
- Rent growth +2.5/5.0
- Condition / age +2.5/5.0
- Appreciation +1.9/10.0
- Schools +1.8/10.0
$25,000
🖨 Deal sheet 📄 Offer letter ✓ Due diligence
Listing remarks MLS
Attention investors! This distressed residential property in North Adams presents an opportunity to build instant equity. Situated in the heart of the Northern Berkshires, this home is being offered AS-IS WHERE-IS. North Adams is a thriving arts and culture destination, home to MASS MoCA and surrounded by the scenic beauty of the Berkshire Mountains. With a growing tourism economy and increasing demand for housing, this is your chance to get in at a ground-floor price. Close to downtown shops, restaurants, and cultural attractions with easy access to outdoor recreation, hiking, and skiing. Schedule your showing today!
Key facts
- Skiing
- Northern berkshires
- Hiking
Tags
Neighborhood map
What this means for you Summary
Snapshot
- This is a 5-bed/2.0-bath single-family listed at $25k.
Deal economics
- At list price, monthly cash flow is $2k ($19k/yr) — positive.
- The deal already cash-flows at list — no discount required.
- Meets the 1% rule at list price ($2k rent vs $25k).
- Recommended offer: $25k (1.5% below list) — sets the bar for market timing.
- Cap rate 83.2% vs local median 5.8% in North Adams — top-decile yield for the area; either an underpriced asset or a hidden risk that comps aren't pricing in. Stress-test before assuming the spread holds.
Location & tenants
- Location reads 55/100 on livability (#242 in MA) — a working-class tenant base; expect higher turnover. Strengths: housing A+, cost of living A-; Watch: employment C-, health & safety D, schools F.
- North Adams (town): math 14% / reading 29% proficiency, ranked #291 of 302 in MA (top 96%) — low school quality limits family demand, transient renter base, plan for 1-2y turnover.
- Market conditions: 99 active listings in the ZIP; 130 units permitted in Berkshire County in 2024 (10 in 5+ unit buildings).
Forward outlook
- Local home prices are declining (-3.0%/yr); year-one equity from $173 of loan paydown is wiped out by about $750 of value loss. Plan a longer hold.
- Berkshire County population projected at -24% by 2050 — secular population decline; favor cash flow + early exit over multi-decade hold.
- At projected returns (-3.0% appreciation + 3.0% rent growth), your $7k cash investment doubles in ~1 year — after that, you're playing with house money.
Negotiation context
- It's been on market 16 days — a 2% lower offer ($25k) is reasonable based on typical stale-listing flexibility.
- 4 sale attempts since 20y ago with the ask held roughly flat each time — persistent listings suggest the price (not the market) is what's stuck; bring a comps-based counter.
Risks & watch-outs
- Watch-outs: built in 1900 — expect roof / HVAC / electrical / plumbing capex.
Questions for the listing agent
- Built in 1900 — when were the roof, HVAC, electrical panel, plumbing, and water heater last replaced?
- Is there a deadline driving the sale (1031 exchange, divorce, estate, relocation)? That informs how much negotiation room exists.
- Schools are F-rated, which usually means shorter tenancies and higher turnover. Who's the typical renter profile here, and what's been the actual vacancy rate?
- Crime grade is F in this area — have there been break-ins, vandalism, or insurance claims at this property in the last 3 years? What carrier currently insures it and at what premium?
- The area grade is low — what's the realistic commute time and amenity access for the typical tenant pool here? Any planned neighborhood developments (good or bad) we should know about?
- What's the average days-on-market for RENTAL listings here right now (not sales)? A rising rental-DOM trend means longer vacancies and softer asking-rent achievability than the comps imply.
- What's the recent tenant-quality profile in this submarket — average credit score on applications, eviction rate, late-payment / NSF rate, and stable-employment percentage? A property-management company in the area should have these aggregated.
- How much new for-sale + rental construction is in the pipeline within 1–3 miles? Heavy new supply typically softens prices + rents 12–24 months out; constrained supply supports both.
Investment metrics
- 1% rule
- 8.98% ✓
- Cap rate
- 83.17%
- Cash-on-cash
- 274.54%
- DSCR
- 13.22
- GRM
- 0.9
CMA / ARV
- ARV (median comp)
- $241,691
- List price
- $25,000
- Delta
- -89.66%
- Verdict
- UNDERPRICED
- Comps
- 20 within 1.0 mi
Show comp detail 10 sales within ~0.75 mi
| Address | Dist | Beds/Ba | Sqft | Sold | Price | $/sf | Match |
|---|---|---|---|---|---|---|---|
| 135 E Quincy St | 0.00mi | 5/2.0 | 2,460 (0%) | 0mo | $30,000 | $12 | 100 |
| 50 Gallup St | 0.22mi | 4/2.0 (-1) | 2,452 (-0%) | 5mo | $244,900 | $100 | 80 |
| 67 Cherry St | 0.21mi | 4/2.0 (-1) | 2,210 (-10%) | 5mo | $410,000 | $186 | 64 |
| 284 Franklin St | 0.66mi | 4/2.0 (-1) | 2,525 (+3%) | 1mo | $372,000 | $147 | 59 |
| 541 E Main St | 0.28mi | 4/2.0 (-1) | 2,200 (-11%) | 11mo | $230,000 | $105 | 55 |
| 80 Rich St | 0.61mi | 4/2.5 (-1) | 2,512 (+2%) | 10mo | $487,000 | $194 | 53 |
| 41 Prospect St | 0.36mi | 4/2.0 (-1) | 2,172 (-12%) | 10mo | $81,500 | $38 | 50 |
| 80 Elmwood Ave | 0.31mi | 5/3.5 | 2,777 (+13%) | 16mo | $140,500 | $51 | 45 |
| 404 Church St | 0.53mi | 4/1.5 (-1) | 2,272 (-8%) | 22mo | $340,000 | $150 | 38 |
| 225 Eagle St | 0.50mi | 4/2.0 (-1) | 2,796 (+14%) | 14mo | $279,000 | $100 | 38 |
Match score weights: distance 35% · size 25% · config 20% · recency 20%. Top-matched comps best support the ARV.
Projected returns pro-forma
-3.0% appreciation · 3.0% rent growth · sell at horizon
- IRR
- —
- Equity multiple
- 15.00×
- Total profit
- $97,984
- Equity at exit
- $3,728
- IRR
- —
- Equity multiple
- 31.97×
- Total profit
- $216,803
- Equity at exit
- $2,162
Cash invested: $7,000 (down + closing). Projections, not guarantees.
Landlord ↔ Tenant lean methodology
- Overall (STATE)
- 20 Strongly Tenant-Friendly
- State Massachusetts
- 20 Strongly Tenant-Friendly · D+15
- County
- — inherits STATE
- City
- — inherits STATE
ZIP-level market 01247
- Home prices YoY
- -2.0%
- Active inventory
- 99
- Price-to-rent
- 0.9×
Monthly cashflow live
- Estimated rent
- $2,246 medium interval (Pro) →
- Mortgage (P&I)
- −$131
- Tax est. 1.5%
- −$31 /mo · $375/yr
- Insurance
- −$10
- HOA
- −$0
- Vacancy / Maint / Mgmt
- −$472
- Net cashflow
- $1,602
Break-even live
UW: 25.0% down · 7.5% · 30yr · 1.5% tax · 5.0% vac · 8.0% maint · 8.0% mgmt
Financing live
Cash to close
- Down payment
- $6,250
- Closing costs
- $750
- Reserves months
- —
- Total cash needed
- —
Loan-product check · same deal, 3 products live
Conventional
25% down · 7.5% · 30yr
- Down + closing
- —
- Monthly P&I
- —
- Monthly cashflow
- —
- DSCR
- —
- Eligible?
- —
Personal DTI + credit; lowest rate.
DSCR
20% down · 8.5% · 30yr
- Down + closing
- —
- Monthly P&I
- —
- Monthly cashflow
- —
- DSCR
- —
- Eligible?
- —
No personal income docs; deal must DSCR.
Hard money
10% down · 12.0% · 12mo
- Down + closing
- —
- Monthly P&I
- —
- Monthly cashflow
- —
- DSCR
- —
- Eligible?
- —
Short-term bridge; refi at stabilization.
Listing history 10 events
-
2026-05-02status Pending 625-char remark
Show marketing remark (625 chars)
Attention investors! This distressed residential property in North Adams presents an opportunity to build instant equity. Situated in the heart of the Northern Berkshires, this home is being offered AS-IS WHERE-IS. North Adams is a thriving arts and culture destination, home to MASS MoCA and surrounded by the scenic beauty of the Berkshire Mountains. With a growing tourism economy and increasing demand for housing, this is your chance to get in at a ground-floor price. Close to downtown shops, restaurants, and cultural attractions with easy access to outdoor recreation, hiking, and skiing. Schedule your showing today!
-
2026-04-15$25,000 Active 625-char remark
Show marketing remark (625 chars)
Attention investors! This distressed residential property in North Adams presents an opportunity to build instant equity. Situated in the heart of the Northern Berkshires, this home is being offered AS-IS WHERE-IS. North Adams is a thriving arts and culture destination, home to MASS MoCA and surrounded by the scenic beauty of the Berkshire Mountains. With a growing tourism economy and increasing demand for housing, this is your chance to get in at a ground-floor price. Close to downtown shops, restaurants, and cultural attractions with easy access to outdoor recreation, hiking, and skiing. Schedule your showing today!
-
2008-02-27historical
-
2007-05-03$123,500
-
2007-05-01historical
-
2006-11-21$123,500
-
2006-11-08historical
-
2006-11-02$135,000
-
2004-05-13soldstatus $92,000
-
1987-03-13soldstatus $46,000
ⓘ Source: listings_history table (triggers on properties + properties_extension) + one-shot
backfill from property_details.listing_events for pre-trigger history.
Climate risk First Street
- Flood 1/10 Low FEMA zone X · 0% chance over 30 yrs
- Wildfire 3/10 Moderate
- Heat 2/10 Low 8 d/yr ≥92°F today · 19 d/yr by 30 yrs out
- Wind 4/10 Moderate 9% chance of damaging wind over 30 yrs
- Air quality 2/10 Low 0 unhealthy d/yr today · 1 by 30 yrs out
Nearby sold comps map
Loading sold comps map…
Walkable amenities ~0.75 mi
Loading nearby amenities…
Taxation est. · year 1
- Rental income
- $26,951
- − Mortgage interest
- −$1,400
- − Property taxes
- −$375
- − Insurance
- −$125
- − Repairs & maintenance
- −$2,156
- − Management
- −$2,156
- − Depreciation
- −$727
- Taxable income
- $20,011
- Est. tax owed @ 24.0%
- −$4,803
- After-tax cash flow
- $14,415/yr
For passive investors: Depreciation is non-cash, so a rental often shows a tax loss while cash-flowing — sheltering income. Rental losses are passive: they offset passive income freely, and up to $25,000/yr can offset ordinary (W-2) income if you actively participate and your MAGI is under $100k (phasing out to $0 by $150k); unused losses carry forward. On sale, claimed depreciation is recaptured at up to 25%, and gains may owe capital-gains tax (a 1031 exchange can defer both). Figures are a year-1 estimate at your 24.0% rate — not tax advice; consult a CPA.
Schools (NCES district)
- District
- North Adams
- NCES district ID
- 2508670
- Math proficiency
- 14% ▼ -13.00%
- Reading proficiency
- 29% ▼ -11.00%
- Median HH income
- $36,746
- Composite
- 17.83/100
- National rank
- #9006
- State rank
- #291 of 302 in MA
Livability — North Adams
- Score
- 55/100
- State rank
- #242
- US rank
- #23506
Category grades
Schools grade is shown separately in the Schools card above.
Census & demographics
- Census place
- North Adams, MA
- City population
- 14,967
- Population (ZIP)
- 14,967
Population outlook (Berkshire County) Hauer SSP2
- Today (2025)
- 119,723 people
- By 2030
- 114,608 · -4.3%
- By 2040
- 102,806 · -14.1%
- By 2050
- 91,305 · -23.7%
- By 2075
- 71,517 · -40.3%
- By 2100
- 57,988 · -51.6%
Race, ethnicity, and origin ACS 2023
- Neighborhood character
- Predominantly White (88%)
- Race & ethnicity
- White 88% Hispanic / Latino 5% Two or more races 4% Asian 3%
- Hispanic origin (detail)
- Puerto Rican 1%
- Common ancestry
- Lithuanian 15% Romanian 4% German 2%
- Foreign-born
- 5% · Canada
- Languages at home
- 95% English-only · Other Indo-European 2% Spanish 2% French/Haitian/Cajun 0%
Political lean MEDSL · Berkshire
- 2024 margin
- Solid D (+39.9) · D 68.9% · R 29.0% · Other 2.1%
- 2008→2024 swing
- -12.5pp toward R · 2008: 52.4pp · 2024: 39.9pp
- All cycles
- 2024: D+39.9 2020: D+47.1 2016: D+41.5 2012: D+53.7 2008: D+52.4
Not yet ingested
- Civics
- —
Market trends
- HPI YoY
- ▼ -6.22%
- Current HPI
- 298.8949
- Rent YoY
- —
- Metro
- —
- State GDP YoY
- ▲ 2.28%
- F500 in state
- 38
Industry mix (Fortune 500 HQ in MA)
| Industry | F500 HQs | Revenue |
|---|---|---|
| Technology | 3 | $17B |
|
||
| Insurance | 2 | $84B |
|
||
| Retail | 2 | $76B |
|
||
| Life Sciences | 1 | $43B |
|
||
| Energy Technology | 1 | $31B |
|
||
| Aerospace / Defense | 1 | $18B |
|
||
Price history
-45.7% since first listed10 events — show timeline
- 2026-05-02 Pending — BCMLS
- 2026-04-15 Listed $25,000 BCMLS
- 2008-02-27 Listing Removed — BCMLS
- 2007-05-03 Listed $123,500 BCMLS
- 2007-05-01 Listing Removed — BCMLS
- 2006-11-21 Listed $123,500 BCMLS
- 2006-11-08 Listing Removed — BCMLS
- 2006-11-02 Listed $135,000 BCMLS
- 2004-05-13 Sold (Public Records) $92,000 Public Records
- 1987-03-13 Sold (Public Records) $46,000 Public Records
Property tax history
+2.1%/yrLatest (2023): $2,158 · +9.2% YoY. Source: county tax records.
Cash-flow waterfall
monthlySold comps — $/sqft
last 12 mo · ≤1 miLoading sold comps…