 Fourplex
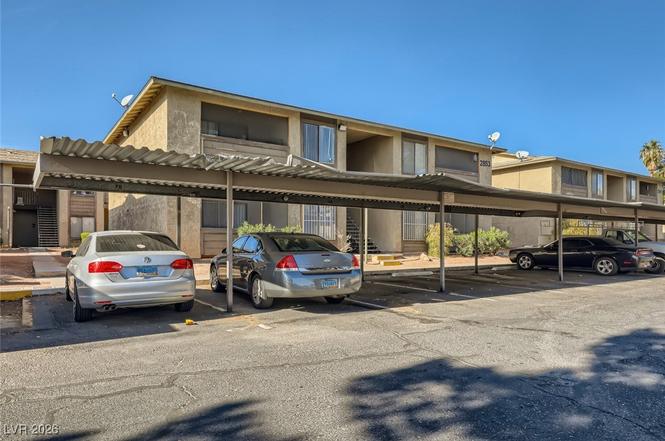
2853 Wheelwright Dr · Sunrise Manor, NV
Flood risk 1/10 · Minimal
- FEMA flood zone
- X (unshaded)
- Chance of flooding over 30 yrs
- 0.0%
- Est. flood insurance / yr
- $507 – $1,088
Fire risk 1/10 · Minimal
- Est. fire insurance / yr
- $490 – $910
Heat risk 8/10 · Major
- Hot days now (above 108°F)
- 7 days/yr
- Hot days in 30 yrs
- 17 days/yr
Wind risk 1/10 · Minimal
- Chance of severe wind over 30 yrs
- —
Air-quality risk 3/10 · Minor
- Unhealthy air days now
- 3 days/yr
- Unhealthy air days in 30 yrs
- 4 days/yr
Risk factors via First Street. Map © Google.
Why this score? — see what drove the D grade
The composite is a weighted blend of 9 inputs, each scored 0–100. Each bar is that input's sub-score; the figure is the points it added to the 100-point composite (weight × sub-score).
- Cash flow +16.5/30.0
- ARV discount +7.5/15.0
- DSCR +5.1/10.0
- 1% rule +3.4/10.0
- Livability +2.9/5.0
- Schools +2.6/10.0
- Rent growth +2.5/5.0
- Condition / age +2.5/5.0
- Appreciation +0.0/10.0
$575,000
🖨 Deal sheet (PDF) 📄 Offer letter ✓ Due diligence
Multi-family units
County records classify this as Multi-Family (2-4 Unit). Listing-text estimate: 4 units. confirmed
Listing remarks MLS
AMAZING FOURPLEX OPPORTUNITY. .. ALL UNITS ARE (2) BEDROOMS (2) BATHROOMS. BUILDING IS IN EXCELLENT CONDITION. .OPEN FLOOR PLANS. WASHER/DRYER AND DISHWASHER IN ALL UNITS. NEW ROOF WAS JUST INSTALLED JULY 2022.. COVERED PARKING. . GREAT COMMUNITY WITH A POOL!! AWESOME INVESTMENT OPPORTUNITY!! HOA DUES INCLUDE TRASH, SEWER. .. WALK TO PARK AND BUS LINES. BUYER TO VERIFY ALL INFORMATION
Key facts
- Covered parking
- Walkable to park
- Open floor plans
Tags
Neighborhood map
What this means for you Summary
Snapshot
- This is a 4 × 2-bed/2.0-bath units multifamily listed at $575k.
Deal economics
- At list price, monthly cash flow is $335 ($4k/yr) — positive. Per door: $84/mo.
- The deal already cash-flows at list — no discount required.
- To meet the 1% rule (rent ≥ 1% of price), the offer needs to be $484k (15.8% below list).
- Recommended offer: $484k (15.8% below list) — sets the bar for 1% rule.
Location & tenants
- Location reads 58/100 on livability (#83 in NV) — a working-class tenant base; expect higher turnover. Strengths: cost of living A+, housing A+; Watch: employment D, crime F, amenities F.
- Clark County School District (urban): math 21% / reading 39% proficiency, ranked #11 of 17 in NV (top 65%) — families likely to look elsewhere, expect single-tenant / working-renter base with shorter leases.
- Zoned schools: Dearing Laura Es (math 12% / reading 18%, grade F, #338 of 402 statewide, top 85%, 837 students, 100% FRL); Mack Jerome Ms (math 8% / reading 17%, grade F, #102 of 109 statewide, top 94%, 1,069 students, 100% FRL); Chaparral Hs (math 3% / reading 15%, grade F, #128 of 131 statewide, top 98%, 2,256 students, 100% FRL) — zoned schools average 100% FRL vs 52% district-wide (48 pts higher); higher-poverty schools than district average — tighter screening recommended.
- Zoned-school proficiency averages 12% at this address vs 30% district-wide (-18 pts) — the specific schools serving this property underperform the Clark County School District average; the district grade overstates school quality for this exact location.
- Market conditions: Rents soft (-0.1%/yr); 413 active listings in the ZIP; 14,754 units permitted in Clark County in 2024 (2,301 in 5+ unit buildings).
- At $4,839/mo this rent would consume 104% of the median local household income ($56k/yr) (locally 4080% of renters already pay >50% of income on rent) — very limited rent-growth headroom before tenants either downsize or default.
Forward outlook
- Local home prices are declining (-3.0%/yr); year-one equity from $4k of loan paydown is wiped out by about $17k of value loss. Plan a longer hold.
- Clark County population projected at +36% by 2050 — long-run rental-demand tailwind backs the buy-and-hold thesis.
Negotiation context
- It's been on market 24 days — a 2% lower offer ($566k) is reasonable based on typical stale-listing flexibility.
- 3 sale attempts since 4y ago with the ask held roughly flat each time — persistent listings suggest the price (not the market) is what's stuck; bring a comps-based counter.
Risks & watch-outs
- Climate carrying-cost: extreme-heat days projected 7→17/yr by 2055 (HVAC capex compounding) — expect insurance premiums to compound above CPI over the hold.
Questions for the listing agent
- Can we see the unit-by-unit rent roll, current vacancy, and any below-market leases? What's the average tenancy length?
- What capital expenditures (roof, boiler, parking lot, exteriors) have been made in the last 5 years, and what's planned in the next 2?
- Is there a deadline driving the sale (1031 exchange, divorce, estate, relocation)? That informs how much negotiation room exists.
- Schools are F-rated, which usually means shorter tenancies and higher turnover. Who's the typical renter profile here, and what's been the actual vacancy rate?
- Crime grade is F in this area — have there been break-ins, vandalism, or insurance claims at this property in the last 3 years? What carrier currently insures it and at what premium?
- The area grade is low — what's the realistic commute time and amenity access for the typical tenant pool here? Any planned neighborhood developments (good or bad) we should know about?
- What's the average days-on-market for RENTAL listings here right now (not sales)? A rising rental-DOM trend means longer vacancies and softer asking-rent achievability than the comps imply.
- What's the recent tenant-quality profile in this submarket — average credit score on applications, eviction rate, late-payment / NSF rate, and stable-employment percentage? A property-management company in the area should have these aggregated.
- How much new apartment / multifamily construction is in the pipeline within 1–3 miles? Heavy new supply (>2% of stock underway) typically softens rents 12–24 months out; light construction supports rent growth.
Investment metrics
- 1% rule
- 0.84% ✗
- Cap rate
- 6.99%
- Cash-on-cash
- 2.50%
- DSCR
- 1.11
- GRM
- 9.9
CMA / ARV
No comps found within radius.
Projected returns pro-forma
-3.0% appreciation · 0.0% rent growth · sell at horizon
- IRR
- -15.4%
- Equity multiple
- 0.46×
- Total profit
- $-86,231
- Equity at exit
- $85,734
- IRR
- -12.3%
- Equity multiple
- 0.36×
- Total profit
- $-103,318
- Equity at exit
- $49,715
Cash invested: $161,000 (down + closing). Projections, not guarantees.
Landlord ↔ Tenant lean methodology
- Overall (STATE)
- 71 Landlord-Friendly
- State Nevada
- 71 Landlord-Friendly · R+1
- County
- — inherits STATE
- City
- — inherits STATE
ZIP-level market 89121
- Rents YoY
- -0.1%
- Active inventory
- 413
- Price-to-rent
- 39.6×
Monthly cashflow live
- Estimated rent
- $4,839 high interval (Pro) →
- Mortgage (P&I)
- −$3,015
- Tax from tax record
- −$233 /mo · $2,792/yr
- Insurance
- −$240
- HOA
- −$0
- Vacancy / Maint / Mgmt
- −$1,016
- Net cashflow
- $335
Break-even live
Sensitivity live
| Price | -10% $661 | -5% $498 | +0% $335 | +5% $172 | +10% $10 |
|---|---|---|---|---|---|
| Rent | -10% $-47 | -5% $144 | +0% $335 | +5% $526 | +10% $718 |
| Rate | -1.0pp $625 | -0.5pp $481 | base $335 | +0.5pp $186 | +1.0pp $35 |
4-unit breakdown (identical units grouped — click to expand)
| Units | Beds | Baths | Est. rent |
|---|---|---|---|
| 4× units | 2 | 2 | $4,840 |
| #1 | 2 | 2 | $1,210 |
| #2 | 2 | 2 | $1,210 |
| #3 | 2 | 2 | $1,210 |
| #4 | 2 | 2 | $1,210 |
| Total (4 units) | $4,839 | ||
UW: 25.0% down · 7.5% · 30yr · 1.5% tax · 5.0% vac · 8.0% maint · 8.0% mgmt
Financing live
Cash to close
- Down payment
- $143,750
- Closing costs
- $17,250
- Reserves months
- —
- Total cash needed
- —
Loan-product check · same deal, 3 products live
Conventional
25% down · 7.5% · 30yr
- Down + closing
- —
- Monthly P&I
- —
- Monthly cashflow
- —
- DSCR
- —
- Eligible?
- —
Personal DTI + credit; lowest rate.
DSCR
20% down · 8.5% · 30yr
- Down + closing
- —
- Monthly P&I
- —
- Monthly cashflow
- —
- DSCR
- —
- Eligible?
- —
No personal income docs; deal must DSCR.
Hard money
10% down · 12.0% · 12mo
- Down + closing
- —
- Monthly P&I
- —
- Monthly cashflow
- —
- DSCR
- —
- Eligible?
- —
Short-term bridge; refi at stabilization.
Listing history 11 events
-
2026-02-26status Pending
-
2026-02-20status Active
-
2026-02-17status Pending
-
2026-01-30$575,000 Active
-
2022-11-21soldstatus $535,000 Closed 388-char remark
Show marketing remark (388 chars)
AMAZING FOURPLEX OPPORTUNITY. .. ALL UNITS ARE (2) BEDROOMS (2) BATHROOMS. BUILDING IS IN EXCELLENT CONDITION. .OPEN FLOOR PLANS. WASHER/DRYER AND DISHWASHER IN ALL UNITS. NEW ROOF WAS JUST INSTALLED JULY 2022.. COVERED PARKING. . GREAT COMMUNITY WITH A POOL!! AWESOME INVESTMENT OPPORTUNITY!! HOA DUES INCLUDE TRASH, SEWER. .. WALK TO PARK AND BUS LINES. BUYER TO VERIFY ALL INFORMATION
-
2022-11-21soldstatus $535,000
Show marketing remark (388 chars)
AMAZING FOURPLEX OPPORTUNITY. .. ALL UNITS ARE (2) BEDROOMS (2) BATHROOMS. BUILDING IS IN EXCELLENT CONDITION. .OPEN FLOOR PLANS. WASHER/DRYER AND DISHWASHER IN ALL UNITS. NEW ROOF WAS JUST INSTALLED JULY 2022.. COVERED PARKING. . GREAT COMMUNITY WITH A POOL!! AWESOME INVESTMENT OPPORTUNITY!! HOA DUES INCLUDE TRASH, SEWER. .. WALK TO PARK AND BUS LINES. BUYER TO VERIFY ALL INFORMATION
-
2022-10-06status Pending 388-char remark
Show marketing remark (388 chars)
AMAZING FOURPLEX OPPORTUNITY. .. ALL UNITS ARE (2) BEDROOMS (2) BATHROOMS. BUILDING IS IN EXCELLENT CONDITION. .OPEN FLOOR PLANS. WASHER/DRYER AND DISHWASHER IN ALL UNITS. NEW ROOF WAS JUST INSTALLED JULY 2022.. COVERED PARKING. . GREAT COMMUNITY WITH A POOL!! AWESOME INVESTMENT OPPORTUNITY!! HOA DUES INCLUDE TRASH, SEWER. .. WALK TO PARK AND BUS LINES. BUYER TO VERIFY ALL INFORMATION
-
2022-08-01$529,000 Active 388-char remark
Show marketing remark (388 chars)
AMAZING FOURPLEX OPPORTUNITY. .. ALL UNITS ARE (2) BEDROOMS (2) BATHROOMS. BUILDING IS IN EXCELLENT CONDITION. .OPEN FLOOR PLANS. WASHER/DRYER AND DISHWASHER IN ALL UNITS. NEW ROOF WAS JUST INSTALLED JULY 2022.. COVERED PARKING. . GREAT COMMUNITY WITH A POOL!! AWESOME INVESTMENT OPPORTUNITY!! HOA DUES INCLUDE TRASH, SEWER. .. WALK TO PARK AND BUS LINES. BUYER TO VERIFY ALL INFORMATION
-
2003-09-30soldstatus $256,000
-
1999-07-08soldstatus $185,000
-
1990-03-21soldstatus $180,000
ⓘ Source: listings_history table (triggers on properties + properties_extension) + one-shot
backfill from property_details.listing_events for pre-trigger history.
Tax reassessment forecast NV · Resets to sale price
- Current annual tax
- $2,792 · $233/mo
- Projected year-2 tax
- $3,392 · $283/mo
- Expected delta
- +$601/yr (+$50/mo · 21.5%)
ⓘ Screening estimate from a state-policy table — verify with the county assessor before closing.
Climate risk First Street
- Flood 1/10 Low FEMA zone X (unshaded) · 0% chance over 30 yrs
- Wildfire 1/10 Low
- Heat 8/10 Severe 7 d/yr ≥108°F today · 17 d/yr by 30 yrs out
- Wind 1/10 Low
- Air quality 3/10 Moderate 3 unhealthy d/yr today · 4 by 30 yrs out
Nearby sold comps map
Loading sold comps map…
Walkable amenities ~0.75 mi
Loading nearby amenities…
Taxation est. · year 1
- Rental income
- $58,068
- − Mortgage interest
- −$32,209
- − Property taxes
- −$2,792
- − Insurance
- −$2,875
- − Repairs & maintenance
- −$4,645
- − Management
- −$4,645
- − Depreciation
- −$16,727
- Taxable loss
- −$5,826
- Est. tax savings @ 24.0%
- +$1,398
- After-tax cash flow
- $5,421/yr
For passive investors: Depreciation is non-cash, so a rental often shows a tax loss while cash-flowing — sheltering income. Rental losses are passive: they offset passive income freely, and up to $25,000/yr can offset ordinary (W-2) income if you actively participate and your MAGI is under $100k (phasing out to $0 by $150k); unused losses carry forward. On sale, claimed depreciation is recaptured at up to 25%, and gains may owe capital-gains tax (a 1031 exchange can defer both). Figures are a year-1 estimate at your 24.0% rate — not tax advice; consult a CPA.
Schools (NCES district)
- District
- Clark County School District
- NCES district ID
- 3200060
- Math proficiency
- 21% ▼ -13.00%
- Reading proficiency
- 39% ▼ -8.00%
- Median HH income
- $53,611
- Composite
- 26.48/100
- National rank
- #7211
- State rank
- #11 of 17 in NV
Livability — Sunrise Manor
- Score
- 58/100
- State rank
- #83
- US rank
- #20692
Category grades
Schools grade is shown separately in the Schools card above.
Census & demographics
- Census place
- Sunrise Manor, NV
- County
- Clark County · 2,306,105 people
- City population
- 102,557
- Metro
- Las Vegas-Henderson-Paradise, NV
- Population (ZIP)
- 68,406
- Household income
- $55,758
- Rent vs Own
- Severe rent burden
- 4080.0
Population outlook (Clark County) Hauer SSP2
- Today (2025)
- 2,504,101 people
- By 2030
- 2,693,770 · +7.6%
- By 2040
- 3,061,208 · +22.2%
- By 2050
- 3,400,072 · +35.8%
- By 2075
- 4,139,522 · +65.3%
- By 2100
- 4,596,916 · +83.6%
Race, ethnicity, and origin ACS 2023
- Neighborhood character
- Diverse neighborhood (Simpson 0.65)
- Race & ethnicity
- Hispanic / Latino 49% White 31% Two or more races 16% Black 11% Asian 4% Native American 1%
- Hispanic origin (detail)
- Mexican 30% Puerto Rican 1% Cuban 5%
- Common ancestry
- Lithuanian 2% Romanian 1% Slovak 1%
- Foreign-born
- 27% · Canada, Dominican Republic, Jamaica
- Languages at home
- 57% English-only · Spanish 37% Tagalog/Filipino 2% Other Asian/Pacific 1%
Political lean MEDSL · Clark
- 2024 margin
- Toss-up / Even · D 50.4% · R 47.8% · Other 1.7%
- 2008→2024 swing
- -16.5pp toward R · 2008: 19.1pp · 2024: 2.6pp
- All cycles
- 2024: D+2.6 2020: D+9.3 2016: D+10.7 2012: D+14.5 2008: D+19.1
Not yet ingested
- Civics
- —
Market trends
- HPI YoY
- ▼ -241.85%
- Current HPI
- 302.201
- Rent YoY
- ▼ -0.10%
- Metro
- Las Vegas-Henderson-Paradise, NV
- State GDP YoY
- ▲ 3.08%
- F500 in state
- 6
Industry mix (Fortune 500 HQ in NV)
| Industry | F500 HQs | Revenue |
|---|---|---|
| Hotels / Casinos | 3 | $36B |
|
||
Price history
+219.4% since first listed11 events — show timeline
- 2026-02-26 Pending — GLVAR
- 2026-02-20 Relisted — GLVAR
- 2026-02-17 Pending — GLVAR
- 2026-01-30 Listed $575,000 GLVAR
- 2022-11-21 Sold (Public Records) $535,000 Public Records
- 2022-11-21 Sold (MLS) $535,000 GLVAR
- 2022-10-06 Pending — GLVAR
- 2022-08-01 Listed $529,000 GLVAR
- 2003-09-30 Sold (Public Records) $256,000 Public Records
- 1999-07-08 Sold (Public Records) $185,000 Public Records
- 1990-03-21 Sold (Public Records) $180,000 Public Records
Property tax history
+1.2%/yrLatest (2025): $2,792 · +7.9% YoY. Source: county tax records.
Cash-flow waterfall
monthlySold comps — $/sqft
last 12 mo · ≤1 miLoading sold comps…